RESUME
JOB SEARCH
2015
Anthony Carnevale
Tamara Jayasundera
Dmitri Repnikov
Artem Gulish
Center on Education and the Workforce McCourt School of Public Policy
State Online College Job Market
RANKING THE STATES
State Online College Job Market
Acknowledgments
We would like to express our gratitude to the individuals and organizations that have made this report possible. First, we thank the Bill & Melinda Gates Foundation, Lumina Foundation, and the Joyce Foundation for their support of our research over the past few years. In particular, we are grateful for the support of Daniel Greenstein and Elise Miller from Gates; Jamie Merisotis and Holly Zanville from Lumina; and Matthew Muench and Whitney Smith from Joyce. We are honored to be partners in their mission of promoting postsecondary access and completion for all Americans.
We have been working with the underlying data for this report for a long time. The world of online job ads data is a new territory for us and, before producing a report, we wanted to understand the data better. During that time, many individuals have worked with us and have demonstrated great patience.
Special thanks go to Burning Glass Technologies for providing access to its data for this report and for offering timely data updates. Burning Glass Technologies was the only vendor that allowed us to explore the raw job ads data openly. With its help, we were able to understand the accuracy and limitations of the data.
Thanks also go to Andrew R. Hanson for providing superb research and writing assistance throughout; Ryan Clennan and his team at Studiografik, the report’s designers, for their outstanding creative work; Tracy Thompson, Nancy Lewis, and Jim McNeil, the report’s editors; and Westland Printers, especially Rick Miller, whose staff produced the print versions of the report. Without their support, this report would not have been possible. Our thanks also go to our colleagues, whose support was vital to our success:
• Nicole Smith and Jeff Strohl provided strong data and research expertise and contributed to strategic and editorial decisions.
• Stephen J. Rose advised our methodological decisions. • Ban Cheah imputed the missing education data.
• Andrea Porter provided strategic guidance in the design and production of the report. • Ana Castanon assisted with the design and other logistics of producing the report. Many have contributed their thoughts and feedback throughout the production of this report. That said, all errors, omissions, and views remain the responsibility of the authors.
The views expressed in this publication are those of the authors and do not necessarily represent those of Burning Glass Technologies or our funders, the Bill & Melinda Gates Foundation, Lumina Foundation, or the Joyce Foundation, their officers, or employees.
| 1
Table of Contents
Introduction 5
Part 1. Occupations 13
Managerial and professional office occupations 16
STEM occupations 18
Sales and office support occupations 20 Healthcare professional and technical occupations 22
Education occupations 24
Community services and the arts occupations 26 Food and personal service occupations 28
Blue-collar occupations 30
Part 2. Industries 32
Consulting and business services 33
Healthcare services 35
Financial services 37
Education services 39
Manufacturing 41
Wholesale and retail trade services 43
Government services 45
Leisure and hospitality services 47
Appendix 49
Online job ads as ‘real-time’ proxy for labor demand 49
Adjustments to the data 51
Location quotient 53
2 | PART 1. OCCUPATIONS
Figures
Figure I. California, Texas, and New York have the most online job ads that
require at least a Bachelor’s degree. 6
Figure II. Massachusetts, Delaware, and Washington State are the most favorable online college labor markets, while West Virginia, Rhode Island,
and South Carolina are the least favorable. 9
Figure 1.1. STEM, managerial and professional office, and healthcare professional and technical occupations with the highest number of job ads per 100 workers provide the best prospects for college graduates, 14
Figure 2.1. Information services, consulting and business services, and financial services provide the best prospects for college graduates,
with the highest number of job ads per 100 workers. 32
Tables
Table 1.1. Across all occupations, Massachusetts, Delaware, and
Washington State have the most favorable online college labor markets, while West Virginia, Rhode Island, and South Carolina have the least favorable
online college labor markets. 15
Table 1.2. Between 2010 and 2013, managerial and professional office college jobs grew the most in South Carolina, Mississippi, and Alabama,
and declined the most in Louisiana, Arizona, and Wyoming. 16
Table 1.3. Massachusetts, Delaware, and Washington State have
the most favorable managerial and professional office online college labor markets, while West Virginia, Mississippi, and South Carolina have
the least favorable. 17
Table 1.4. Between 2010 and 2013, STEM college jobs grew the most in Wyoming, Missouri, and Wisconsin, and declined the most in Tennessee,
Colorado, and South Dakota. 18
Table 1.5. Delaware, Massachusetts, and New York have the most favorable STEM online college labor markets, while New Mexico, West Virginia, and
Maine have the least favorable STEM online college labor markets. 19
Table 1.6. Between 2010 and 2013, sales and office support college jobs grew the most in North Dakota, Alabama, and Pennsylvania and declined
the most in Montana and Idaho. 20
Table 1.7. Montana, Massachusetts, and Idaho have the most favorable sales and office support online college labor markets, while West Virginia, South Carolina, and Vermont have the least favorable sales and office
support online college labor markets. 21
Table 1.8. Between 2010 and 2013, healthcare professional and technical college jobs grew the most in Wisconsin, Delaware, and Alabama, and
| 3 PART 1. OCCUPATIONS
Table 1.9. Alaska, Montana, and New Mexico have the most favorable labor markets for online healthcare professional and technical job ads, while
Wisconsin, New Jersey, and Louisiana have the least favorable. 23
Table 1.10. Between 2010 and 2013, education college jobs grew the most in New Mexico, Ohio, and Arkansas, and declined the most in Arizona,
New Jersey, and Indiana. 24
Table 1.11. South Dakota, Vermont, and Maine are the best labor markets for online education job ads, while Rhode Island, Alabama, and Arkansas
rank as the worst. 25
Table 1.12. New Jersey, Pennsylvania, and Alaska topped employment growth in community services and the arts, while Kansas, Wyoming, and Nebraska
saw the greatest declines. 26
Table 1.13. Delaware, Washington, and Kansas have the best online college labor markets for job seekers in community services and the arts, while
South Carolina, Rhode Island, and Hawaii have the least favorable. 27
Table 1.14. Between 2010 and 2013, food and personal services college jobs more than doubled in Rhode Island and Nebraska, and declined the most
in New Hampshire, Massachusetts, and Georgia. 28
Table 1.15. Montana, Massachusetts, and Colorado have the best food and personal services online college labor markets, while Tennessee,
Rhode Island, and Wisconsin have the least favorable. 29
Table 1.16. Between 2010 and 2013, blue-collar college jobs grew the most in Ohio, Kansas, and Wyoming, and declined the most in Hawaii,
Pennsylvania, and Maryland. 30
Table 1.17. North Dakota, Montana, and Massachusetts have the best blue-collar online college labor markets, while Rhode Island, Vermont,
and Hawaii have the least favorable. 31
Table 2.1. Between 2010 and 2013, employment grew by 12 percent in the consulting and business services industry. Alabama, Oklahoma, and Utah had the largest job growth, while Ohio, Arizona, and Iowa had
the largest job declines. 33
Table 2.2. Delaware, Ohio, and Massachusetts have the most favorable
job markets in consulting and business services; Rhode Island, New Mexico,
and New Hampshire have the least favorable. 34
Table 2.3. Alabama, Delaware, and West Virginia had the biggest growth in employment among college graduates in the healthcare services industry.
Montana, Tennessee, and Oklahoma had the biggest losses. 35
Table 2.4. Montana, Colorado, and Washington State have the most
favorable online college labor markets in the healthcare services industry,
while West Virginia, Rhode Island, and New York have the least favorable. 36
Table 2.5. Indiana, South Carolina, and Iowa had the biggest growth in financial services employment among college graduates; Nevada, Hawaii, and
South Dakota had the biggest losses. 37
Table 2.6. Delaware, Alabama, and Massachusetts have the most favorable online college job markets in financial services, while South Carolina,
Mississippi, and Utah have the least favorable job markets. 38
Table 2.7. Hawaii and Pennsylvania had the biggest gains in employment among the college educated in the education services industry. Nevada,
4 | PART 1. OCCUPATIONS
Table 2.8. Alaska, Vermont, and Massachusetts have the most favorable education services online college labor markets, while West Virginia, Hawaii, and Alabama have the least favorable education services online
college labor markets. 40
Table 2.9. Tennessee, Oregon, and Wisconsin had the largest employment growth among the college educated in the manufacturing industry; Kentucky, Arizona, and Virginia had the biggest declines. 41
Table 2.10. Virginia, Maryland, and Massachusetts have the most favorable manufacturing online college labor markets, while Rhode Island,
South Carolina, and Tennessee have the least favorable manufacturing
online college labor markets. 42
Table 2.11. Louisiana, Arkansas, and Delaware had the biggest gains in employment among college graduates in the wholesale and retail
trade services; Idaho, Hawaii, and Texas had the largest losses. 43
Table 2.12. Washington, Oregon, and Idaho have the best job markets for college graduates seeking work in wholesale and retail trade services;
Wyoming, Arkansas, and South Carolina have the most difficult job markets. 44
Table 2.13. Rhode Island, Minnesota, and Nevada had the largest college job growth in government services, while New Hampshire, West Virginia, and
New Jersey had the largest college job declines. 45
Table 2.14. South Dakota, Colorado, and Oklahoma have the most favorable government services online college labor markets, while Rhode Island, Indiana, and Pennsylvania have the least favorable government services
online college labor markets. 46
Table 2.15. Rhode Island, Florida, and New Jersey had the largest college job growth in the leisure and hospitality services, while Ohio, Arizona, and Iowa
had the largest college job declines. 47
Table 2.16. North Carolina, Colorado, and Georgia have the most favorable leisure and hospitality services online college labor markets, while Vermont, Rhode Island, and Wisconsin have the least favorable leisure and hospitality
services online college labor markets. 48
| 5 PART 1. OCCUPATIONS
Introduction
As more Americans connect to the Internet, employers increasingly are using it to fill job openings. We estimate that between 60 and 70 percent of job openings are now advertised online, and the online job market continues to grow each year.1 Nearly 4
million unique job advertisements are posted online each quarter.
College graduates2 are more likely to own personal computers, have access to the
Internet at home, and to search for jobs online. For these reasons, online job ads are disproportionately aimed at college graduates. Nearly half of all online job ads cater to college graduates, while only 35 percent of workers have college degrees. Between 80 and 90 percent of job openings that require at least a Bachelor’s degree are posted online, compared to just 50 percent of job openings seeking candidates with less education.3
The Internet also substantially expands the geographic scope of college graduates’ job searches, giving them another advantage over their less-educated peers. Overall, job candidates who search online find jobs 25 percent faster than those who do not.4
As vendors began collecting and storing online job ads data, a new “Big Data” tool emerged of particular interest to employers, researchers, and policymakers. In The
Online College Labor Market, we analyzed the national labor market demand for college
graduates by occupation, industry, and education.5 We found that two large occupational
clusters – managerial and professional office and science, technology, engineering, and mathematics (STEM) – dominate the online college labor market, accounting for three out of every five online job ads. These occupations offer high wages, upward career mobility, and job stability. The industries that account for the largest shares of online job ads are also those that employ higher shares of college graduates. The consulting and business services,6 healthcare services, and financial services sectors generate more than
half of all job ads for college-educated job candidates.
In this report, we analyze the online college labor market on a state-by-state basis, using data from Burning Glass Technologies, one of the leading developers of online job ads data. We examine the geographic distribution of online job ads for college graduates within industries and occupational clusters, and compare the relative strength of the online college labor markets across states.7 Specifically, we analyze the online college
1 Carnevale, Jayasundera, and Repnikov, The Online College Labor Market, 2014.
2 In this report, the terms college graduates, college-educated (workers or job seekers), and college labor market refer to
individuals with at least a Bachelor’s degree.
3 Carnevale, Jayasundera, and Repnikov, Understanding Online Job Ads Data: A Technical Report, 2014. 4 Kuhn and Mansour, “Is Internet Job Search Still Ineffective?” 2011.
5 Careful analyses by the Georgetown University Center on Education and the Workforce have established that online job ads
are disproportionately aimed at college-educated workers. For that reason, this report focuses solely on job opportunities for individuals with at least a Bachelor's degree.
6 Throughout this report, the term "consulting and business services” refers to the sector known as the "professional and
business services” industry.
7 All the employment figures and analysis presented in this report are limited to college graduates, as online job ads data
6 | INTRODUCTION
California, Texas, and New York have the most online job ads that require at least a Bachelor’s degree.
Source: Georgetown University Center on Education and the Workforce analysis of Burning Glass online job ads data, 2013 Q2.
Less than 4,500
4,501-7,500
7,501-20,500
20,501-55,500
55,501-80,500
More than 80,501
AL 20,300
AK 4,900
AZ
34,700 8,800AR
CA 266,100 CO 48,200 CT 28,700 DE 7,300 DC 26,600 FL 81,200 GA 59,100 HI 4,300 ID 6,700 IL 85,700 IN 25,100 IA 19,800 KS
15,800 15,000KY
LA 15,300 ME 6,000 MD 44,000 MA 94,600 MI 54,700 MN 44,100 MS 6,500 MO 28,800 MT 5,600 NE 10,200 NV 9,100 NH 7,400 NJ 62,900 NM 7,900 NY 129,100 NC 49,200 ND 4,100 OH 55,300 OK 13,700 OR 26,000 PA 62,700 RI 3,900 SC 13,900 SD 4,500 TN 23,700 TX 143,200 UT 11,700 VT 3,300 VA 61,100 WA 65,400 WV 4,600 WI 24,500 WY 1,900
FIGURE I.
| 7 INTRODUCTION
Less than 4,500
4,501-7,500
7,501-20,500
20,501-55,500
55,501-80,500
More than 80,501
AL 20,300
AK 4,900
AZ
34,700 8,800AR
CA 266,100 CO 48,200 CT 28,700 DE 7,300 DC 26,600 FL 81,200 GA 59,100 HI 4,300 ID 6,700 IL 85,700 IN 25,100 IA 19,800 KS
15,800 15,000KY
LA 15,300 ME 6,000 MD 44,000 MA 94,600 MI 54,700 MN 44,100 MS 6,500 MO 28,800 MT 5,600 NE 10,200 NV 9,100 NH 7,400 NJ 62,900 NM 7,900 NY 129,100 NC 49,200 ND 4,100 OH 55,300 OK 13,700 OR 26,000 PA 62,700 RI 3,900 SC 13,900 SD 4,500 TN 23,700 TX 143,200 UT 11,700 VT 3,300 VA 61,100 WA 65,400 WV 4,600 WI 24,500 WY 1,900
8 | INTRODUCTION
labor market by 10 major occupational clusters and 13 industries.8 We also highlight
employment dynamics in each state, such as jobs recovered since the end of the recession, the most in-demand occupations, and employers with the largest recruiting presence as measured by online job ads.
The number of online job ads for college graduates varies greatly across states (Figure I). California, Texas, and New York have the most online job ads for college graduates, while Wyoming, Vermont, and Rhode Island have the fewest. As expected, the number of job ads strongly correlates with the size of the state: more populous states have more ads. However, since more populous states also have more workers and job seekers, this does not provide a useful indication of the health of the college labor market in a given state. To compare state labor markets better across the United States, we control for the number of college-educated workers in each state. Using the location quotient metric, we report the concentration of online job ads for college graduates in a state relative to the state’s employment of college graduates in relation to the national average.9
Ranging from a low of half of the national average to a high of 70 percent above it, this indicator demonstrates significant variation by state that cannot be accounted for by population size or population density of the state; larger states do not necessarily have a higher concentration of job ads. Thus, finding a job is not necessarily easier in larger states, despite their larger volume of online job ads, because the competition for each open position also intensifies. Less populated states like Delaware that have a high concentration of college jobs will inevitably rank high using this metric. Also, Alaska which is sparsely populated and has a hard time attracting college-educated workers, ranks high when using the metric.
The college-educated job seeker who is willing to move to a state with a high concentration of job ads per worker has a greater likelihood of landing a job than remaining in or moving to states with fewer job ads per worker. The college labor markets of Massachusetts, Delaware, and Washington State are the most robust, offering the highest concentrations of online college job ads per worker. Massachusetts has historically had a strong labor market for college graduates due to the large concentration of colleges in the state.
WASHINGTON, D.C. AND MASSACHUSETTS HAVE THE STRONGEST
online college labor markets, while West Virginia and Rhode
Island have the weakest online college labor markets.
8 Because small sample sizes often distort the employment picture between two reference periods, there are states in which we
dropped certain industries and occupational groups because of this issue. Geographical analyses of social science and healthcare support occupations are omitted due to low sample sizes for a large number of states in the Current Population Survey (CPS). Geographical analyses of information services, personal services, transportation and utilities services, construction, and natural resources are omitted due to low sample sizes for a large number of states in CPS for these industries.
9 See the location quotient discussion in the Appendix for a detailed explanation of how the relative strength of each labor
market is estimated. Some small states like Delaware that have a high concentration of college jobs will inevitably rank high using this metric.
| 9 INTRODUCTION
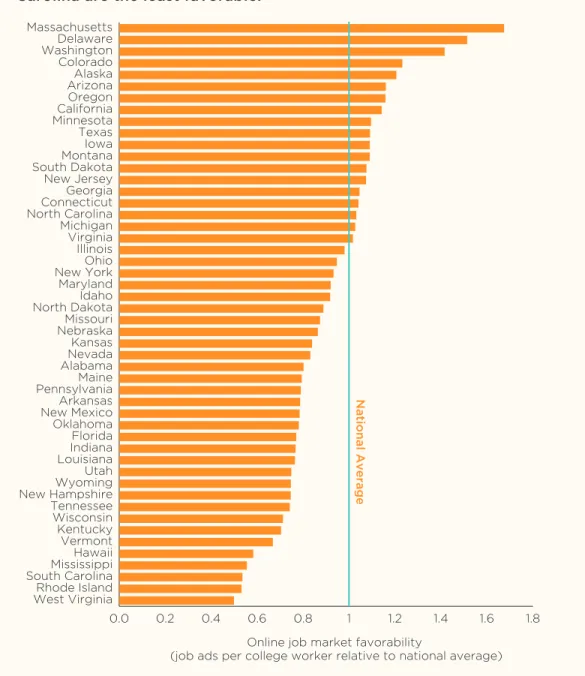
Massachusetts, Delaware, and Washington State are the most favorable online college labor markets, while West Virginia, Rhode Island, and South Carolina are the least favorable.
Source: Georgetown University Center on Education and the Workforce analysis of Burning Glass online job ads data and U.S. Census Bureau Current Population Survey, 2013 Q2.
*Note: The states are listed in ranked (descending) order of labor market favorability. Labor market favorability is based on location quotient estimates. See the Appendix for a brief discussion of location quotients.
FIGURE II.
0.0 0.2 0.4 0.6 0.8 1 1.2 1.4 1.6 1.8 West VirginiaRhode Island
South CarolinaMississippi Hawaii Vermont Kentucky Wisconsin Tennessee New HampshireWyoming Utah LouisianaIndiana Florida Oklahoma New MexicoArkansas PennsylvaniaMaine AlabamaNevada Kansas NebraskaMissouri North DakotaIdaho Maryland New YorkOhio Illinois Virginia Michigan North CarolinaConnecticut Georgia New Jersey South DakotaMontana Iowa Texas MinnesotaCalifornia Oregon ArizonaAlaska Colorado WashingtonDelaware Massachusetts
National Average
Online job market favorability
10 | INTRODUCTION
Despite the state's relatively small college-educated workforce, Delaware ranks among the top due to the high concentration of corporations creating an increased demand for college talent especially in managerial and professional office and STEM jobs. Washington State ranks high due to the presence of tech giants like Microsoft Corp., the largest online retailer, Amazon.com Inc., and related services. Figure II ranks the 50 states by their relative concentration of job ads.
The online college labor market in Washington, D.C., is especially strong. The ratio of online job ads per college-educated worker is three times the national average, substantially greater than that of any state. Stimulated by the presence of the federal government and many international organizations, the city’s unique labor market has been a magnet for highly educated workers. As Richard Florida points out in The Atlantic, “the ultimate source of the region’s wealth is Washington’s unparalleled human capital.”10
With the highest share of college-educated workers in the country, it is a central city that draws workers from surrounding metropolitan areas that include parts of Virginia and Maryland. State labor markets, on the other hand, are more diverse. They have urban centers similar to Washington, D.C., where employers and educated populace tend to concentrate, but they also have rural areas that have relatively few employment opportunities and that demand different skill sets. Thus, comparing Washington, D.C.’s labor market to state labor markets is not an apples-to-apples comparison. For these reasons, we exclude Washington, D.C., from our state-by-state analysis and the ranking tables for occupational clusters and industry sectors.
At the other end of the spectrum, the college labor markets in West Virginia, Rhode Island, and South Carolina are more sluggish, with relatively few online job ads per college-educated worker.
The online demand for college-educated workers also varies substantially across occupations and industries. The top three occupational clusters – managerial and professional office, STEM, and sales and office support – account for three-fourths of the national online labor demand. By contrast, professions within the social sciences and healthcare support are the least in demand, accounting for less than 1 percent of job ads for college graduates.
• In Massachusetts, Delaware, and Washington State, the relative demand for managerial and professional office workers is strong, while in West Virginia, Mississippi, and South Carolina, it is weak.
• In Delaware, Massachusetts, and New York, the relative demand for STEM workers is strong, while in New Mexico, West Virginia, and Maine, it is weak.
• In Montana, Massachusetts, and Idaho, the demand for sales and office support workers is strong, while in West Virginia, South Carolina, and Vermont, it is weak.
| 11 INTRODUCTION
Among industries, consulting and business services and healthcare services account for the largest shares of online job ads that require at least a Bachelor’s degree.
• The relative demand for college-educated workers in the consulting and business services industry is strongest in Delaware, Ohio, and Massachusetts.
• The relative demand for college-educated workers in the healthcare services industry is strongest in Montana, Colorado, and Washington State, and weakest in West Virginia, Rhode Island, and New York.
Thousands of firms, ranging from small local establishments to better-known multinational corporations, use online recruiting to fill job openings. Out of all employers that advertised online in the second quarter of 2013, Accenture, Deloitte Development, Amazon, Verizon Communications, and UnitedHealth Group posted the most online job ads seeking college-educated workers. Accenture and Deloitte Development are both in the consulting and business services industry and, together, posted 11,800 online job ads nationally in the second quarter of 2013. Generally, establishments within healthcare and educational services also have a strong presence in the market for college graduates.
| 13 PART 1. OCCUPATIONS
WASHINGTON, D.C.’S ONLINE COLLEGE LABOR
MARKET IS MORE ROBUST THAN ANY STATE’S,
with three times the national average of job ads per
100 college-educated workers.
Part 1. Occupations
Nationally, employment grew between 2010 and 2013 in every major occupational cluster except education. However, there was significant variation across states. For example, science, technology, engineering, and mathematics (STEM) occupations grew by 15 percent nationally, the largest growth rate among occupational clusters – but that growth was most noticeable in Wyoming, Missouri, and Wisconsin, while Tennessee, Colorado, and South Dakota experienced declines in STEM employment. Healthcare professional and technical employment grew the most in Wisconsin, Delaware, and Alabama, but declined the most in Nebraska, Michigan, and Nevada. Blue-collar employment experienced the greatest growth in Ohio, Kansas, and Wyoming, and showed the steepest declines in Hawaii, Pennsylvania, and Maryland.
However, strong job growth doesn’t necessarily translate into good job prospects, because the number of job seekers in a market affects how competitive that job market is. Ohio and Arkansas, for example, experienced strong education job growth between 2010 and 2013, but both also have large numbers of college-educated workers seeking careers in education relative to the number of available job ads. Conversely, South Dakota, Vermont, and Maine had relatively low education job growth between 2010 and 2013, but the relative lack of competition for those jobs makes those states good education job markets.
Quarterly, there are 1.24 online job ads per 100 college-educated workers in the overall economy (Figure 1.1). STEM jobs offer the best prospects for college graduates, with about three job ads per 100 workers. Managerial and professional office occupations and healthcare professional and technical occupations also offer good prospects. Healthcare support and education occupations, on the other hand, are very competitive, with more than 200 workers per each job ad (0.42 and 0.49 job ad per 100 workers, respectively).11
11 As a result, even if the STEM labor market in a given state is less favorable than the national average, it can have more job ads
per worker than a labor market that is relatively more favorable than the national average in an occupation cluster with lower demand for college workers in the same state, such as the labor market for education occupations. To illustrate, consider the hypothetical example that the STEM labor market in a particular state X is less favorable than the national average with two college job ads per STEM worker, see Figure 1.1. On the other hand, the labor market for education occupations in state X with just one college job ad per worker is relatively more favorable than the national average.
14 | PART 1. OCCUPATIONS
STEM, managerial and professional office, and healthcare professional and technical occupations provide the best prospects for college graduates, with the highest number of job ads per 100 workers.
Source: Georgetown University Center on Education and the Workforce analysis of Burning Glass online job ads data and the U.S. Census Bureau Current Population Survey employment data, 2013 Q2.
FIGURE 1.1.
Healthcare support Education Food and personal services Blue-collar Social sciences Community services and the arts Sales and office support Overall Healthcare professional and technical Managerial and professional office STEM
0.42
3.12 1.38
1.38 1.24 0.98 0.9 0.78 0.52 0.52 0.49
| 15 PART 1. OCCUPATIONS
Across all occupations, Massachusetts, Delaware, and Washington State have the most favorable online college labor markets, while West Virginia, Rhode Island, and South Carolina have the least favorable online college labor markets.
Top Middle Bottom
Massachusetts North Carolina New Mexico Delaware Michigan Oklahoma Washington Virginia Florida Colorado Illinois Indiana Alaska Ohio Louisiana Arizona New York Utah Oregon Maryland Wyoming California Idaho New Hampshire Minnesota North Dakota Tennessee Texas Missouri Wisconsin Iowa Nebraska Kentucky Montana Kansas Vermont South Dakota Nevada Hawaii New Jersey Alabama Mississippi Georgia Maine South Carolina Connecticut Pennsylvania Rhode Island
Arkansas West Virginia
Source: Georgetown University Center on Education and the Workforce analysis of Burning Glass online job ads data and the U.S. Census Bureau Current Population Survey employment data, 2013 Q2. The states are listed in ranked (descending) order.
The favorability of each state’s online college labor market for a given occupation is based on job ads per 100 workers in the state relative to the national average of jobs ads per 100 workers for the given occupation. If a state has high college labor market favorability for a given occupation, it means there are more job ads per 100 workers in that state, and therefore college graduates in that state have better odds of finding a job in that occupation compared to the rest of the country.
16 | PART 1. OCCUPATIONS
Between 2010 and 2013, managerial and professional office college jobs grew the most in South Carolina, Mississippi, and Alabama, and declined the most in Louisiana, Arizona, and Wyoming.
Top States Change Q1-2010 to Q2-2013 (%)
Bottom States Change Q1-2010 to Q2-2013 (%)
South Carolina 74 Connecticut 1 Mississippi 47 New Jersey -2 Alabama 46 West Virginia -3 Idaho 36 Kansas -6 Utah 34 Montana -6 Nebraska 29 Maine -15 Minnesota 29 North Carolina -15 Rhode Island 28 Wyoming -17 Oklahoma 28 Arizona -28 Alaska 27 Louisiana -40
Source: Georgetown University Center on Education and the Workforce analysis of the U.S. Census Bureau
Current Population Survey data (2010–2013). Employment includes all workers with a Bachelor’s degree or
better, aged 18 and older. Here 2010 Q1 is considered to represent the beginning of employment recovery after the 2007 recession.
TABLE 1.2.
Managerial and professional office occupations
North Carolina, which lost 15 percent of its employment in managerial and professional office occupations between 2010 and 2013 (Table 1.2), has more recently become one of the most favorable labor markets for college graduates interested in going into these occupations (Table 1.3).
| 17 PART 1. OCCUPATIONS
Massachusetts, Delaware, and Washington State have the most favorable managerial and professional office online college labor markets, while West Virginia, Mississippi, and South Carolina have the least favorable.
Top Middle Bottom
Massachusetts Minnesota North Dakota Delaware Illinois Maine Washington Iowa Tennessee California Michigan Montana New Jersey Ohio Kentucky New York Missouri Indiana Texas Arkansas Utah
Colorado South Dakota New Hampshire Arizona Louisiana New Mexico Connecticut Nevada Hawaii Alaska Virginia Oklahoma North Carolina Wyoming Idaho Oregon Alabama Rhode Island Georgia Wisconsin Vermont
Maryland South Carolina Kansas Mississippi Nebraska West Virginia Pennsylvania
Florida
Source: Georgetown University Center on Education and the Workforce analysis of Burning Glass online job ads data and the U.S. Census Bureau Current Population Survey employment data, second quarter of 2013. Both, employment and online job ads data, are restricted to those with a Bachelor’s degree or better. The states are listed in ranked (descending) order.
18 | PART 1. OCCUPATIONS
STEM occupations
Oregon showed substantial job growth in STEM occupations between 2010 and 2013 (Table 1.4), and continues to be a good hiring market. Despite job growth during the same period, South Carolina is now a poor hiring market for job seekers in STEM occupations.
Between 2010 and 2013, STEM college jobs grew the most in Wyoming, Missouri, and Wisconsin, and declined the most in Tennessee, Colorado, and South Dakota.
Top States Change Q1-2010 to Q2-2013 (%)
Bottom States Change Q1-2010 to Q2-2013 (%)
Wyoming 85 Alabama -1 Missouri 85 Connecticut -3 Wisconsin 67 Hawaii -4 Utah 56 Vermont -5 North Carolina 55 Oklahoma -5 Oregon 52 Florida -10 Kansas 48 New Hampshire -13 Indiana 46 South Dakota -14 Arizona 39 Colorado -19 South Carolina 38 Tennessee -36
Source: Georgetown University Center on Education and the Workforce analysis of the U.S. Census Bureau
Current Population Survey data (2010–2013). Employment includes all workers with a Bachelor’s degree or
better, aged 18 and older. Here 2010 Q1 is considered to represent the beginning of employment recovery after the 2007 recession.
Note: Arkansas and Mississippi are excluded from this analysis due to small sample sizes.
TABLE 1. 4.
OREGON SHOWED SUBSTANTIAL JOB GROWTH
| 19 PART 1. OCCUPATIONS
Delaware, Massachusetts, and New York have the most favorable STEM online college labor markets, while New Mexico, West Virginia, and Maine have the least favorable STEM online college labor markets.
Top Middle Bottom
Delaware Tennessee Montana Massachusetts Arizona Alaska New York Alabama Louisiana Ohio Illinois Wyoming Oregon Minnesota Utah New Jersey Indiana Kansas Washington Michigan Kentucky California Maryland Idaho Georgia Florida Hawaii Oklahoma Connecticut Arkansas Texas Nevada New Hampshire Virginia Pennsylvania Rhode Island Iowa North Dakota South Carolina Colorado Nebraska Vermont South Dakota Wisconsin Maine North Carolina Missouri West Virginia
New Mexico
Source: Georgetown University Center on Education and the Workforce analysis of Burning Glass online job ads data and the U.S. Census Bureau Current Population Survey employment data, second quarter of 2013. Both, employment and online job ads data, are restricted to those with a Bachelor’s degree or better. The states are listed in ranked (descending) order.
Note: Mississippi is excluded from this analysis due to a small sample size.
20 | PART 1. OCCUPATIONS
Sales and office support occupations
The number of sales and office support jobs grew 32 percent in Alaska between 2010 and 2013 (Table 1.6), and Alaska remains on the list of states with a healthy labor market for these occupations.
Between 2010 and 2013, sales and office support college jobs grew the most in North Dakota, Alabama, and Pennsylvania and declined the most in Montana and Idaho.
Top States Change Q1-2010 to Q2-2013 (%)
Bottom States Change Q1-2010 to Q2-2013 (%)
North Dakota 71 Wisconsin -1 Alabama 42 Minnesota -3 Pennsylvania 40 New Jersey -3 Mississippi 39 Delaware -4 Indiana 32 Maryland -5 New Mexico 32 North Carolina -6 Alaska 32 Hawaii -7 Louisiana 29 New Hampshire -8 Nevada 28 Idaho -35 West Virginia 27 Montana -37
Source: Georgetown University Center on Education and the Workforce analysis of the U.S. Census Bureau
Current Population Survey data (2010–2013). Employment includes all workers with a Bachelor’s degree or
better, aged 18 and older. Here 2010 Q1 is considered to represent the beginning of employment recovery after the 2007 recession.
| 21 PART 1. OCCUPATIONS
Montana, Massachusetts, and Idaho have the most favorable sales and office support online college labor markets, while West Virginia, South Carolina, and Vermont have the least favorable sales and office support online college labor markets.
Top Middle Bottom
Montana Maryland North Dakota Massachusetts Arizona Missouri Idaho Indiana Louisiana Washington Illinois Kentucky Delaware Texas Pennsylvania Alaska Nebraska New Hampshire Minnesota New Jersey Hawaii
Iowa Oklahoma Utah Colorado North Carolina Maine Connecticut New York Tennessee Michigan Arkansas Wisconsin Georgia Virginia Wyoming Oregon Kansas Rhode Island Ohio Florida Mississippi California Alabama Vermont South Dakota Nevada South Carolina
New Mexico West Virginia
Source: Georgetown University Center on Education and the Workforce analysis of Burning Glass online job ads data and the U.S. Census Bureau Current Population Survey employment data, second quarter of 2013. Both, employment and online job ads data, are restricted to those with a Bachelor’s degree or better. The states are listed in ranked (descending) order.
22 | PART 1. OCCUPATIONS
Healthcare professional and technical occupations
Wisconsin, which had the highest job growth in healthcare professional and technical occupations between 2010 and 2013 (Table 1.8), is now the state with the poorest labor market for college graduates looking for work in these occupations (Table 1.9).
Between 2010 and 2013, healthcare professional and technical college jobs grew the most in Wisconsin, Delaware, and Alabama, and declined the most in Nebraska, Michigan, and Nevada.
Top States Change Q1-2010 to Q2-2013 (%)
Bottom States Change Q1-2010 to Q2-2013 (%)
Wisconsin 100 Oregon -5 Delaware 83 Vermont -7 Alabama 74 Tennessee -9 Missouri 67 Oklahoma -12 Kansas 47 Montana -14 Minnesota 44 New Mexico -14 Indiana 42 Alaska -15 Washington 40 Nevada -18 Arizona 36 Michigan -19 Virginia 33 Nebraska -22
Source: Georgetown University Center on Education and the Workforce analysis of the U.S. Census Bureau
Current Population Survey data (2010–2013). Employment includes all workers with a Bachelor’s degree or
better, aged 18 and older. Here 2010 Q1 is considered to represent the beginning of employment recovery after the 2007 recession.
| 23 PART 1. OCCUPATIONS
Alaska, Montana, and New Mexico have the most favorable online labor markets for healthcare professional and technical jobs, while Wisconsin, New Jersey, and Louisiana have the least favorable.
Top Middle Bottom
Alaska Tennessee Mississippi Montana Arkansas Pennsylvania New Mexico Vermont Illinois Washington Georgia Michigan Colorado North Dakota Maryland Iowa Connecticut Alabama Wyoming Ohio West Virginia Massachusetts Florida Utah
Delaware Virginia Nebraska Idaho California Kentucky Arizona Kansas Hawaii Oregon Maine Rhode Island South Dakota New Hampshire New York Texas Missouri Indiana Nevada North Carolina Louisiana Oklahoma South Carolina New Jersey
Minnesota Wisconsin
Source: Georgetown University Center on Education and the Workforce analysis of Burning Glass online job ads data and the U.S. Census Bureau Current Population Survey employment data, second quarter of 2013. Both, employment and online job ads data, are restricted to those with a Bachelor’s degree or better. The states are listed in ranked (descending) order.
24 | PART 1. OCCUPATIONS
Education occupations
New Mexico had the highest job growth in education occupations between 2010 and 2013 and also has one of the more favorable online labor markets for college graduates.
Between 2010 and 2013, education college jobs grew the most in New Mexico, Ohio, and Arkansas, and declined the most in Arizona, New Jersey, and Indiana.
Top States Change Q1-2010 to Q2-2013 (%)
Bottom States Change Q1-2010 to Q2-2013 (%)
New Mexico 42 Louisiana -20 Ohio 30 Kansas -20 Arkansas 29 South Dakota -24 Washington 25 Maine -25 Alabama 23 Missouri -26 Michigan 20 Montana -28 Alaska 17 Nevada -30 Hawaii 17 Indiana -31 Pennsylvania 15 New Jersey -33 South Carolina 15 Arizona -34
Source: Georgetown University Center on Education and the Workforce analysis of the U.S. Census Bureau
Current Population Survey data (2010–2013). Employment includes all workers with a Bachelor’s degree or
better, aged 18 and older. Here 2010 Q1 is considered to represent the beginning of employment recovery after the 2007 recession.
| 25 PART 1. OCCUPATIONS
South Dakota, Vermont, and Maine are the best online labor markets for education jobs, while Rhode Island, Alabama, and Arkansas rank as the worst.
Top Middle Bottom
South Dakota New Jersey Delaware Vermont North Carolina Kentucky Maine Montana Tennessee Alaska Indiana Georgia Massachusetts Oregon Florida Idaho Virginia Maryland Minnesota Iowa Wyoming Arizona Connecticut Ohio Colorado Texas Louisiana Kansas California Hawaii New Hampshire South Carolina New York Nebraska North Dakota Wisconsin Nevada Oklahoma Mississippi Illinois Michigan Pennsylvania Utah Washington Arkansas New Mexico West Virginia Alabama
Missouri Rhode Island
Source: Georgetown University Center on Education and the Workforce analysis of Burning Glass online job ads data and the U.S. Census Bureau Current Population Survey employment data, second quarter of 2013. Both, employment and online job ads data, are restricted to those with a Bachelor’s degree or better. The states are listed in ranked (descending) order.
26 | PART 1. OCCUPATIONS
Community services and the arts occupations
Kansas, which lost nearly half of its employment in community services and the arts occupations between 2010 and 2013 (Table 1.12), is now one of the best labor markets for college graduates looking for jobs in these occupations.
New Jersey, Pennsylvania, and Alaska topped employment growth in
community services and the arts, while Kansas, Wyoming, and Nebraska saw the greatest declines.
Top States Change Q1-2010 to Q2-2013 (%)
Bottom States Change Q1-2010 to Q2-2013 (%)
New Jersey 65 Michigan -16 Pennsylvania 49 Kentucky -17 Alaska 45 Florida -22 South Dakota 45 Washington -23 South Carolina 30 Oklahoma -23 Oregon 29 Delaware -26 New York 27 Missouri -30 Texas 24 Nebraska -32 Georgia 24 Wyoming -37 Iowa 23 Kansas -49
Source: Georgetown University Center on Education and the Workforce analysis of the U.S. Census Bureau
Current Population Survey data (2010–2013). Employment includes all workers with a Bachelor’s degree or
better, aged 18 and older. Here 2010 Q1 is considered to represent the beginning of employment recovery after the 2007 recession.
Note: Alabama, Arkansas, Idaho, Louisiana, Mississippi, New Mexico, Utah and West Virginia are excluded from this analysis due to small samples sizes.
| 27 PART 1. OCCUPATIONS
Delaware, Washington, and Kansas have the best online college labor markets for job seekers in community services and the arts, while South Carolina, Rhode Island, and Hawaii have the least favorable.
Top Middle Bottom
Delaware Colorado North Carolina Washington Wyoming New York Kansas California New Hampshire Nebraska Connecticut Ohio
Massachusetts South Dakota Florida Idaho Virginia Indiana North Dakota Kentucky Alabama Missouri Arkansas Oklahoma Alaska Maryland Wisconsin Utah Arizona Pennsylvania Michigan Texas Tennessee Minnesota New Mexico Vermont Iowa Louisiana New Jersey Oregon Georgia Hawaii Maine Montana Rhode Island Illinois Nevada South Carolina
Source: Georgetown University Center on Education and the Workforce analysis of Burning Glass online job ads data and the U.S. Census Bureau Current Population Survey employment data, second quarter of 2013. Both, employment and online job ads data, are restricted to those with a Bachelor’s degree or better. The states are listed in ranked (descending) order.
Note: Mississippi and West Virginia are excluded from this analysis due to small samples sizes.
28 | PART 1. OCCUPATIONS
Food and personal service occupations
The number of food and personal service jobs grew substantially across the United States between 2010 and 2013, but 93 percent of those jobs were for workers without college degrees. The number of these jobs also varied greatly by state.
Rhode Island and Nebraska both more than doubled the number of jobs in food and personal service between 2010 and 2013 (Table 1.14), yet both are now among the states with the least favorable job market for college-educated job seekers in these occupations.
Between 2010 and 2013, food and personal service college jobs more than doubled in Rhode Island and Nebraska, and declined the most in New Hampshire, Massachusetts, and Georgia.
Top States Change Q1-2010 to Q2-2013 (%)
Bottom States Change Q1-2010 to Q2-2013 (%)
Rhode Island 152 Montana -7 Nebraska 119 Hawaii -7 Delaware 77 Wisconsin -7 Connecticut 73 Washington -8 Missouri 65 Vermont -13 Michigan 60 Oregon -25 Nevada 54 South Dakota -28 Florida 34 Georgia -30 Maryland 24 Massachusetts -34 Maine 19 New Hampshire -39
Source: Georgetown University Center on Education and the Workforce analysis of the U.S. Census Bureau
Current Population Survey data (2010–2013). Employment includes all workers with a Bachelor’s degree or
better, aged 18 and older. Here 2010 Q1 is considered to represent the beginning of employment recovery after the 2007 recession.
Note: Alabama, Arizona, Arkansas, Idaho, Indiana, Kentucky, Louisiana, Mississippi, New Mexico, Oklahoma, South Carolina, Utah, West Virginia, and Wyoming are excluded from this analysis due to their small employment sample sizes.
| 29 PART 1. OCCUPATIONS
Montana, Massachusetts, and Colorado have the best food and personal service online college labor markets, while Tennessee, Rhode Island, and Wisconsin have the least favorable.
Top Middle Bottom
Montana Minnesota Wyoming Massachusetts Delaware Vermont Colorado North Dakota Ohio Washington Kentucky Nebraska New Hampshire Virginia Missouri South Dakota Kansas Oklahoma Georgia Oregon Nevada Connecticut New Jersey Hawaii Alaska Texas Florida Iowa Michigan South Carolina North Carolina Pennsylvania West Virginia Arizona California New York Utah Maine Wisconsin
Illinois Rhode Island Maryland Tennessee
Source: Georgetown University Center on Education and the Workforce analysis of Burning Glass online job ads data and the U.S. Census Bureau Current Population Survey employment data, second quarter of 2013. Both, employment and online job ads data, are restricted to those with a Bachelor’s degree or better. The states are listed in ranked (descending) order.
Note: Alabama, Arkansas, Indiana, Idaho, Louisiana, Mississipppi, New Mexico, and West Virginia are excluded from this analysis due to their small employment sample sizes.
TABLE 1.15.
Rhode Island and Nebraska both more than
DOUBLED THE NUMBER OF JOBS
30 | PART 1. OCCUPATIONS
Blue-collar occupations
Between 2010 and 2013, the number of blue-collar college jobs grew by 12 percent nationally, but that growth was highly uneven. In Ohio, the number nearly doubled, while in Hawaii, Pennsylvania, and Maryland it declined substantially.
Tennessee and Wyoming, which both saw healthy job growth in blue-collar occupations between 2010 and 2013 (Table 1.16), are now poor labor markets for college-educated job seekers in these occupations.
Between 2010 and 2013, blue-collar college jobs grew the most in Ohio, Kansas, and Wyoming, and declined the most in Hawaii, Pennsylvania, and Maryland.
Top States Change Q1-2010 to Q2-2013 (%)
Bottom States Change Q1-2010 to Q2-2013 (%)
Ohio 97 Delaware -4 Kansas 81 Texas -6 Wyoming 73 New Jersey -10 Tennessee 67 Colorado -10 Connecticut 58 Massachusetts -19 South Carolina 48 South Dakota -23 Illinois 40 Nevada -24 Indiana 33 Maryland -25 Georgia 32 Pennsylvania -26 Alaska 27 Hawaii -26
Source: Georgetown University Center on Education and the Workforce analysis of the U.S. Census Bureau
Current Population Survey data (2010–2013). Employment includes all workers with a Bachelor’s degree or
better, aged 18 and older. Here 2010 Q1 is considered to represent the beginning of employment recovery after the 2007 recession.
Note: Alabama, Arizona, Idaho, Louisiana, Mississippi, Missouri, Montana, New Mexico, North Dakota, Oklahoma, and West Virginia are excluded from this analysis due to their small employment sample sizes.
| 31 PART 1. OCCUPATIONS
North Dakota, Montana, and Massachusetts have the best blue-collar online college labor markets, while Rhode Island, Vermont, and Hawaii have the least favorable.
Top Middle Bottom
North Dakota Washington Florida Montana North Carolina Virginia Massachusetts Pennsylvania Wisconsin Michigan Colorado New Jersey Delaware Oregon New York Iowa Texas Kansas Arkansas Nevada Wyoming South Dakota California Utah Maryland Illinois Maine Nebraska Missouri Tennessee Alaska Georgia New Hampshire Alabama Connecticut South Carolina Minnesota Indiana Hawaii
Kentucky Vermont Ohio Rhode Island
Source: Georgetown University Center on Education and the Workforce analysis of Burning Glass online job ads data and the U.S. Census Bureau Current Population Survey employment data, second quarter of 2013. Both, employment and online job ads data, are restricted to those with a Bachelor’s degree or better. The states are listed in ranked (descending) order.
Note: Arizona, Idaho, Louisiana, Mississippi, New Mexico, Oklahoma, and West Virginia are excluded from this analysis due to their small employment sample sizes.
32 | PART 2: INDUSTRIES
Part 2: Industries
Job growth within industries between 2010 and 2013 also varied among states, as does the favorability of current labor markets within industries. But as noted earlier, strong job growth doesn’t necessarily translate into good job prospects: job growth also tends to bring increased competition. In addition, employment statistics cover a three-year period, while the labor market numbers reflect only recent hiring. Finally, an industry that lost many jobs in a state might be in the process of making a comeback – as, for instance, the consulting and business services industry in Ohio, which lost a lot of jobs between 2010 and 2013 but which, based on the number of online job ads, appears to be making a healthy recovery.
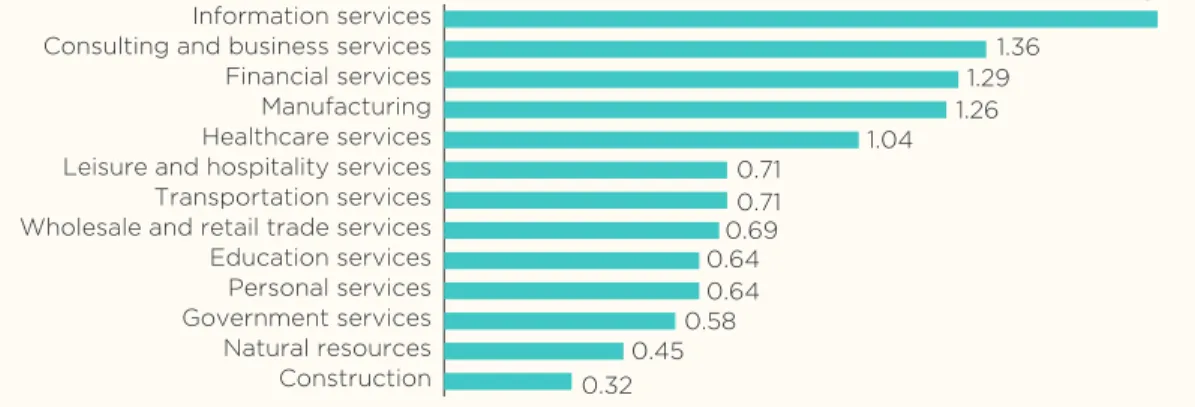
Nationally there are 1.24 job ads per 100 workers. By industry, information services, consulting and business services, and financial services offer the best prospects for college graduates, with 1.29 to 1.79 job ads per 100 workers (Figure 2.1). Conversely, the labor markets in construction and natural resources are quite challenging for college-educated job seekers, with fewer than 0.5 job ads per 100 workers.
Information services, consulting and business services, and financial services provide the best prospects for college graduates, with the highest number of job ads per 100 workers.
Source: Georgetown University Center on Education and the Workforce analysis of Burning Glass online job ads data and the U.S. Census Bureau Current Population Survey employment data, second quarter of 2013.
FIGURE 2.1.
Construction Natural resources Government services Personal services Education services Wholesale and retail trade services Transportation services Leisure and hospitality services Healthcare services Manufacturing Financial services Consulting and business services Information services
0.32
1.79 1.36
1.29 1.26 1.04 0.71
0.71 0.69 0.64 0.64 0.58 0.45
| 33 PART 2: INDUSTRIES
Consulting and business services
Between 2010 and 2013, employment in consulting and business services grew by 12 percent overall, but in no particular geographical pattern. It was down in Georgia and Tennessee, for instance, but up in neighboring Alabama, down in Iowa but up in next-door Missouri.
Between 2010 and 2013, employment grew by 12 percent in the consulting and business services industry. Alabama, Oklahoma, and Utah had the largest job growth, while Ohio, Arizona, and Iowa had the largest job declines.
Top States Change Q1-2010 to Q2-2013 (%)
Bottom States Change Q1-2010 to Q2-2013 (%)
Alabama 127 Massachusetts -2 Oklahoma 71 Georgia -4 Utah 67 Washington -7 Alaska 56 Tennessee -8 Nevada 53 Maine -14 Missouri 46 Louisiana -14 Kentucky 46 Colorado -15 West Virginia 45 Iowa -16 Montana 40 Arizona -20 Michigan 36 Ohio -24
Source: Georgetown University Center on Education and the Workforce analysis of the U.S. Census Bureau
Current Population Survey data (2010–2013). Employment includes all workers with a Bachelor’s degree or
better, aged 18 and older. Here 2010 Q1 is considered to represent the beginning of employment recovery after the 2007 recession.
Note: Arkansas and Mississippi are excluded from this analysis due to their small employment sample sizes.
34 | PART 2: INDUSTRIES
Delaware, Ohio, and Massachusetts have the most favorable job markets in consulting and business services; Rhode Island, New Mexico, and New Hampshire have the least favorable.
Top Middle Bottom
Delaware Pennsylvania South Dakota Ohio New York Mississippi Massachusetts Arizona Utah Iowa Michigan Maine Nebraska Missouri Wyoming Washington Colorado Oklahoma North Carolina Connecticut West Virginia North Dakota Maryland South Carolina Minnesota Tennessee Vermont Virginia Wisconsin Louisiana New Jersey Alaska Arkansas California Idaho Nevada Illinois Kansas Kentucky Oregon Indiana Montana Texas Florida New Hampshire Georgia Alabama New Mexico
Hawaii Rhode Island
Source: Georgetown University Center on Education and the Workforce analysis of Burning Glass online job ads data and the U.S. Census Bureau Current Population Survey employment data, second quarter of 2013. Both, employment and online job ads data, are restricted to those with a Bachelor’s degree or better. The states are listed in ranked (descending) order.
| 35 PART 2: INDUSTRIES
Healthcare services
The healthcare services industry appears to be booming in Washington State and Iowa, where employment grew between 2010 and 2013 and which still appear to be good labor markets. New Mexico, Oklahoma, and Montana saw employment declines between 2010 and 2013, but the labor market in those states now seems to be on the upswing.
Alabama, Delaware, and West Virginia had the biggest growth in
employment among college graduates in the healthcare services industry. Montana, Tennessee, and Oklahoma had the biggest losses.
Top States Change Q1-2010 to Q2-2013 (%)
Bottom States Change Q1-2010 to Q2-2013 (%)
Alabama 60 Oregon 1 Delaware 56 Nebraska 0 West Virginia 54 Louisiana 0 Washington 53 Michigan -5 Missouri 50 Maine -8 Idaho 44 Vermont -9 Iowa 36 New Mexico -12 Indiana 35 Oklahoma -13 Illinois 35 Tennessee -22 Arkansas 34 Montana -22
Source: Georgetown University Center on Education and the Workforce analysis of the U.S. Census Bureau
Current Population Survey data (2010–2013). Employment includes all workers with a Bachelor’s degree or
better, aged 18 and older. Here 2010 Q1 is considered to represent the beginning of employment recovery after the 2007 recession.
TABLE 2.3.
THE HEALTHCARE SERVICES INDUSTRY APPEARS TO BE BOOMING
in Washington State and Iowa.
36 | PART 2: INDUSTRIES
Montana, Colorado, and Washington State have the most favorable online college labor markets in the healthcare services industry, while West Virginia, Rhode Island, and New York have the least favorable.
Top Middle Bottom
Montana Minnesota Maryland Colorado Ohio New Hampshire Washington South Dakota Nevada Alaska North Dakota Illinois Massachusetts Kentucky Wisconsin Utah Maine Pennsylvania Arizona Connecticut Nebraska New Mexico Virginia South Carolina Tennessee Idaho Indiana Oklahoma California Alabama Iowa North Carolina Louisiana Delaware Florida Mississippi Oregon Vermont New Jersey Wyoming Michigan Hawaii Texas Missouri New York Georgia Kansas Rhode Island
Arkansas West Virginia
Source: Georgetown University Center on Education and the Workforce analysis of Burning Glass online job ads data and the U.S. Census Bureau Current Population Survey employment data, second quarter of 2013. Both, employment and online job ads data, are restricted to those with a Bachelor’s degree or better. The states are listed in ranked (descending) order.
| 37 PART 2: INDUSTRIES
Financial services
Between 2010 and 2013, employment for college graduates in the financial services industry increased nationally by 7 percent – and once again, this growth appears to have been geographically divergent. Employment declined in North Carolina, for instance, but grew in South Carolina and Virginia; Wisconsin lost jobs while neighboring Michigan gained. Even though Arizona, Nebraska, North Carolina, and South Dakota lost jobs in the financial services industry between 2010 and 2013, those states now appear to be favorable labor markets for college graduates seeking employment in the industry.
Indiana, South Carolina, and Iowa had the biggest growth in financial services employment among college graduates; Nevada, Hawaii, and South Dakota had the biggest losses.
Top States Change Q1-2010 to Q2-2013 (%)
Bottom States Change Q1-2010 to Q2-2013 (%)
Indiana 77 Kansas -13 South Carolina 74 Maine -17 Iowa 64 Wisconsin -17 Tennessee 61 Nebraska -18 Virginia 47 New Jersey -18 Oklahoma 45 Arizona -22 North Dakota 37 North Carolina -23 Michigan 36 South Dakota -29 Florida 28 Hawaii -33 Colorado 23 Nevada -42
Source: Georgetown University Center on Education and the Workforce analysis of the U.S. Census Bureau
Current Population Survey data (2010–2013). Employment includes all workers with a Bachelor’s degree or
better, aged 18 and older. Here 2010 Q1 is considered to represent the beginning of employment recovery after the 2007 recession.
Note: Alabama, Alaska, Arkansas, Idaho, Mississippi, Montana, New Mexico, West Virginia, and Wyoming are excluded from this analysis due to their small sample sizes.
38 | PART 2: INDUSTRIES
Delaware, Alabama, and Massachusetts have the most favorable online college job markets in financial services, while South Carolina, Mississippi, and Utah have the least favorable job markets.
Top Middle Bottom
Delaware Ohio Indiana Alabama Nevada Hawaii Massachusetts Rhode Island Louisiana Oregon Iowa Florida Idaho New Jersey Kentucky South Dakota Connecticut Colorado Washington Georgia North Dakota Arizona New York Pennsylvania Nebraska Missouri Maine Minnesota Illinois Oklahoma North Carolina California New Hampshire
Texas Vermont Virginia Tennessee Michigan Utah Maryland Mississippi Kansas South Carolina Wisconsin
Source: Georgetown University Center on Education and the Workforce analysis of Burning Glass online job ads data and the U.S. Census Bureau Current Population Survey employment data, second quarter of 2013. Both, employment and online job ads data, are restricted to those with a Bachelor’s degree or better. The states are listed in ranked (descending) order.
Note: Alaska, Arkansas, Montana, New Mexico, West Virginia, and Wyoming are excluded from this analysis due to their small sample sizes.
| 39 PART 2: INDUSTRIES
Education services
Nationally, employment in the education services industry declined 2 percent between 2010 and 2013, with the declines concentrated in the South (Louisiana, Mississippi, and Tennessee) and West (Nevada, Arizona, Idaho, and Montana). But based on more recent online job ads, the industry seems to be making a comeback in Arizona, Idaho, and Nevada.
Hawaii and Pennsylvania had the biggest gains in employment among the college educated in the education services industry. Nevada, New Jersey, and Arizona had the biggest losses.
Top States Change Q1-2010 to Q2-2013 (%)
Bottom States Change Q1-2010 to Q2-2013 (%)
Hawaii 35 Montana -12 Pennsylvania 30 Mississippi -17 New Mexico 27 Idaho -18 Utah 24 Indiana -19 South Carolina 22 Tennessee -21 Ohio 17 Louisiana -23 Washington 16 Kansas -25 Arkansas 14 Arizona -31 Iowa 10 New Jersey -38 Alaska 10 Nevada -41
Source: Georgetown University Center on Education and the Workforce analysis of the U.S. Census Bureau
Current Population Survey data (2010–2013). Employment includes all workers with a Bachelor’s degree or
better, aged 18 and older. Here 2010 Q1 is considered to represent the beginning of employment recovery after the 2007 recession.
40 | PART 2: INDUSTRIES
Alaska, Vermont, and Massachusetts have the most favorable education
services online college labor markets, while West Virginia, Hawaii, and Alabama have the least favorable education services online college labor markets.
Top Middle Bottom
Alaska New Jersey Oregon Vermont Kansas New Mexico Massachusetts Illinois Wisconsin Idaho California Florida South Dakota Iowa Montana Arizona Arkansas South Carolina Minnesota Kentucky Wyoming Maine Oklahoma Missouri Colorado Maryland Georgia Utah Michigan Mississippi Nevada Indiana Pennsylvania Virginia Tennessee Ohio North Carolina Connecticut Louisiana North Dakota Nebraska Rhode Island New Hampshire Delaware Alabama Washington Texas Hawaii
New York West Virginia
Source: Georgetown University Center on Education and the Workforce analysis of Burning Glass online job ads data and the U.S. Census Bureau Current Population Survey employment data, second quarter of 2013. Both, employment and online job ads data, are restricted to those with a Bachelor’s degree or better. The states are listed in ranked (descending) order.
| 41 PART 2: INDUSTRIES
Manufacturing
Between 2010 and 2013, college jobs grew by 19 percent nationally in the manufacturing industry and in Tennessee the number of such jobs more than doubled (Table 2.9). However, Tennessee now ranks near the bottom in terms of online job ads per worker in the manufacturing industry (Table 2.10). But Virginia, which lost 26 percent of its college jobs in the manufacturing industry between 2010 and 2013, now ranks at the top in the number of online job ads for college graduates.
Tennessee, Oregon, and Wisconsin had the largest employment growth among the college educated workers in the manufacturing industry; Kentucky, Arizona, and Virginia had the biggest declines.
Top States Change Q1-2010 to Q2-2013 (%)
Bottom States Change Q1-2010 to Q2-2013 (%)
Tennessee 107 Florida -2 Oregon 85 New Hampshire -3 Wisconsin 68 South Dakota -3 South Carolina 60 Utah -3 Missouri 56 Maryland -4 Indiana 54 Vermont -4 Ohio 48 Delaware -11 Nebraska 47 Virginia -26 Massachusetts 40 Arizona -27 Washington 39 Kentucky -30
Source: Georgetown University Center on Education and the Workforce analysis of the U.S. Census Bureau
Current Population Survey data (2010–2013). Employment includes all workers with a Bachelor’s degree or
better, aged 18 and older. Here 2010 Q1 is considered to represent the beginning of employment recovery after the 2007 recession.
Note: Alabama, Alaska, Arkansas, Hawaii, Louisiana, Mississippi, Montana, Nevada, New Mexico, North Dakota, Oklahoma, West Virginia, and Wyoming are excluded from this analysis due to their small sample sizes.
TABLE 2.9.
Between 2010 and 2013, college jobs grew by
42 | PART 2: INDUSTRIES
Virginia, Maryland, and Massachusetts have the most favorable
manufacturing online college labor markets, while Rhode Island, South Carolina, and Tennessee have the least favorable manufacturing online college labor markets.
Top Middle Bottom
Virginia Georgia Nevada Maryland Kentucky Wisconsin Massachusetts California Minnesota Alabama North Carolina Kansas New Jersey Arkansas Oklahoma Texas Florida Pennsylvania New York Connecticut Utah Iowa Colorado Missouri Nebraska Illinois Oregon Delaware Ohio Indiana
South Dakota West Virginia Arizona Maine
Michigan New Hampshire Idaho Vermont Washington Tennessee
South Carolina Rhode Island
Source: Georgetown University Center on Education and the Workforce analysis of Burning Glass online job ads data and the U.S. Census Bureau Current Population Survey employment data, second quarter of 2013. Both, employment and online job ads data, are restricted to those with a Bachelor’s degree or better. The states are listed in ranked (descending) order.
Note: Alaska, Hawaii, Louisiana, Mississippi, Montana, New Mexico, North Dakota, and Wyoming are excluded from this analysis due to their small sample sizes.
| 43 PART 2: INDUSTRIES
Wholesale and retail trade services
Between 2010 and 2013, employment grew by 3 percent in the wholesale and retail trade services industry. Louisiana and Arkansas experienced the largest growth in jobs within the wholesale and retail trade sector (Table 2.11), yet their job markets tend to be more saturated based on the number of jobs ads to employment base (Table 2.12). Meanwhile, college graduates pursuing careers in this sector face the best prospects in Washington state, Oregon, and Idaho (Table 2.12).
Louisiana, Arkansas, and Delaware had the biggest gains in employment among college graduates in the wholesale and retail trade services; Idaho, Hawaii, and Texas had the largest losses.
Top States Change Q1-2010 to Q2-2013 (%)
Bottom States Change Q1-2010 to Q2-2013 (%)
Louisiana 41 Michigan -8 Arkansas 38 Missouri -9 Delaware 37 Tennessee -9 South Carolina 34 Iowa -9 West Virginia 33 Vermont -13 Kansas 32 Colorado -15 Massachusetts 31 Florida -20 Washington 31 Texas -23 Mississippi 28 Hawaii -37 Pennsylvania 27 Idaho -43
Source: Georgetown University Center on Education and the Workforce analysis of the U.S. Census Bureau
Current Population Survey data (2010–2013). Employment includes all workers with a Bachelor’s degree or
better, aged 18 and older. Here 2010 Q1 is considered to represent the beginning of employment recovery after the 2007 recession.
Note: Alaska, Montana, New Mexico, and Wyoming are excluded from this analysis due to their small sample sizes.
44 | PART 2: INDUSTRIES
Washington state, Oregon, and Idaho have the best job markets for college graduates seeking work in wholesale and retail trade services; Wyoming, Arkansas, and South Carolina have the most difficult job markets in the industry.
Top Middle Bottom
Washington New Jersey Pennsylvania Oregon Colorado Nevada Idaho Hawaii Kansas Montana New Hampshire New Mexico Rhode Island Iowa New York Massachusetts Indiana Maine Alaska Georgia Alabama Minnesota Oklahoma Florida Michigan Ohio West Virginia Wisconsin Illinois Kentucky Delaware Arizona Utah North Dakota Maryland Vermont Missouri Virginia Mississippi Connecticut Tennessee Louisiana Texas South Dakota South Carolina California Nebraska Arkansas
North Carolina Wyoming
Source: Georgetown University Center on Education and the Workforce analysis of Burning Glass online job ads data and the U.S. Census Bureau Current Population Survey employment data, second quarter of 2013. Both, employment and online job ads data, are restricted to those with a Bachelor’s degree or better. The states are listed in ranked (descending) order.