MJCCA9 – 777 ISSN 1857-5552 e-ISSN 1857-5625
Received: May 21, 2019 DOI: 10.20450/mjcce.2019.1648
Accepted: June 19, 2019 Original scientific paper
ISOLATION AND PURIFICATION OF CUCURBITACIN D AND I FROM
ECBALLIUM ELATERIUM (L.) A. RICH FRUIT JUICE
Emir Tosun, Ahmet Baysar*
Department of Chemical Engineering, Faculty of Engineering, İnönü University, 44280 Battalgazi, Malatya, Turkey
ahmet.baysar@inonu.edu.tr
The objective of this study was to develop a rapid, economic, and efficient method for simultane-ous selective isolation, separation, and purification of cucurbitacin D and I from Ecballium elaterium (L.) A. Rich fruit juice via reversed-phase flash chromatography combined with HPLC. The chloroform ex-tract of the fruit juice was fractionated with flash chromatography using a chloroform, acetone and meth-anol solvent combination at a 5 ml/min flow rate. Then, a validated HPLC method was utilized for purifi-cation of the two targeted cucurbitacins. Cucurbitacin D and I were collected automatically by the frac-tion collector. The fracfrac-tions containing the same compounds were pooled and lyophilized. The purified cucurbitacin D and I compounds were identified by NMR, LC-MS, and UV spectra analysis. The results suggest that the applied procedure is simple, quick, and highly efficient. The HPLC method was found to be linear, accurate, precise and rugged for the quantification of the cucurbitacins studied.
Keywords: cucurbitacin D; cucurbitacin I; Ecballium elaterium (L.) A. Rich; isolation; method validation
ИЗОЛАЦИЈА И ПРЕЧИСТУВАЊЕ НА КУКУРБИТАЦИН D И I ОД ОВОШЕН СОК НА ECBALLIUM ELATERIUM (L.) A. RICH
Целта на ова истражување беше да се развие брз, економичен и ефикасен метод за истовремено селективно изолирање, раздвојување и пречистување на кукурбитацин D и I од овошен сок на Ecballium elaterium (L.) A. Rich преку реверзно фазна флеш-хроматографија комбинирана со HPLC. Хлороформскиот екстракт беше фракциниран со флеш-хроматографија со употреба на раствор со комбинација од хлороформ, ацетон и метанол со брзина на проток од 5 ml/min. Потоа беше применет валидиран HPLC метод за пречистување на двата целни кукурбитацини. Кукурбитацини D и I беа автоматски собрани со фракционен колектор. Фракциите што ги содржеа истите соединенија беа обединети и лиофилизирани. Пречистените кукурбитацини D и I беа идентификувани по пат на NMR, LC-MS, и UV спектрална анализа. Беше утврдено дека со методот HPLC е линеарен, точен, прецизен и робустен за квантификација на испитуваните кукурбитацини.
Клучни зборови: кукурбитацинD; кукурбитацин I; Ecballium elaterium (L.) A. Rich; изолација; валидација на метод
1. INTRODUCTION
Ecballium elaterium (L.) A. Rich (E. elate-rium), which grows naturally in the Mediterranean region, is known as the squirting cucumber [1, 2].
used for long time as a folk medicine to specifical-ly treat sinusitis [6, 7].
E. elaterium is a rich source of cucurbitacin type secondary metabolites. The cucurbitacins are a group of highly oxygenated tetracyclic triter-penes having a unique 19-(10→9β)-abeo-10-lanost-5-ene (cucurbitane) skeleton (Fig. 1).
Fig. 1. General structure of cucurbitacins
Cucurbitacins are generally crystalline sub-stances at room temperature. Most of them are slightly soluble in water but very soluble in petro-leum ether, chloroform, benzene, ethyl acetate, methanol and ethanol. Their absorption maxima for ultraviolet light (UV) is between 228 and 234 nm depending on the type of cucurbitacin [2, 8– 10]. The cucurbitacins exhibit a wide range of bio-logical activities in living beings. They have been investigated for their cytotoxic, hepatoprotective, anti-diabetic, anti-bacterial, anti-inflammatory, antimicrobial, cardiovascular, and antioxidant ac-tivities. Additionally, some cucurbitacin species inhibit the proliferation of cancer cells [5, 8–15]. Currently, 12 classes of cucurbitacins are known which contain 16 cucurbitacin types, and they are grouped according to the variations in their molec-ular structure [8, 15]. Cucurbitacins B, E, D and I are the main cucurbitacins in the E. elaterium fruit [7]. Cucurbitacins B, D, E, I, L, R and their deriva-tives have been previously identified in E. elateri-um fruit juice [4, 6].
Some studies report procedures for the ex-traction and isolation of cucurbitacins from differ-ent plants of Cucurbitaceae family [16–18]. The extraction of cucurbitacins is generally applied to
the plant material or to the dried fruit juice using methanol or ethanol. Chloroform is mostly used for the purification of cucurbitacins from the alcoholic extracts because of their partition between water and chloroform [9, 19]. To our knowledge, there is no study on the extraction of cucurbitacin D (Cu D) and cucurbitacin I (Cu I) directly with chloro-form from the juice of the fruit. Isolation can also be accomplished with different chromatographic protocols such as column chromatography and TLC. TLC has been utilized for the purification of cucurbitacins from plant extracts [9, 15, 19–22]. However, these techniques are time and solvent consuming.
Different techniques such as Flash Chroma-tography (FC) and HPLC may be used for the iso-lation and purification of plant extracts. FC is a rapid and economical method for the separation of mixtures at relatively high flow rates. FC offers good separation and can be used in both normal phase and reverse phase separations, but to the best of our knowledge, the use of FC has barely been studied to separate cucurbitacin species [23, 24].
HPLC is a good instrument for separating individual cucurbitacins from mixtures [19]. The use of HPLC coupled to a diode-array (HPLC-DAD) detector has undoubtedly made things much easier, allowing for quick and efficient characteri-zation of crude extracts [9].
An HPLC method using gradient elution of Acetonitrile (ACN) in water has been documented for the analysis of a number of the main cucurbita-cin types commonly found in plants [20, 21, 25– 28]. HPLC purification may be achieved by sepa-rating the target compound from the other pounds. For an optimum purification, each com-pound should give a characteristic peak under the chosen chromatographic conditions such as the proper mobile phase, flow rate, detector, and col-umn type [29]. Table 1 summarizes different ana-lytical and preparative methods for the analysis of cucurbitacins by HPLC in the literature.
The aim of the present study was to develop and validate a simple, rapid, economical, and effi-cient method to simultaneously isolate, separate, purify and identify Cu D and Cu I from E. elateri-um fruit juice with high yield
.
T a b l e 1
Analytical and preparative methods for the analysis of cucurbitacins by HPLC
Stationary phase
(Column) Mobile phase
Flow rate (mL/min)
Elution type and program
Determined cucurbitacin
Wavelenght
(nm) Reference
(A) Analytical; Nucle-osil 100-5 C18 (250 mm × 4 mm i.d; 5 μm) protected by a precol-umn
(B) Semipreparative; C18 (250 mm × 10 mm i.d; 5 μm)
(A) A: H2O: formic
acid (99.5:0.5) B: Methanol: acetoni-trile (50:50) (B) A: H2O: formic
acid (99.5:0.5) B: Methanol: acetoni-trile (50:50)
(A) 0.8 (B) 2
(A) Gradient;
starting at 10% B, 50% B at 16 min, 80% B at 30 min, 100% B at 33 min, B was maintained at 100% for another 2 min. (B) Isocratic
Cucurbitacin B, D, E, I
and glycosides 230 [4]
(A) Preperative; Econosil C18 250 × 22 mm, 10 μm
(B) Analytical; Alltima C18 250 × 4.6 mm i.d., 5 μm
(A) A: Acetonitrile, B: Water or A: Meth-anol, B: Water (B) A: Acetonitrile, B: Water or A: Meth-anol, B: Water
(A) 13 (B) 1
(A) Gradient; Acetonitrile (20-55% in 50 min.), or methanol (60-75% in 50 min.) (B) Acetonitrile (30-70% in 57 min.), and metha-nol (60-75% in 50 min.)
Cucurbitacins unspecified [20]
Eurospher C18
(250 mm × 4 mm i.d; 5 μm)
A: Acetonitrile,
B: Water 1
Gradient; 0–35 min linearly from 20% A to 60% B, 35–40 min line-arly from 60% to 20%, then held for 5 min.
Cucurbitacin E; Cucurbitacin I; Cucurbitacin E glycoside; Cucurbitacin I glycoside
230 [26]
Hewlett Packard 20 cm × 4.6 mm i.d., 10 μm A: Acetonitrile-water (2:8) B: Acetonitrile-water (45:55) 2 Gradient, starting 100% A, 0% A (0-35 min.)
Cucurbitacin B, D, E, I, 3-epi-iso-cucurbitacin D and two glycosides
229 [27]
Kromasil C8 (150 mm × 4.6 mm ID, 5 μm)
Acetonitrile - 2%
Acetic acid 1 Linear gradient
23, 24 –
dihydrocucurbitacin F;23, 24- dihyrocucurbitacin D; Cucurbitacin B; Cucurbitacin E
215 [28]
(A) Analytical; Supel-co®, 150 × 4.6 mm, 5 μm
(B) Preperative; Shimadzu®,
ODS, PREP-ODS, 20 × 250 mm (A) Acetonitrile-Water (40:60) (B) Acetonitrile-Water (42:58) (A) 1.2
(B) 6 Isocratic Dihydrocucurbitacin B;
Cucurbitacin B 230 [30]
TSK Gel ODs 120A 150 × 4.6 mm
Acetonitrile-water
(2:3) 1 Isocratic Cucurbitacin B 230 [31]
Bio-Sil C18 HL 90-5S; 250 × 4.6 mm i.d., 5 μm
A: Acetonitrile
B: Water 2
Gradient; starting 20% A, 45% A (0-35 min.)
Cucurbitacin E 229 [32]
LiChrospher 100 RP-18e (4 mm i.d.×250 mm, 5 μm) Column temperature 40 ℃
0.05% Trifluoroacetic
acid-methanol (42:58) 1 Isocratic
Cucurbitacin E; Cucurbitacin I; Cucurbitacin E glycoside; Cucurbitacin I glycoside
236 [33]
Analytical C18 A: Water,
B: Acetonitrile 1
Gradient; starting with 100% of water and minutes A 80%, B 20%, after 10 min A 60%, B 40% and after 5 min A 40%, B 60%.
Cucurbitacin E;
Cucurbitacin I 229, 254 [34]
2. MATERIALS AND METHODS
2.1. Materials, instruments, standards and reagents
Ripe fruits of E. elaterium were collected in September from Adana province, Turkey and stored at 18 ℃ until processed. The plant was iden-tified by Dr. Turan Arabacı (Faculty of Pharmacy, İnönü University). The voucher specimens were deposited in the Herbarium of İnönü University (INU), Malatya, Turkey.
A Nüve EV 018 vacuum oven (Nüve, Tur-key), a Büchi Rotavapor R-210 (Büchi, Switzer-land), and an Alpha 1-2/LD Plus freeze dryer (Martin Christ, Osterode Germany) were used for sample preparation.
The FC separation was performed on a Büchi (Switzerland) FC system with dual C-601 pump modules, C-615 pump manager, C-660 frac-tion collector, C-635 UV photometer, and silica gel filled (Merck, 70 – 230 mesh) 21.0 × 129 mm pol-ypropylene cartridges.
for purification/separation tests. It had a DAD de-tector (SPD-M20A) equipped with a pump system, an auto sampler (SIL-20A HT), a column heater (CTO-20A), a fraction collector (FRC-10A), and a degasser unit (DGU-20A5).
An Agilent 1100 LC/MSD SL single quad-ruple mass spectrometer (Agilent Technologies, Palo Alto, CA) was used for measuring ESI-MS. 1H NMR spectra were recorded at 600 MHz on a
Bruker Avance III 600 spectrometer (Bruker, Rheinstetten, Germany).
Cu D and Cu I standards (purity of ≥95%) were purchased from Extrasynthese (Genay, France). HPLC grade solvents (acetone, ACN, chloroform, hexane and methanol) were obtained from Carlo Erba (Milan, Italy). All mobile phase solvents were ultrasonically degassed before use. Ultrapure water used for all experiments was pro-duced by a Millipore Synergy UV purification system (Molsheim, France).
2.2. Extraction and isolation of cucurbitacins
The ripe fruits were pressed. The juice was collected and strained. The juice was filtered through a double layer cheesecloth, then through filter paper, and dried in the vacuum oven at 23 ºC. To prevent degradation of secondary metabolites, the residue was stored at about −18 ºC prior to uti-lization for extraction.
Five grams of dried residue was dissolved in 50 ml deionized water. This aqueous solution was extracted three times with 50 ml hexane at 40 ºC for 6 h to remove waxes, pigments, high boiling terpenes, apolar fatty acids, and lipids. After ex-traction, the phases were separated and stored at −18 ℃ until analysis.
The remaining aqueous phase (49 ml) was extracted with chloroform (50 ml), which has high affinity for cucurbitacins. The extraction with chlo-roform was performed three times at room tempera-ture for 6 h. The extract was then filtered and con-centrated to 10 ml by the rotary evaporator under reduced pressure at 40 ºC. This organic phase con-tained a mixture of partially purified cucurbitacins.
FC was used for the fractionation of the chlo-roform extract to obtain pure cucurbitacins in target fractions. The solvent system used for FC was cho-sen from TLC separation experiments. For this pur-pose, the optimum solvent system ratio giving the best separation of Cu D and Cu I was determined from several solvent systems. Standards and test samples were spotted on TLC silica gel 60 F254 alu-minum sheets (Merck, Darmstadt, Germany). The solvent system which gave the best separation was a
chloroform-acetone-methanol (77:10:13; v/v/v) so-lution. The Rf values for Cu D and Cu I were found to be 0.61 and 0.69, respectively.
The flash column was first equilibrated with chloroform, and then the chloroform extract (total of 10 ml) was eluted with isocratic elution using the above solvent system at a constant flow rate of 5 ml/min. The detection wavelength was 254 nm. In total, 42 fractions of varying volumes were col-lected based on absorbance values. The elution solvent of each fraction was evaporated and the residues were dissolved in 2 ml of ethanol. Then, the solution was filtered through a 0.45 μm filter and placed in HPLC vials for testing the presence of Cu D and Cu I by HPLC-DAD. This procedure was repeated for each fraction. Cu D and Cu I identification was performed by comparing reten-tion times and UV spectra of the compounds pre-sent in each fraction and the pure standards. The presence of Cu D and Cu I (in varying amounts) was determined in eleven fractions. These frac-tions were pooled and concentrated by evaporation of ethanol. The remaining solution was about 5 ml, and it was placed in HPLC vials for further separa-tion and purificasepara-tion.
A Nucleosil RP-C18 column (250 mm × 4.6 mm id, 5 μm, pore size, 100 Å) was used for HPLC analysis. The chromatographic conditions were set by a slight modification of a previously described method [27, 32]. ACN/water (20:80, v/v)) and ACN/water (45:55, v/v) were used as mobile phases A and B, respectively. The gradient elution started at 10 % solvent B, gradually in-creased to 100 % solvent B in 60 min, isocratic for 10 min, then decreased to 10 % solvent B in 5 min at a flow rate of 0.75 ml/min for a total period of 75 min. After each test, the column was equilibrat-ed for 5 min.
HPLC analysis was carried out at constant column temperature (40 ºC), and a 10 µl injection volume was taken for qualitative/quantitative anal-ysis. Analyte absorbance was recorded in the range of 190–800 nm by using a DAD detector. Maxi-mum Cu D and Cu I peak absorbances were at 230 and 235 nm, respectively. Most cucurbitacins give UV-absorbance at 229 nm because of their chemi-cal structure [9]. Therefore, the cucurbitacins stud-ied here were fractioned at 229 nm.
I. Cu D and Cu I fractions were pooled separately at room temperature and stored at −18 ºC for further processing. The collected fractions were divided into 5 ml portions for lyophilization and kept at –18 ºC overnight. The frozen samples were lyophilized to obtain solid purified Cu D and Cu I crystals.
2.3. Quantification and identification of the isolated cucurbitacins
Cu D and Cu I standards were used for the quantification and identification of both cucurbita-cin compounds. A stock solution of each standard was prepared in 5 ml ethanol at a concentration of 1 mg/ml for Cu D and 0.22 mg/ml for Cu I. Cali-bration standards were prepared at concentrations ranging from 10 to 500 µg/ml for Cu D and from 5 to 100 µg/ml for Cu I. The calibration curves were separately drawn by plotting the peak area against the concentration of Cu D and Cu I. The curves were analyzed using linear regression equations and correlation coefficients.
Quantification of individual cucurbitacins was directly determined by HPLC-DAD according to the above described HPLC method using external standard curves of the authentic standards. Cu D and Cu I concentrations were determined from the direct correlation between the peak area and amount.
The isolated compounds were further identi-fied by spectroscopic methods including UV, LC-MS and NMR. Isolated Cu D and Cu I samples were dissolved in ethanol and determined by HPLC-DAD according to the method described above on the basis of retention time and by com-parison of UV spectra of the standards. The mass spectrometer was operated in positive ionization mode for both Cu D and Cu I with an ESI source and mass range set to m/z 100–1500. The mobile phase ACN/water/methanol (33:34:33, v/v/v) with 0.1% formic acid (CH2O2) was delivered at a con-stant flow rate of 0.8 ml/min. 1H NMR fingerprints were established to identify the Cu D and Cu I ob-tained by HPLC fractionation.
2.4. Method validation
The developed method was fully validated according to the International Conference on Har-monization guidelines (ICH Q2R1) [35]. Valida-tion tests were performed for the limit of detecValida-tion (LOD), limit of quantification (LOQ), linearity range, accuracy, precision (intra- and inter-day), ruggedness and stability.
The linearity of the method was determined at five different concentration levels
(measure-ments were triplicated) for each cucurbitacin. The calibration curve for each cucurbitacin with the respective correlation coefficient was calculated by least-squares linear regression analysis of the peak area. The LOD and LOQ values were determined at signal-to-noise ratios of 3.3 and 10, respectively. The precision of the method was demonstrated by inter-day (reproducibility) at four different days and intra-day (repeatability) at three times in a day operation under the same conditions, both ex-pressed as variation studies and relative standard deviation (RSD %). The accuracy of the method was determined by calculating the percent recovery of the compounds by the standard addition method. Known amounts of standard solutions of Cu D and Cu I (50, 100, and 150 %) were added to pre-quantified sample solutions, and the quantity of each cucurbitacin was subsequently determined from the corresponding calibration curve. The ac-curacy was evaluated by calculating the mean re-covery values which were calculated according to the following formula:
Recovery (%) = ((detected amount–original amount)/amount spiked) × 100.
The ruggedness of the method was deter-mined by carrying out experiments on two different instruments (Shimadzu and Agilent HPLC, Ag-ilent Technologies, Waldbronn, Germany) and by different operators using different columns (Nucle-osil RP-C18 column and Inertsil ODS 3V C18, 4.6 × 250 mm, 5µm, GL Sciences Inc., Tokyo, Japan). In order to demonstrate the stability of the standard and sample solutions during analysis, the solutions were analyzed at times 0, 24, 48 and 72 h.
3. RESULTS AND DISCUSSION
Cucurbitacins exhibit a wide array of in vitro and in vivo pharmacological effects, includ-ing anti-tumor activity. Target compounds (Cu D and I in present study) should be at high purity for studies such as cancer research. High purity isolat-ed cucurbitacin compounds are being investigatisolat-ed for their anti-cancer activities in recent studies. For this purpose, we established a simple and reliable method for simultaneous isolation and purification of cucurbitacins starting from the fruit juice.
cucur-bitacin B, D, E and I [36]. A high ratio of Cu D and I are obtained when the fruit juice is extracted di-rectly with chloroform. This is an effective and se-lective solvent, and it was used for cucurbitacins for the first time. The extraction efficiency with chloro-form was about 97 % for both cucurbitacins. In con-trast with methanol, the chloroform extract does not contain polar components; so there is no need for a further step to remove polar components. Since chloroform is highly volatile, the extraction was performed at room temperature. The FC separation yield was 91 % for Cu D and 90 % for Cu I.
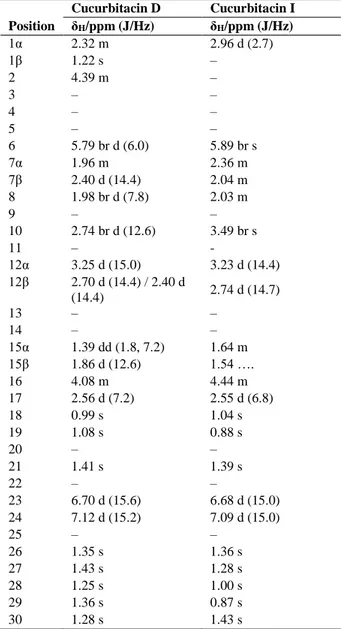
Fig. 2. HPLC chromatograms of (A) chloroform extract of E. elaterium fruit juice; (B) an FC fraction;
(C) standard Cu D; (D) standard Cu I
The HPLC chromatograms of the chloro-form extract of E. elaterium fruit juice, the FC fraction, and the authentic Cu D and Cu I standards are given in Figure 2. The HPLC peaks of the chlo-roform extract and the FC fraction were similar, and the peaks of Cu D and Cu I in these samples were in good agreement with those of the stand-ards. Cu D and Cu I were the major compounds in both the chloroform extract and the FC fractions. The peaks were sharp and symmetric. The intense peaks of Cu D and Cu I in the chloroform extract
indicated that Cu D and Cu I were present in high-er amounts than the othhigh-er components. The reten-tion times were 37.7 ± 0.03 min for Cu D standard and 44.7 ± 0.04 min for Cu I standard.
The optimal analytical HPLC conditions such as the composition of the mobile phase, elu-tion mode, flow rate, and column temperature were investigated by using a Nucleosil RP-C18 column (250 mm × 4.6 mm i.d., 5 μm).
Three mobile phase combinations tested for HPLC separation were (1) 100 % ACN (phase A) -100 % water (phase B), (2) 2 % acetic acid in water (phase A) – 100% ACN (phase B) and (3) 0.1 % TFA in water (phase A) – 100 % ACN (phase B). The retention times of the components decreased and the resolution of the peaks increased in the presence of acetic acid and TFA phases. Although, this situation seems to be an advantage, the remov-al of the components from acetic acid and TFA phases at the final step requires an extra separation process. Therefore, ACN and water mixtures of different ratios were used as the mobile phase. The gradient elution program gave better peak shapes and resolution than the isocratic elution program. The retention time of Cu D and Cu I decreased with increasing column temperature. Optimum separation and fractionation of Cu D and Cu I was obtained at a 0.75 ml/min flow rate. HPLC injec-tion volume was found to be an important factor affecting the separation efficiency. Good separa-tion resolusepara-tion was obtained with small injecsepara-tion volumes (50 µl). Large injection volumes (>50 µl) caused broadened peaks and poor separation of the target compounds.
Cu D and Cu I peak fractions of the auto-matically collected samples were identified by comparing their retention times and UV spectra of HPLC-DAD with those of the standards. The re-tention times of the isolated Cu D and Cu I were 37.6 ± 0.03 min and 44.7 ± 0.04 min, respectively. The retention times of the isolated compounds were very close to the standard’s retention times. The use of the DAD detector facilitated easy iden-tification and determination of the purity of the compounds. The UV spectra of the standards and isolated Cu D and Cu I are shown in Figure 3.
Fig. 3. Overlapping UV spectra of (A) standard and isolated Cu D; (B) standard and isolated Cu I
Fig. 4. Overlapping chromatograms of standard and isolated Cu D and Cu I (a: Standard Cu D; b: Isolated Cu D;
c: Standard Cu I; d: Isolated Cu I)
LC-ESI-MS analysis was performed in posi-tive ionization mode to obtain information on the composition of the standard Cu D and Cu I as well as isolated Cu D and Cu I. The LC/MSD SL chro-matograms are shown in Figure 5. The following interpretation of the major ion formation may be proposed: the characteristic protonated ion at m/z
499.4 [M+H-H2O]+ corresponds to C30H44O7 with molecular mass 516.7 for the isolated Cu D. The dif-ference in the m/z ratio was due to the facile loss of
a molecule of water from Cu D (Fig. 5(A)). This is also demonstrated with the mass chromatogram of the Cu D standard (Fig. 5(B)). The specific ion at
m/z 497.3 [M+H-H2O]+ corresponds to the loss of a molecule of water from C30H42O7 with molecular mass 514.7 for the isolated Cu I (Fig. 5(C)) [37– 39]. The same mass chromatogram is observed for the Cu I standard (Fig. 5(D)).
Melting points of the isolated cucurbtacins were determined in open capillary tubes with a Branstead Electrothermal 9100 capillary melting point instrument and were uncorrected. The melt-ing points of 151.2 ºC and 149.3 ºC were recorded for Cu D and Cu I, respectively. These results were quite close and within the range of the values spec-ified by the suppliers [37, 38].
T a b l e 2
1
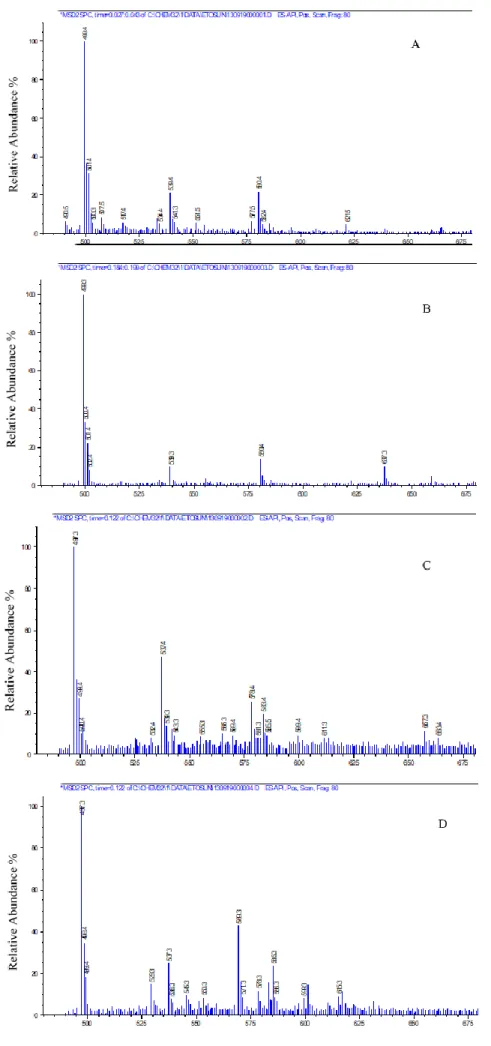
H-NMR (600 MHz, CHCl3) of cucurbitacins D and I
Cucurbitacin D Cucurbitacin I
Position δH/ppm (J/Hz) δH/ppm (J/Hz)
1α 2.32 m 2.96 d (2.7)
1β 1.22 s –
2 4.39 m –
3 – –
4 – –
5 – –
6 5.79 br d (6.0) 5.89 br s
7α 1.96 m 2.36 m
7β 2.40 d (14.4) 2.04 m
8 1.98 br d (7.8) 2.03 m
9 – –
10 2.74 br d (12.6) 3.49 br s
11 – -
12α 3.25 d (15.0) 3.23 d (14.4) 12β 2.70 d (14.4) / 2.40 d
(14.4) 2.74 d (14.7)
13 – –
14 – –
15α 1.39 dd (1.8, 7.2) 1.64 m
15β 1.86 d (12.6) 1.54 ….
16 4.08 m 4.44 m
17 2.56 d (7.2) 2.55 d (6.8)
18 0.99 s 1.04 s
19 1.08 s 0.88 s
20 – –
21 1.41 s 1.39 s
22 – –
23 6.70 d (15.6) 6.68 d (15.0)
24 7.12 d (15.2) 7.09 d (15.0)
25 – –
26 1.35 s 1.36 s
27 1.43 s 1.28 s
28 1.25 s 1.00 s
29 1.36 s 0.87 s
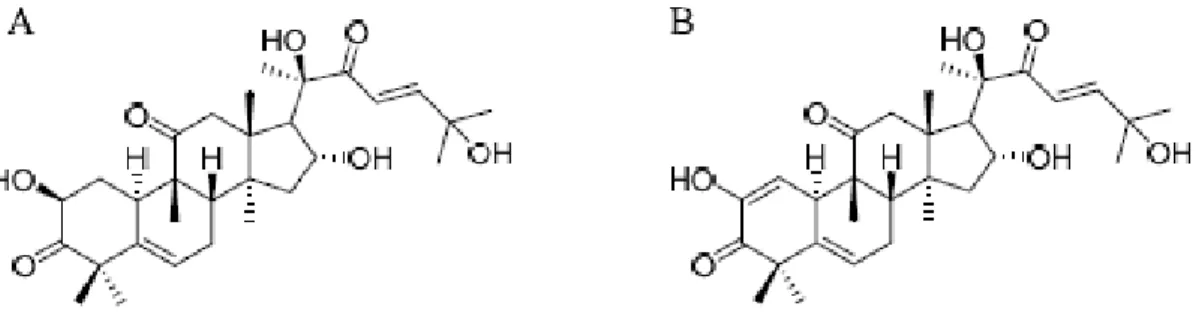
The 1H spectral data of the purified Cu D and Cu I are listed in Table 2. The 1H NMR spectral data of Cu D (IUPAC Name: (2S,8S,9R, 10R,13R,14S, 16R,17R)-17-[(E,2R )-2,6-dihydroxy-6-methyl-3-oxohept-4-en-2-yl]-2,16-dihydroxy-4, 4,9,13,14-pentamethyl-2,7,8,10,12,15,16,17-octahydro-1H -cyclopenta[a]phenanthrene-3,11-dione) (Fig. 6(A)) exhibited eight tertiary methyl group signals at δH 0.99 (3H, s, H-18); 1.25 (3H, s, H-28); 1.36 (3H, s, H-29); 1.28 (3H, s, H-30); 1.35 (3H, s, H-26); 1.43 (3H, s, 27); 1.41 (3H, s, 21); 1.08 (3H, s, H-19), an olefinic proton at δH 5.79 (1H, br d, J = 6.0 Hz, H-6), two trans-coupled olefinic protons on a side chain at δH 6.70 (1H, d, J = 15.6 Hz, H-23) and 7.12 (1H, d, J = 15.2 Hz, H-24), two hydroxyme-thine protons at δH 4.39 (1H, m, H-2) and 4.08 (1H, m, H-16), and a pair of doublets at δH 2.7,2.4 (1H, d, J = 14.4, 14.4 Hz, H-12β) and 3.25 (1H, d, J = 15.0 Hz, H-12α). The 1H NMR spectral data of Cu I
(IU-PAC Name: (8S,9R,10R,13R,14S,16R,17R )-17-[(E,2R )-2,6-dihydroxy-6-methyl-3-oxohept-4-en-2-yl]-2,16-dihydroxy-4,4,9,13,14-pentamethyl-8,10, 12,15,16, 17-hexahydro-7H -cyclopenta[a]phenan-threne-3, 11-dione) (Fig. 6(B)) exhibited eight ter-tiary methyl group signals at δH 1.04 (3H, s, H-18); 1.00 (3H, s, H-28); 0.87 (3H, s, H-29); 1.43 (3H, s, H-30); 1.36 (3H, s, H-26); 1.28 (3H, s, H-27); 1.39 (3H, s, H-21); 0.88 (3H, s, H-19), an olefinic pro-ton at δH 5.79 (1H, br s, H-6), two trans-coupled olefinic protons on a side chain at δH 6.68 (1H, d, J = 15.0 Hz, 23) and 7.09 (1H, d, J = 15.0 Hz, H-24), a hydroxymethine protons at δH 4.44 (1H, m, H-16), and a pair of doublets at δH 2.74 (1H, d, J = 14.7, 14.4 Hz, H-12β) and 3.23 (1H, d, J = 14.4 Hz, H-12α). Cu D and Cu I NMR signals were compared with the literature values and a good agreement was observed [40–45].
Fig. 6. The chemical structure of cucurbitacin D (A), cucurbitacin I (B
)
The HPLC method was used to quantitatively determine the amount of Cu D and Cu I isolated from the fruit juice. The lyophilized Cu D and Cu I crystals were dissolved in ethanol and the concen-tration of the compounds was calculated by individ-ual calibration curves. The mean concentration val-ues for three parallel determinations were 418 ± 0.1 µM for Cu D and 296 ± 0.1 µM for Cu I. These val-ues correspond to 86.4 µg/g dried residue for Cu D and 61 µg/g dried residue for Cu I, respectively.
Linear calibration plots for Cu D and Cu I at five different concentrations were triplicated for method validation. The linear equations for cali-bration plots were y = 99480x + 279497 (R2 = 0.9995) for Cu D and y = 87193x + 31473 (R2 = 0.9999) for Cu I. The LODs for Cu D and Cu I were 2.34 µg/ml and 1.79 µg/ml, respectively. The LOQs for Cu D and Cu I were 7.08 µg/ml and 5.98 µg/ml, respectively.
The recovery was 100.48, 97.35, and 100.45 for the known amount of 50, 100, and 150 % Cu D, respectively, and 99.90, 99.98 and 101.27 for the
known amount of 50, 100 and 150 % Cu I, respec-tively. The data showed that the added recoveries of the standards were accurate.
Intraday and inter-day RSDs were 0.25 % and 1.58 % for Cu D and 0.21 % and 1.65 % for Cu I, respectively. Intraday RSDs were smaller than the inter-day RSDs for all tested samples. The HPLC method was found to be precise for intraday and inter-day RSD values. The relatively low RSDs for cucurbitacins in both intraday and inter-day experiments also indicated that the method was repeatable and reproducible. There were no marked changes in the chromatograms obtained from two different HPLC machines; thus, the de-veloped HPLC method was rugged.
An analytical HPLC purification method is much better than the other chromatographic meth-ods to obtain high purity components. Subsequent-ly, a simple, rapid and reliable HPLC method was developed for the simultaneous purification and quantification of the two cucurbitacins. The de-scribed HPLC method resulted in a good separation. The analytical method was also fully validated.
Several advantages of the developed method can be mentioned. First, the sample preparation is easy and only non-polar components like
cucur-bitacins are extracted from fruit juice with chloro-form. Second, the fractions which contain cucur-bitacins are better separated using FC. Third, the HPLC conditions, in which aqueous acetonitrile is used as the mobile phase, are not complicated. This is also an advantage for removal of solvents from the final product without any impurities. Fourth, the high purity final product is suitable for medical research. Other benefits of the developed method include low cost analysis and good performance of analytical HPLC in contrast to expensive preparative HPLC.
T a b l e 3
Summary of HPLC method validation for Cu D and Cu I
Parameters Cu D Cu I
Linearity
Range (µg/ml) 10 - 500 4 - 100
Linear equation y = 99480x + 279497 y = 87193x + 31473
Slope 99480 87193
Intercept 279497 31473
Correlation coefficient (R2) 0.9995 0.9999
Precision (RSD, %)
Intraday 0.25 0.21
Inter day 1.58 1.65
LOD (µg/ml) 2.34 1.79
LOQ (µg/ml) 7.08 5.98
Stability (RSD, %)
0 h 0.44 0.98
24 h 0.43 1.19
48 h 0.40 0.53
72 h 0.48 1.07
Recovery (%) Level 1 (50%)
Original mean (µg) 32.47 ± 0.61 32.58 ± 0.89
Spiked mean (µg) 16.00 16.00
Detected mean (µg) 48.69 ± 0.81 48.53 ± 0.89
Recovery (%) 100.48 99.90
RSD (%) 1.67 1.87
Level 2 (100 %)
Original mean (µg) 32.47 ± 0.61 32.58 ± 0.89
Spiked mean (µg) 32.00 32.00
Detected mean (µg) 62.76 ± 0.53 64.56 ± 0.47
Recovery (%) 97.35 99.98
RSD (%) 0.85 0.72
Level 3 (150 %)
Original mean (µg) 32.47 ± 0.61 32.58 ± 0.89
Spiked mean (µg) 48.00 48.00
Detected mean (µg) 80.83 ± 0.93 81.60 ± 0.99
Recovery (%) 100.45 101.27
4. CONCLUSIONS
In the present study, a simple and effective procedure coupling FC and HPLC with a DAD detector has been developed for the separation, purification and quantification of Cu D and Cu I from a chloroform extract of E. elaterium fruit juice. The method was validated and quantified for Cu D and Cu I. The method showed good linearity, accuracy and precision within acceptable limits, and the LOD and LOQ values confirmed the effi-ciency of the method at low concentrations of cu-curbitacins. The purity of each isolated cucurbita-cin was the same as its standard. The method de-veloped here seems to be quite efficient for the separation and quantification of the components present in plant extracts.
Acknowledgement. The work was partially supported
by Inonu University Scientific and Research Projects Unit (Project No: 2012/37).
REFERENCES
[1] E. Yesilada, S. Tanaka, E. Sezik, Isolation of an anti-inflammatory principle from the fruit juice of Ecballium elaterium, J. Nat. Prod., 51(3), 504–508 (1988). https://pubs.acs.org/doi/abs/10.1021/np50057a008. [2] E. G. Attard, A. Scicluna-Spiteri, Ecballium elaterium: an
in vitro source of cucurbitacins, Fitoterapia, 72, 46–53 (2001). https://doi.org/10.1016/S0367-326X(00)00256-2. [3] A. Agıl, M. Miro, J. Jimenez, J. Anerios, M. D.
Cara-cuel, A. Garciagranados, M. C. Navarro, Isolation of an anti-hepatotoxic principle from the juice of Ecballium elaterium.Planta. Med., 65, 673–675 (1999).
https://www.thieme-connect.de/DOI/DOI?10.1055/s-2006-960847.
[4] H. G. Gerges, R. A. Khalil, E. A. Mansour, J. Magdalou, R. Chahine, N. Ouaini, Cucurbitacins from Ecballium elaterium juice increase the binding of bilirubin and ibu-profen to albumin in human plasma. Chem-Biol Inter-act.,169, 53–62 (2007).
https://doi.org/10.1016/j.cbi.2007.05.003.
[5] S. Bohlooli, N. Jafari, S. Jahed, Cytotoxic effect of freeze-dried extract of Ecballium elaterium fruit on gas-tric adenocarcinoma (AGS) and esophageal squamous cell carcinoma (KYSE30) cell lines. J Gastrointest Can-cer, 43, 579–583 (2012).
https://link.springer.com/article/10.1007%2Fs12029-012-9383-4.
[6] A. S. Salhab, Human exposure to Ecballium elaterium
fruit juice: fatal toxicity and possible remedy. Pharma-col Pharm, 4, 447–450 (2013).
http://file.scirp.org/Html/6-2500327_36044.htm [7] G. Toker, M. Memişoğlu, M. C. Toker, E. Yesilada,
Callus formation and cucurbitacin B accumulation in
Ecballium elaterium callus cultures. Fitoterapia, 74, 618–623 (2003).
https://doi.org/10.1016/S0367-326X(03)00165-5.
[8] I. Ielciu, M. Frederich, M. Tits, L. Angenot, R. Paltine-an, E. Cieckiewicz, G. CrişPaltine-an, L. Vlase, Bryonia alba L. and Ecballium elaterium (L) A Rich -Two related spe-cies of the cucurbitaceae family with important pharma-ceutical potential. Farmacia, 64(3), 323–332 (2016). https://www.researchgate.net/publication/304990164. [9] U. Kaushik, V. Aeri, S. R. Mir, Cucurbitacins - An
in-sight into medicinal leads from nature. Pharmacogn. Rev., 9(17), 12–18 (2015).
https://www.ncbi.nlm.nih.gov/pmc/articles/PMC4441156/. [10] J. Gry, I. Søborg, H. C. Andersson, Cucurbitacins in
Plant Food Tema Nord Nordic Council of Ministers; Ek-spressen Tryk & Kopicenter; Copenhagen, 2006. https://www.diva-portal.org/smash/get/diva2:701868/ FULLTEXT01.pdf.
[11] M. Miro, Cucurbitacins and their pharmacological ef-fects Phytother., 9, 159–168 (1995).
https://doi.org/10.1002/ptr.2650090302.
[12] A. A. Alghasham, Cucurbitacins-a promising target for cancer therapy. Int. J. Health Sci., 7(1), 77–89 (2013). https://www.ncbi.nlm.nih.gov/pmc/articles/PMC3612419/. [13] S. O. Chung, Y. J. Kim, S. U. Park, An updated review of
cucurbitacins and their biological and pharmacological ac-tivities (Letter to the editor). EXCLI J, 14, 562–566 (2015). http://www.excli.de/vol14/Park_05052015_proof.pdf. [14] I. T. Silva, F. C. Geller, L. Persich, S. E. Dudek, K. L.
Lang, M. S. B. Caro, F. J. Duran, E. P. Schenkel, S. Ludwig, C. M. O. Simoes, Cytotoxic effects of natural and semisynthetic cucurbitacins on lung cancer cell line A549. Invest New Drug, 34(2), 139–148 (2016). https://link.springer.com/article/10.1007%2Fs10637-015-0317-4.
[15] D. H. Lee, G. B. Iwanski, N. H. Thoennissen, Cucurbitacin: ancient compound shedding new light on cancer treatment.
Scientific World Journal,10, 413–418 (2010).
https://www.hindawi.com/journals/tswj/2010/565972/abs/. [16] L. H. Mary, Lakshmi, F. Tilton, J. Joseph, S. S. Solosan,
D. Sudarsanam, Phytochemical antioxidant and cytotox-ic properties of the fruit extract from Cucurbita digitate.
Int J. Pharm. Pharm. Sci., 6(4), 353–356 (2014). https://innovareacademics.in/journal/ijpps/Vol6Issue4/9 124.pdf.
[17] K. Dhiman, A. Gupta, D. K. Sharma, N. S. Gill, A. Goy-al, A review on the medicinally important plants of the family cucurbitaceae. Asian Journal of Clinical Nutri-tion, 4(1), 16–26 (2012).
https://scialert.net/abstract/?doi=ajcn.2012.16.26. [18] N. S. Gill, M. Bali, Isolation of anti ulcer cucurbitane
type triterpenoid from the seeds of Cucurbita pepo. Res J Phytochemistry,5(2), 70–79, (2011).
https://scialert.net/abstract/?doi=rjphyto.2011.70.79. [19] L. Dinan, J. Harmatha, R. Lafont, Chromatographic
procedure for the isolation of plant steroids. J. Chroma-togr. A935, 105–123 (2001).
https://doi.org/10.1016/S0021-9673(01)00992-X. [20] J. Bartalis, F. T. Halaweish, Relationship between
[21] W. A. Oleszek, Chromatographic determination of plant saponins. J. Chromatogr A,967, 147–162 (2002). https://doi.org/10.1016/S0021-9673(01)01556-4. [22] C. A. Rice, K. A Raymal, O. L. Chambliss, F. A.
John-son, Chromatographic and mass spectral analysis of Cu-curbitacins of three Cucumis sativus cultivars, J. Agr Food Chem.,29, 194–196 (1981).
https://pubs.acs.org/doi/abs/10.1021/jf00103a051. [23] N. Hassan, J. Ahamad, S. Amin, M. Mujeeb, S. R. Mir,
Rapid preparative isolation of erythrocentaurin from
Enicostemma littorale by medium-pressure liquid chro-matography its estimation by high-pressure thin-layer chromatography and its α-amylase inhibitory activity, J. Sep. Sci., 38, 592–598 (2015).
https://doi.org/10.1002/jssc.201401030.
[24] J. Tao, R. Yan, L. Zhao, D. Wang, X. Xu, Separation and purification of two taxanes and one xylosyl-containing taxane from Taxus wallichiana Zucc: A comparison between high-speed countercurrent chroma-tography and reversed-phase FC. J. Sep. Sci., 40(6), 1273–1282 (2017).
https://doi.org/10.1002/jssc.201601066.
[25] S. Sturm, H. Stuppner, Analysis of cucurbitacins in medici-nal plants by high pressure liquid chromatography-mass spectrometry, Phytochem Analysis,11(2), 121–127 (2000).
https://doi.org/10.1002/(SICI)1099-1565(200003/04)11:2<121:AID-PCA493>3.0.CO;2-9. [26] G .I. Kaya and M. F. Melzig, Quantitative determination
of cucurbitacin E and cucurbitacin I in homoeopathic mother tincture of Gratiola officinalis L by HPLC.
Pharmazie, 63, 851–853 (2008). https://doi.org/10.1691/ph.2008.8197.
[27] F. T. Halaweish, D. W. Tallamy, Quantitative determina-tion of cucurbitacins by high performance liquid chroma-tography and high performance thin layer chromachroma-tography,
J. Liq. Chromatogr.16, 497–511 (1993). https://doi.org/10.1080/10826079308020927.
[28] X. S. Feng, D. C. Wang, H. Cai, X. M. Deng, Y. R. Liu, Determination of the cucurbitacins from Cucubita pepo cv dayangua by HPLC, Zhong Yao Cai30(4), 418–420 (2007). https://www.researchgate.net/publication/6164198_Dete rmination_of_the_cucurbitacins_from_Cucubita_pepo_ cv_dayangua_by_HPLC.
[29] S. Sasidharan, Y. Chen, D. Saravanan, K. M. Sundram, L. Y. Latha, Extraction isolation and characterization of bioactive compounds from plants' extracts. Afr. J. Tradit. Complem., 8(1), 1–10 (2011).
https://www.ncbi.nlm.nih.gov/pmc/articles/PMC3218439/. [30] P. B. Krepsky, M. O. Cervelin, D. Porath, R. R. Peters,
R. Ribeiro-do-Valle, M. R. Farias, High performance liquid chromatography determination of cucurbitacins in the roots of Wilbrandia ebracteata Cogn. Braz. J. Pharmacog,19(3), 715–719 (2009).
http://dx.doi.org/10.1590/S0102-695X2009000500011. [31] E. Sezik, Research on the Turkish medicinal plant,
Chem. Nat. Compound,33(5), 541–542 (1995). https://link.springer.com/article/10.1007/BF02254799. [32] E. Attard, Rapid detection of Cucurbitacins in tissues
and in vitro cultures of Ecballium elaterium (L.) A. Rich Cucurbit Genet. Coop Report, 25, 71–75 (2002). http://cuke.hort.ncsu.edu/cgc/cgc25/cgc25-25.pdf.
[33] C. C. Wang, L. G. Chen, T. L. Chang, C.T. Hsieh, Ex-tracts of aquilaria hulls and use thereof in the treatment of cancer, US Patent 20110160152 A1, June 30, 2011. https://patents.google.com/patent/US20110160152A1/en. [34] M. M. Saker, M. M. Farid, A. A. Fahmi, S. A.
El-Mekkawy, H. S. Taha, A. I. Amin, Large scale production of antitumor cucurbitacins from Ecballium elaterium using bioreactor, Afr. J. Biotechnol., 11(66), 12974–12982 (2012). http://dx.doi.org/10.5897/AJB12.878.
[35] ICH Q2 (R1). Proceedings of International Conference of Harmonization. Geneva, 2005.
http://www.ema.europa.eu/docs/en_GB/document_librar y/Scientific_guideline/2009/09/WC500002662.pdf. [36] S. Hu, Y. Wang, B. Avula, M. Wang, I. A. Khan,
Separa-tion of cucurbitane triterpenoids from bitter melon drinks and determination of partition coefficients using vortex-assisted dispersive liquid-phase microextraction followed by UHPLC analysis, J. Sep. Sci,40, 2238–2245 (2017). https://doi.org/10.1002/jssc.201700023.
[37] Cucurbitacin D.
https://pubchem.ncbi.nlm.nih.gov/compound/Cucurbitac in-D, accessed September 2019.
[38] Cucurbitacin I.
https://pubchem.ncbi.nlm.nih.gov/compound/Cucurbitac in-I, accessed September 2019.
[39] V. Subbiah, Method of isolating cucurbitacin. US Patent 5925356, July 20, 1999.
https://patents.google.com/patent/US5925356A/en. [40] C. Che, X. Fang, C. H. Phobe, A. D. Kinghorn, N. R.
Farnsworth, High-field 1H-NMR analysis of some
cu-curbitacins, J. Nat. Prod., 48(3), 429–434 (1985). https://pubs.acs.org/doi/abs/10.1021/np50039a010. [41] C. Seger, S. Sturm, M. E. Mair, E. P. Ellmerer, H.
Stuppner, 1H and 13C NMR signal assignment of
cucur-bitacin derivates from Citrillus colocynthis (L) Schrader and Ecballium elaterium L (Cucurbitaceae). Magn. Re-son. Chem., 43, 489–491 (2005).
https://doi.org/10.1002/mrc.1570.
[42] C. Seger, S. Sturm, E. Haslinger, H. Stuppner, NMR signal assignment of 22-deoxocucurbitacin D and cucurbitacin D from Ecballium elaterium L (Cucurbitaceae). Monatshefte für Chemie,136, 1645–1649 (2005).
https://link.springer.com/article/10.1007/s00706-005-0347-2.
[43] M. Wen-Li, L. Feng, Z. Wen-Jian, W. Hui, D. Hao-Fu, Cucurbitacins from fruits of Aquilaria sinensis. Chin. J. Nat. Med.,10(3), 234–237 (2012).
https://doi.org/10.3724/SP.J.1009.2012.00234.
[44] A. Alsayari, L. Kopel, M. S. Ahmed, H. S. M. Soliman, S. Annadurai, F.T. Halaweish, Isolation of anticancer constituents from Cucumis propheratum var. propheratum through bioassay-guided fractionation.
BMC Complem. Altern M,18, 1–12 (2018). https://doi.org/10.1186/s12906-018-2295-5.
[45] R. Chawech, R. Jarraya, C. Girardi, M. Vansteelandt, G. Marti, I. Nasri, C. Racaud-Sultan, N. Fabre, Cucurbitacins from the leaves of Citrullus colocynthis