Volume 6 Number 2 August 2020 page 126-136 p-ISSN:2460-1497 and e-ISSN: 2477-3840 DOI: https://doi.org/10.26858/est.v6i2.12057
126
Comparison of Students’ Attitudes in Science Subjects in Urban
and Rural Areas
Astalini1, Dwi Agus Kurniawan2, Darmaji3, Lika Anggraini4 1Physics Education , Universitas Jambi, Indonesia
Email: astalinizakir@unja.ac.id
2Physics Education , Universitas Jambi, Indonesia
Email: dwiagus.k@unja.ac.id
3Physics Education , Universitas Jambi, Indonesia
Email: darmaji@unja.ac.id
4Physics Education , Universitas Jambi, Indonesia
Email: likaanggraini@gmail.com
This is an open access article distributed under the Creative Commons Attribution License CC-BY-NC-4.0 ©2020 by author (https://creativecommons.org/licenses/by-nc/4.0/ ).
Abstract. This study aims to determine differences in attitudes held by students who are in rural and urban areas. Because attitude is the most important thing in 21st century education. The methodology in this study uses quantitative research with a survey design that uses a total sample of 2815 students based on total sampling collection techniques. In this study, using the ANOVA test with Poshoc further tests to determine differences in attitudes held by students. The results of this study found differences in attitudes held by students in rural areas and students in urban areas, that there were significant differences held by students in science subjects. Therefore, by knowing the differences that are owned by urban and rural students can be used as a benchmark by the government to develop education that can also focus on students' affective, not just cognitive so that teachers can also apply appropriate learning methods aimed at making students able to have a good attitude that will help themselves both in school and in the community.
Keywords: Attitudes; Education; Urban; Rural
INTRODUCTION
Education is a process of improving the quality of life, as well as acquiring and instilling the skills undertaken by learners (Wood, 2011). In the first, middle school, there are several lessons derived from the integration of the disciplines of natural and social sciences. One of them is the science course, which is an integration of the Knowledge branch in it. According to (Doyan, Taufik, & Anjani, 2018) stated that "Science or science is a collection of scholars who seek to explain every phenomenon occurring in nature". Generally, science lessons in junior high School are taught by a science
teacher, who organizes learning activities and measure student attitudes. Through student participation, science teachers are ready to improve the teaching of science and to learn in the classroom, and as Science Teachers, Leaders (STLs) facilitates professional learning in secondary schools or through student participation, science teachers Ready to improve the teaching of science and learning processes in the classroom and as the leader of Science Teachers (STLs) facilitates professional learning in the junior high school (Pringle, Mesa, & Hayes, 2017).
The evaluation of the teaching and learning process in the classroom for each
(Received: January-2020; Reviewed: February-2020; Accepted: April-2020;
student can be measured by the attitude of students to science. This attitude is very important because the teacher can know each student responds to science learning with an indication that students reject or accept science learning in students. The word' attitude' is often used in students' academic lives (Ali, Iqbal, & Saeed Akhtar, 2013). Attitudes constitute an ability to judge something that is reflected in the attitude of accepting, rejecting, or neglecting (Dimyati & Mudjiono, 2006). The student's attitude towards the science-defecting of heterogeneous groups is not influenced by different cultures and backgrounds (Narmadha & Chamundeswari, 2013). According to Liaghatdar, Soltani, and Abedi (2011) "Attitudes toward science is important because Attitudes can enhance the educational achievements of students and affect their performance" or can be defined attitudes towards science are seen to be important because Attitudes can improve student education achievements and influence their performance.
According to Pamungkas, Subali, & Lunuwih (2017) "Education of natural Sciences is an effort or process to teach students to understand the nature of science". Science has been introduced from basic education, science is a process of learning and continuing (Narmadha & Chamundeswari, 2013). Science education researchers have initiated the argument that students are still experiencing difficulties in learning the concept of science (TOPCU & Sahin-Pekmez, 2009). This is the attitude of students to the science subjects seen from how their responses about the science lesson, in general, the attitude of students on the science is positive and also negative. Students' positive attitude toward the lesson is characterized by more diligent learning so that the results are satisfactory (Rijal & Bachtiar, 2015). The students ' attitudes in learning are called negative attitudes. According to Nursa'adah (2014) The cause of students ' negative views and attitudes toward the science lesson due to traditional methods of teaching science used continuously, such as learning takes place passively, students are reluctant to think, and accept As soon as the material is delivered. Therefore, from the explanation, one of the objectives of science learning is to foster a positive attitude towards students of science (Sofiani, Maulida, Fadhilah, & Sihite, 2017). Students' attitudes toward the science of the significant change in their achievement in
science (Jebson & Hena, 2016). Students' attitudes towards science as measured in this study can be seen through three indicators adopted from Astalini & Kurniawan (2019), namely the adaptation of scientific attitudes, learning science, and interest in spending a career in the field of science.
Scientific attitudes in science have been taught early on through the discovery of existing concepts. Alexander, Johnson, & Kelley (2012) “Parents frequently link scientific concepts to familiar examples (although sometimes inaccurately) and discussing complex scientific ideas”. Science is not a lesson that can only be explained by theory because it is likely that there will be many differences of opinion according to individual observations so that it requires direct practice. Lee (2018) “that Perceptions or misperceptions about science mediate the link between knowledge and attitudes (scientific knowledge → perceptions about science → attitudes toward science)”. Bybee, McCrae, & Laurie (2009), “Toward A science play an important role in scientific literacy”. A scientific attitude is one of the indicators of the positive attitude of students to science. Attitudes toward science and scientific attitude are two inseparable elements. The synergy of developing this scientific attitude can make every student have the ability to understand the scientific knowledge of science in life. Erdogan (2017) “So it is critical to determine the scientific attitude and science of teaching attitude levels of gifted student teachers in order to guide the attitudes of gifted students' in science”. Lacap (2015) scientific attitude plays a major role in the science education and in the lives of students pursuing science education.
enjoyment during the scientific learning process can be seen from students responding to the learning, in general the indicator of fun in science learning is expressed with pleasure or dislikes or dislike. The happy attitude or the likes of each student will conclude the student's enjoyment of science, while the attitude of dislikes or dislike will conclude students have a sense of displeased with science. Students' happy attitude toward science can be demonstrated how students are open and passionate about science subjects inside or outside the classroom.
The skill to make a career decision is crucial for every student because students are required to have matured in his or her career choices (Zamroni, 2016). A career interest in science can be defined that every student in the future has an interest in career or continuing his education in the field of science. A career interest in science includes an important task for every parent to support. Positive perception and parental values on science subjects encouraged parents to develop children's interest in careers in science (Halim et al, 2017). Encouraging the interest of students in careers or continuing the study of current science is very important. Natural science is very important for daily human needs, for problem solving, and the application of the science is done wisely to maintain and preserve the environment (Rohmawati, 2012).
Research objectives, to know the difference in the attitude of junior high school students in the urban and rural of the subjects based on the adoption indicators of scientific attitudes, pleasure in learning science and the interest of careers in the science field.
METHOD
This research uses survey research. Survey research examines the large population (or universe) by selecting and reviewing the selected sample of the population (Kerlinger, 2014). From this sample as well, researchers are able to generalize and make a decision on the population (Creswell, 2017). The research subject is all students of SMPN 1 Batanghari, SMPN 2 Batanghari, SMPN 3 Batanghari, SMPN 1 Jambi City, SMPN 2 Jambi City, SMPN 3 Jambi City uses the total sampling technique. Where the total number of students studied in SMP is 2815 students. The Instrument used is a questionnaire, Attitude questionnaire in
this study was adopted from Astalini & Kurniawan (2019) with a number of valid statements totaling 25 statements with a Cronbach alpha reliability value of 0.9. The dimensions of students' attitudes towards the science study are researched based on the indicators defined, namely the adoption of scientific attitudes, pleasure in learning, and the career interest in science/science. Students' attitudes to the science in this study used Likert scales. Likert scales with a very concur type of scale (SA), agree (A), are not sure (NS), Disagree (D), and strongly disagree (SD). Each positive item on the instrument has values: SA = 5, A = 4, NS = 3, D = 2, and SD = 1. The score is reversed for negative items. This research data is quantitative data and in the analysis using the Anova Test. The results of the poll data are processed using SPSS. This process aims to see the difference in the attitude of junior high school students in the district and in the city to the subjects based on the adoption indicators of scientific attitudes, the pleasure in learning science and the interest of careers in the science field.
RESULTS AND DISCUSSION
Results
Data retrieval is done by using an attitude questionnaire on students the goal is to see student responses to certain objects. The novelty of this research is that the study was conducted in two different regions with rural and urban backgrounds. So it is very interesting to know the difference in the attitude of students between those who live in rural areas and those who live in urban areas. Research on student attitudes toward science subjects is based on three indicators, namely the adoption of scientific attitude indicators, enjoyment in learning science, and career interests in science. Later, by knowing students' attitudes, the teacher is able to apply appropriate learning methods for their students.
Table 1 The Result of the adoption indicators of scientific attitudes
ANOVA
Sum of Squares df Mean Square F Sig. Between Groups 358.847 2 179.423 14.237 .000 Within Groups 18009.426 1429 12.603
Total 18368.273 1431
Anova test was used to see differences in student attitudes at three different schools in the city of Jambi. The results of data analysis in table 1 of the indicators of adoption of scientific attitudes, obtained a significance value of 0.00 or smaller than 0.05 with a significant level of 0.05. So the data is concluded that there is a significant average difference between junior high school 1 Jambi city, junior high school 2 Jambi City, and junior high school 3 Jambi City
if measured based on indicators of adoption of scientific attitudes.
Associated with the average difference between the three schools in the city of Jambi for indicators of adoption of scientific attitudes, then to see a large significant difference in the average attitude of students towards science subjects carried out a posthoc test. Based on the results of the analysis that has been done, the results
obtained as the table2.
Table 2 Post hoc uses Tukey on indicators of adoption of scientific attitudes
The adoption indicators of scientific attitudes Tukey HSDa,b
SEKOLAH N Subset for alpha = 0.05
1 2 3
SMPN 2 Kota Jambi 479 24.4676
SMPN 3 Kota Jambi 451 25.1109
SMPN 1 Kota Jambi 502 25.6773
Sig. 1.000 1.000 1.000
Based on Table 2, it can be concluded that there are significant differences between the three schools in Jambi City with the smallest group average in junior high school 2 in Jambi City, which is 24.4676, followed by junior high school 3 Jambi with a group average of 25.1109
and the largest average of junior high school 1 in the city of Jambi is 25.6773. Anova test was then performed on the pleasure in learning science indicator. The results of the analysis can be seen from the results table 3.
Table 3. The Result of Indicators pleasure in learning science
ANOVA
Sum of Squares df Mean Square F Sig.
Between Groups 592.075 2 296.038 13.679 .000 Within Groups 30925.147 1429 21.641
Total 31517.223 1431
The results of the data analysis in table 3 of the indicators of pleasure in learning science, obtained a significance value of 0.00 or smaller than 0.05 with a significant level of 0.05. So the data is concluded that there is a significant
difference between the three schools in the city of Jambi for the indicator of pleasure in learning science, then to see a large significant difference in the average attitude of students towards
science subjects carried out further tests (tukey). Based on the results of the analysis that has been done, the results obtained as the table 4.
Table 4. The Result of Indicators pleasure in learning science
Pleasure in learning science Tukey HSDa,b
Sekolah N Subset for alpha = 0.05
1 2
SMPN 2 Kota Jambi 479 26.7349
SMPN 1 Kota Jambi 502 28.0876
SMPN 3 Kota Jambi 451 28.1086
Sig. 1.000 .997
Based on Table 4, it can be concluded that there is a significant group average difference between junior high school 2 and Jambi city junior high school 1. Furthermore there is also a significant difference in group mean between junior high school 2 in Jambi city and junior high school 3 in Jambi city. The smallest group average in junior high school 2 Jambi City is
26.7349, followed by junior high school 1 Jambi city with an average group of 28.0876 and the largest average junior high school 3 Jambi city is 28.1086. Anova test is then performed on the indicators of interest of careers in the science field. The results of the analysis can be seen from the results table 5:
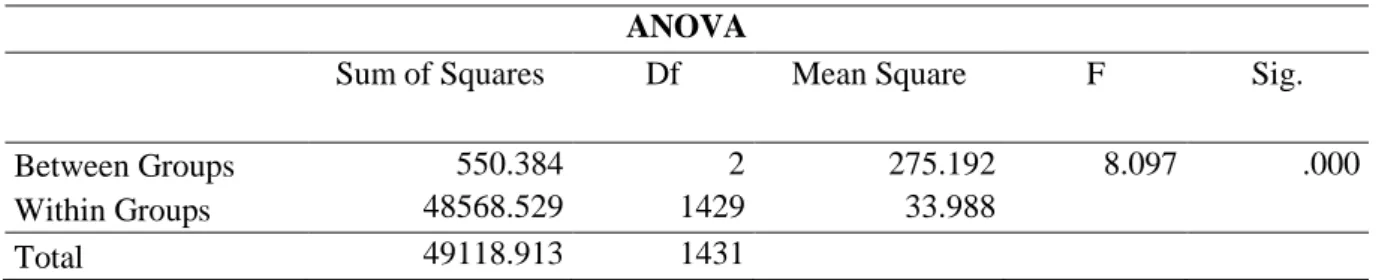
Tabel 5. The result of indicator the interest of careers in the science field
ANOVA
Sum of Squares Df Mean Square F Sig.
Between Groups 550.384 2 275.192 8.097 .000 Within Groups 48568.529 1429 33.988
Total 49118.913 1431
The results of data analysis in table 5 of the indicators of interest of careers in the science field, obtained a significance value of 0.00 or smaller than 0.05 with a significant level of 0.05. So the data is concluded that there is a significant average difference between junior high school 1 Jambi city, junior high school 2 Jambi city, and junior high school 3 Jambi city if measured based on indicators of the interest of careers in the science field.
Based on the results obtained that there are differences in the average between the three schools in the city of Jambi for indicators of the interest of careers in the science field, then to see a large significant difference in average student attitudes towards science subjects carried out further tests (post hoc) tukey. Based on the results of the analysis that has been done, the results obtained as the table 6:
Based on Table 6, it can be concluded that there is a significant group average difference between junior high school 2 and Jambi city junior high school 1. Furthermore there is also a significant difference in group mean between junior high school 2 in Jambi city and junior high school 3 in Jambi city. The smallest group average in junior high school 2 Jambi City is 34.0418, followed by junior high school 1 Jambi City with an average group of 35.2789 and the largest average junior high school 3 Jambi city is 35.4279.
Batanghari
towards science regarding indicators of adoption of scientific attitudes, it can be seen from the
results table 7.
Tabel 6 Post hoc uses Tukey on the interest of careers indicator in the science field
The interest of careers in the science field Tukey HSDa,b
Sekolah N Subset for alpha = 0.05
1 2
SMPN 2 Kota Jambi 479 34.0418
SMPN 1 Kota Jambi 502 35.2789
SMPN 3 Kota Jambi 451 35.4279
Sig. 1.000 .918
Tabel 7 The Result of the adoption indicators of scientific attitudes
ANOVA
Sum of Squares df Mean Square F Sig. Between Groups 134.444 2 67.222 6.047 .002
Within Groups 12584.918 1132 11.117 Total 12719.362 1134
Anova test was used to see differences in student attitudes at three different schools in the Batanghari area. The results of data analysis in table 7 of the indicators of adoption of scientific attitudes, obtained a significance value of 0.002 or smaller than 0.05 with a significant level of 0.05. So the data is concluded that there is a significant average difference between SMP 1 Batanghari, SMP 2 Batanghari, and SMP 3 Batanghari if measured based on indicators of adoption of scientific attitudes.
After knowing that there are differences in the average between the three schools in Batanghari for the indicators of adoption of scientific attitudes, then to see a large significant difference in the average attitude of students towards science subjects, a post hoc test was conducted. Based on the results of the analysis that has been done, the results obtained as the table 8.
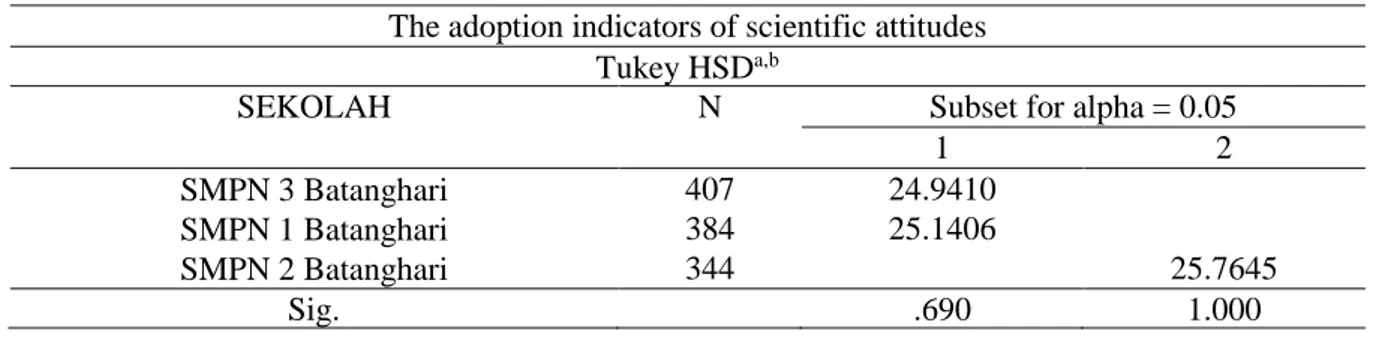
Tabel 8. Post hoc uses Tukey on the adoption indicators of scientific attitudes
The adoption indicators of scientific attitudes Tukey HSDa,b
SEKOLAH N Subset for alpha = 0.05
1 2
SMPN 3 Batanghari 407 24.9410 SMPN 1 Batanghari 384 25.1406
SMPN 2 Batanghari 344 25.7645
Sig. .690 1.000
Based on Table 8, it can be concluded that there are significant differences between SMP 3 Batanghari and SMP 2 Batanghari, furthermore there is also a significant difference between SMP 1 Batanghari and SMP 2 Batanghari. The smallest group average at SMP 3 Batanghari is 24.9410, followed by SMP 1 Batanghari with an
Tabel 9 The Result of Indicator pleasure in learning science
ANOVA
Sum of Squares Df Mean Square F Sig. Between Groups 237.120 2 118.560 6.446 .002
Within Groups 20821.343 1132 18.393 Total 21058.463 1134
The results of data analysis in table 9 of the indicators of pleasure in learning science, obtained a significance value of 0.002 or smaller than 0.05 with a significant level of 0.05. So the data is concluded that there is a significant average difference between SMP 1 Batanghari, SMP 2 Batanghari, and SMP 3 Batanghari if measured based on indicators of pleasure in learning science.
In accordance with the results obtained that there are differences in the average between the three schools in the Batanghari area for indicators of pleasure in learning science, then to see a large significant difference in the average attitudes of students towards science subjects, a post hoc test was conducted. Based on the results of the analysis that has been done, the results obtained as the table10.
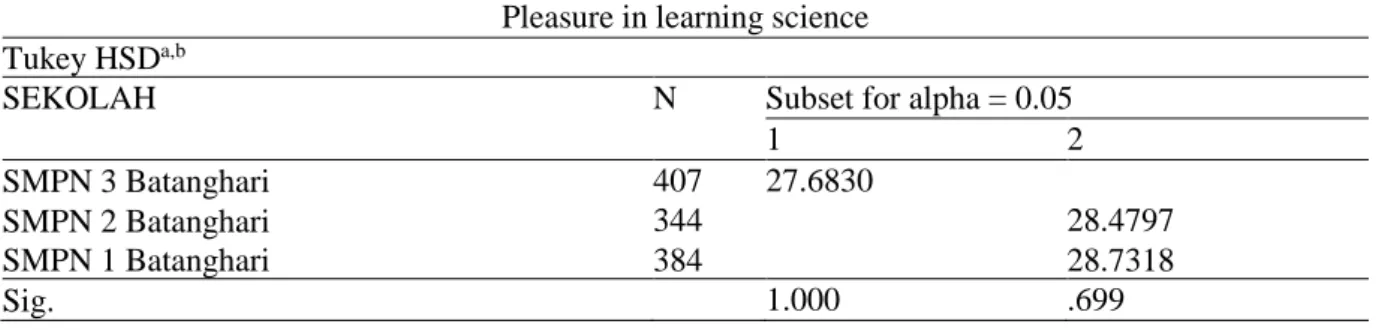
Table 10 Post hoc uses Tukey on the indicator pleasure in learning science
Pleasure in learning science Tukey HSDa,b
SEKOLAH N Subset for alpha = 0.05
1 2
SMPN 3 Batanghari 407 27.6830
SMPN 2 Batanghari 344 28.4797
SMPN 1 Batanghari 384 28.7318
Sig. 1.000 .699
Based on Table 10, it can be concluded that there are significant differences between SMP 3 Batanghari and SMP 2 Batanghari, furthermore there is also a significant difference between SMP 3 Batanghari and SMP 1 Batanghari. The smallest group average at SMP 3 Batanghari is 27.6830, followed by SMP 2
Batanghari with an average group of 28.2797 and the largest average at SMP 1 Batanghari is 28.7318. Anova test is then performed on the indicators of interest of careers in the science field. The results of the analysis can be seen from the results table 11.
Table 11 The Result of Indicator the interest of careers in the science field
ANOVA
Sum of Squares Df Mean Square F Sig. Between Groups 314.281 2 157.141 5.125 .006 Within Groups 34706.023 1132 30.659
Total 35020.305 1134 The results of data analysis in table 11 of the indicators of interest of careers in the science field, obtained a significance value of 0.006 or smaller than 0.05 with a significant level of 0.05. So the data is concluded that there is a significant average difference between SMP 1 Batanghari, SMP 2 Batanghari, and SMP 3 Batanghari if measured based on the indicators of interest of careers in the science field.
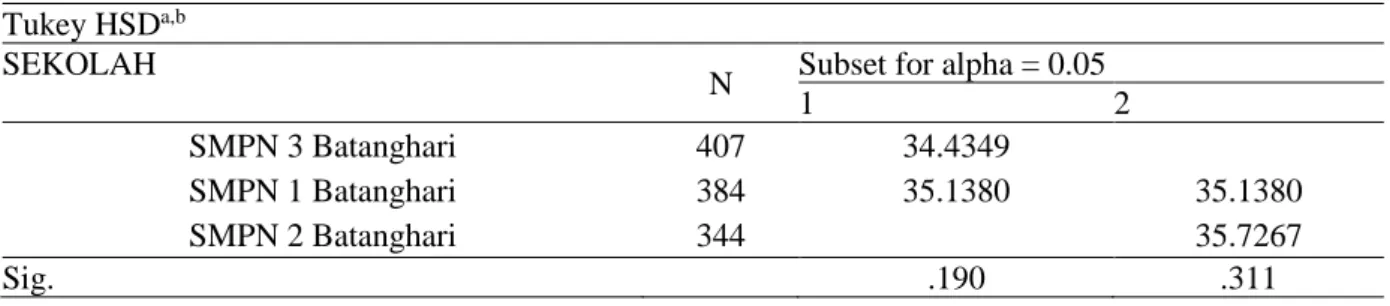
Table 12 Post hoc uses Tukey on the interest of careers indicator in the science field
The interest of careers in the science field Tukey HSDa,b
SEKOLAH
N Subset for alpha = 0.05
1 2
SMPN 3 Batanghari 407 34.4349
SMPN 1 Batanghari 384 35.1380 35.1380
SMPN 2 Batanghari 344 35.7267
Sig. .190 .311
Based on Table 10, it can be concluded that the significant difference is only between SMP 3 Batanghari and SMP 2 Batanghari, with an average group of SMP 3 Batanghari that is 34.4349 and the average SMP 2 Batanghari 35.7267.
Discussion
Basically the measurements that occur at school are more focused on the cognitive aspect although affective measurement still occurs, but measuring in terms of attitude is quite difficult to do, because it is too complicated for a teacher to take measurements based only on observations without instruments. But affective measurement in this case in the form of attitude is very important to do. The essence of measuring attitudes in school is useful for knowing students' feelings during the science learning process, both in the form of positive attitudes and negative attitudes, and hopes students have a positive attitude to science (Astalini, Kurniawan & Anggraini, 2019). Both positive and negative attitudes can arise during the learning process (Astalini, Kurniawan & Nurfarida, 2018). In this study there are three dimensions that serve as benchmarks to see differences in attitudes of junior high school students in districts and cities towards subjects based on indicators of adoption of scientific attitudes, enjoyment in learning science and career interest in the natural sciences.
Adoption of scientific attitude
Based on the results of the analysis in Table 2 and Table 8, the average group attitudes of students towards science subjects based on the adoption of scientific attitudes showed that there were significant differences, especially in Jambi City, because the three schools that were sampled showed very different rates between schools. Whereas in Batanghari area, the significant average difference only occurs in
SMP 3 Batang and SMP 2 Batang Hari and SMP 1 Batang Hari and SMP 2 Batang Hari. For SMP 3 Batanghari and SMP 1 Batanghari the average difference is not very significant. But if seen as a whole, the average student living in an area is higher compared to the average student living in an urban area with the highest average value in urban areas of 25,6773 while the highest average student in a rural area is slightly higher with a value of 25.7645.
In general, the scientific attitude is based on high curiosity. Differences in average student attitudes based on indicators of adoption from scientific attitudes indicate that the attitudes of students who live in rural areas are actually higher when compared to students who live in urban areas. The limitations of rural facilities make students try to find out more deeply. Trying to experiment exploring new knowledge. Finding out new things through experiments, digging for more information, and making data analysis of the experiments they conducted (Astalini et al, 2019; Astalini et al, 2019). It is important for a school teacher to foster students' curiosity as a form of applying one of the scientific attitudes. By implementing scientific attitudes in learning will make a student have a positive learning (Prime, Subiyantoro, & Anggraini, 2019).
Pleasure in learning science
Batanghari Region is only between SMP 3 Batanghari and SMP 2 Batanghari. When viewed as a whole, the average student living in an area is higher compared to the average student living in an urban area with the highest average value in urban areas of 28.1086 while the highest average student in a rural area is slightly more high with a value of 28.7318.
Environmental differences have become an important factor in students' pleasure in learning science, because science is learning that comes from nature. If students love nature and the environment they live in, then these students can be categorized as happy studying science. In accordance with Anggraini and Perdana's research (2019) which revealed that students enjoy studying science because studying science is the same as studying the place where we live and learning to love and care for nature. This also becomes a factor in the difference in the attitudes of students who live in urban and rural areas.
The interest of careers in the science
Based on the analysis of the data in tables 6 and 12, the average group of students' attitudes toward science subjects based on the interest of careers in the science indicators results are significant differences for Batanghari and Jambi City. The average difference for Jambi City is between Junior High School 2 Jambi City and Junior High School 1 Jambi City and Junior High School 2 Jambi City and Junior High School 3 Jambi City. While between junior high school 1 and junior high school 3 the average difference was not very significant. Furthermore, the average difference for Batanghari Region is between SMP 3 Batang Hari and SMP 2 Batang Hari and SMP 2 Batang Hari and SMP 1 Batang Hari. While between SMP 1 Batanghari and SMP 2 Batanghari the average difference was not very significant. If seen as a whole, the average student living in an area is higher compared to the average student living in an urban area with the highest average value in urban areas of 35.4279 while the highest average student in a rural area is slightly more high with a value of 35.7267.
Discussing students' interest in a career in science, Astalini et al (2019) students who are interested in a career in science are students who have high scores in school. In addition to the results that have been obtained stating that the average student in rural areas is higher compared with urban areas. This statement is supported by the study of Astalini et al (2019a;
2019b) that students in rural areas have high self-confidence in choosing a career in the field of science.
Therefore, it can be seen that there are significant differences that are owned by students who are in rural compared to urban areas. By knowing the differences that are owned by students, the government is able to make regulations that can help schools and educators in choosing what teaching methods can be implemented.
CONCLUSION AND SUGGESTION
The novelty of this research is that the study was conducted in two different regions with rural and urban backgrounds which are more focused on the three indicators of attitude used. Based on the results and discussion that have been described, there are significant differences in the average group for students who live in urban and rural areas which have been measured based on three indicators of student attitudes toward science subjects, namely indicators of adoption of scientific attitudes, pleasure in learning science and interest in a career in science fields which has become an indicator. The results showed that if the average group of students living in rural areas and urban areas would get the results of the average group of students living in rural areas higher than the average student living in urban areas based on these three indicators due to attitudes of students who are still in rural areas are still thick with their customs and culture and parents of students are more attentive to their children, while students who are in urban areas have been infected or affected by the outside world and their parents are more busy working than educating the children.
REFERENCES
Alexander, J. M., Johnson, K. E., & Kelley, K. (2012). Longitudinal Analysis of the Relations Between Opportunities to Learn About Science and the Development of Interests Related to Science. Science Education.
Ali, M. S., Iqbal, A., & Saeed Akhtar, M. M. (2013). Students’ Attitude towards Science and its Relationship with Achievement Score at Intermediate Level.
Anggraini, L., & Perdana, R. (2019). Hubungan Sikap dan Percaya Diri Siswa Pada Mata Pelajaran IPA di Sekolah Menengah Pertama. SPEKTRA: jurnal Kajian Pendidikan Sains, 5(2), 188-199.
Astalini., Darmaji., Kurniawan, D. A., & Destianti, A. (2019). Description of the Dimensions Attitudes towards Science in Junior High School at Muaro Jambi. Int. J. Sci. Basic Appl. Res.(IJSBAR), 47(1), 1-11.
Astalini, A., Darmaji, D., Kurniawan, D. A., Sumaryanti, S., Perdana, R., & Susbiyanto, S. (2019). Description Of Relationship Between Students Interests And Attitudes In Physical Subject In Indonesia. Journal of Educational Science and Technology (EST), 5(3).
Astalini, & Kurniawan, D. A. (2019). Pengembangan Instrumen Sikap Siswa Sekolah Menengah Pertama Terhadap Mata Pelajaran Ipa. Jurnal Pendidikan Sains (JPS), 7(1), 1-7.
Astalini, Kurniawan, D. A., & Anggraini, L. (2019). Correlation Between Confidence With Attitude Toward Science In Secondary School In Indonesia. BJES, 30.
Astalini, Kurniawan, D. A., Darmaji., Sitorus, L. R., & Perdana, R. (2019). Characteristic of students attitude to physics in Muaro Jambi high school. Humanities & Social Science Reviews, 7(2), 91-99.
Astalini, A., Kurniawan, D. A., Kurniawan, N., & Anggraini, L. (2019). Evaluation of Student's Attitude toward Science in Indonesia. Open Journal for Educational Research, 3(1), 1-12.
Astalini, A., Kurniawan, D. A., & Nurfarida, L. Z. (2018). Deskripsi sikap siswa SMA di Batanghari berdasarkan indikator normalitas ilmuwan, adopsi dari sikap ilmiah, ketertarikan memperbanyak waktu, dan ketertarikan berkarir di bidang fisika. Jurnal Riset dan Kajian Pendidikan Fisika, 5(2), 73-80.
Bybee, R., McCrae, B., & Laurie, R. (2009). PISA 2006: An Assessment of Scientific Literacy. Journal of Research in Science Teaching, 865-883.
Creswell, J. W. (2017). Research Design: Pendekatan Metode Kualitatif, Kuantitatif, dan Campuran, Edisi Keempat. Yogyakarta: PUSTAKA BELAJAR.
Dimyati, & Mudjiono. (2006). Belajar dan Pembelajaran. Jakarta: PT. RINEKA CIPTA.
Doyan, A., Taufik, M., & Anjani, R. (2018). Pengaruh Pendekatan Multi Representasi Terhadap Hasil Belajar Fisika Ditinjau dari Motivasi Belajar Peserta Didik.
Jurnal Penelitian Pendidikan IPA, 35-45.
Erdogan, S. C. (2017). Science Teachig Attitudes and Scientific Attitudes of Pre-service Teachers of Gifted Students. Journal of Education and Practice, 164-170.
Halim, L., Rahman, N. A., Zamri, R., & Mohtar, L. (2017). The role of parents in cultivating children's interest towards science learning and careers. Journal of Sciences, 1-7.
Jebson, S. R., & Hena, A. Z. (2016). Students` Attitude Towards Science Subjects In Senior Secondary. IMPACT: International Journal of Research in Applied, Natural and Social Sciences (IMPACT: IJRANSS)
, 117-124.
Kerlinger, F. N. (2014). Asas-Asas Penelitian Behavioral. Yogyakarta: Gadjah Mada University Press.
Kurniawan, D. A., Astalini, A., & Anggraini, L. (2019). Evaluasi sikap siswa smp terhadap ipa di kabupaten muaro jambi. Jurnal Ilmiah Didaktika: Media Ilmiah Pendidikan dan Pengajaran, 19(1), 124-139.
Lacap, M. P. (2015). The Scientific Attitudes of Students Major In Science in the New Teacher Education Curriculum. Asia Pasific Journal of Multidisciplinary Research, 7-15.
Lee, S., & Kim, S. H. (2018). Scientific Knowledge and Attitudes Toward Science in South Korea: Does Knowledge Lead to Favorable Attitudes. SAGE Journal, 1-26.
A Validity Study of Attitudes toward Science Scale among Iranian Secondary School Students. International Education Studied.
Maharaj-Sharma, R., & Sharma, A. (2017). Using ICT Secondary School Science Teaching - What Students and Teachers in Trinidad and Tobago Say? European Journal of Education Studies, 2501-1111.
Manasia, L. (2015). Enjoyment of learning in upper secondary education. An exploratory research. Social and Behavioral Sciences, 639-646.
Narmadha, U., & Chamundeswari, D. (2013). Attitude Toward Learning of Science and Academic Achievement in Science among Students at the Secondary Level. Journal of Sociological Research, 2.
Nursa'adah, F. P. (2014). Pengaruh Metode Pembelajaran Dan Sikap Siswa Pada Pelajaran Ipa Terhadap Hasil Belajar Ipa.
Jurnal Formatif, 112-123.
Pamungkas, A., Subali, B., & Lunuwih, S. (2017). Implementasi Model Pembelajaran IPA Berbasis Kearifan Lokal untuk Meningkatkan kreativitas dan Hasil Belajar Siswa. Jurnal Inovasi Pendidikan IPA, 118-127.
Perdana, R., Subiyantoro, C., & Anggraini, L. (2019). Sikap dan Motivasi Siswa Pada Pelajaran Fisika di Sekolah Menengah Atas. PSEJ (Pancasakti Science Education Journal), 4(2), 128-136.
Pringle, P. M., Mesa, J., & Hayes, L. (2017). Professional Development for Middle School? Journal of Science Teacher Education, 57-72.
Rijal, S., & Bachtiar, S. (2015). Hubungan antara Sikap, Kemandirian Belajar, dan Gaya Belajar dengan Hasil Belajar Kognitif Siswa. Jurnal BIOEDUKATIKA, 15-20.
Rohmawati, A. N. (2012). Penerapan Pembelajaran Ipa Terpadu Dengan Model Pembelajaran Inkuiri Pada Tema Mata Di Smp Negeri 1 Maduran Lamongan.
Jurnal Pendidikan Sains, 76-91.
Sofiani, D., Maulida, A. S., Fadhilah, N., & Sihite, D. Y. (2017). gender Differences in Students' Attitude Toward Science.
International Conference on Mathematic and Science Education (p. 895). IOP Publishing.
Topcu, M. S., & Sahin-Pekmez, E. (2009). Turkish Middle School Students' Difficulties in Learning Genitic Concepts. Journal of Turkish Science Education, 55-62.
Wood, K. (2011). Education is Basic. New York: Taylor & Francis Group.