AUTOMATIC MULTILEVEL IMAGE SEGMENTATION BASED ON
FUZZY REASONING
L
IANGT
ANG1, W
EI-X
INX
IE2 ANDJ
IAN-J
UNH
UANG21School of Electronical Engineering, Xidian University, Xi’an, 710071, CHINA; 2
School of Information
Engineering, ShenZhen University
ShenZhen, 518060, CHINA
e-mails:
[email protected]
,[email protected]
(Accepted December 24, 2003)
ABSTRACT
An automatic multilevel image segmentation method based on sup-star fuzzy reasoning (SSFR) is presented. Using the well-known sup-star fuzzy reasoning technique, the proposed algorithm combines the global statistical information implied in the histogram with the local information represented by the fuzzy sets of gray-levels, and aggregates all the gray-levels into several classes characterized by the local maximum values of the histogram. The presented method has the merits of determining the number of the segmentation classes automatically, and avoiding to calculating thresholds of segmentation. Emulating and real image segmentation experiments demonstrate that the SSFR is effective.
Keywords: automatic multilevel image segmentation, histogram, sup-star fuzzy reasoning.
INTRODUCTION
Image segmentation is one of the oldest and most difficult problems in the field of image processing or analysis, which consists of subdividing an image into its nonoverlapping constituent parts and extracting these parts of interest (objects). A great variety of segmentation algorithms have been developed in the last few decades (Zhang, 2001). One of the most frequently used methods in image segmentation is thresholding technique based on histogram because of its simplicity and efficiency (Glasbey, 1993). The presented methods in this field, such as P-tile method, Ostu method, Maximum Entropy Criterion (MEC), and Maximum Correlation Criterion (MCC) etc., focus mostly on one-dimensional (1-D) histogram and identify the different homogeneous regions of an image by gray-level thresholding. But, the number of classes that the gray-levels should be classified into is difficult to decide and usually is given by supervision (Chang and Wang, 1997; Pei and Xie, 1999). Although Yen et al. (1995) proposed a criterion for multilevel thresholding, named as Automatic Thresholding Criterion (ATC), to overcome this problem, there still remains a problem of how to select the weighting parameter used in ATC. On the other hand, information included in 1-D histogram is imperfect, as we can easily construct two images consisting of different objects and background with the same histogram. Especially,
when image is polluted by noise, thresholding techniques based on 1-D histogram would give rise to many meaningless small patches. So, considering the spatial information in images, researchers have followed some two dimensional (2-D) histogram-based segmen-tation methods (Brink, 1992; Chen et al., 1994). Pixels having the same intensity but different spatial features can be distinguished in the second dimension (e.g., local average gray level) of the 2-D histogram, which enhances the capability of segmentation. However, besides increasing computational complexity, 2-D threshold also makes a problem of how the classifying function (line of demarcation) is defined in the 2-D plane.
AUTOMATIC MULTILEVEL IMAGE
SEGMENTATION USING SSFR
It is generally believed that image processing bears some fuzziness in nature due to following factors (Cheng et al., 1997): (a) information loss while mapping 3-D objects into 2-D images, (b) ambiguity and vagueness in some definitions (such as edges, boundaries, regions, textures, etc.), (c) ambiguity and vagueness in interpreting low-level image processing results. Therefore, the fuzzy set theory has been successfully applied to many image processing areas, so did in image segmentation (Pei and Xie, 1999; Cheng et al., 2000; Bonnet et al., 2002).
Ideally, each class in an image should take on an approximately identical gray-level, and its histogram should have several narrow and independent peaks. But in real world, many reasons make gray-levels of each class diffusing to some extent, and peaks in their histogram spread. However, in the opinion of the statistic theory, gray- levels of one and the same class would establish a local maximum in the histogram. In other words, it is likely that a local maximum (peak) in histogram corresponds to a class and represents the original gray-level of this class, and other gray-levels in each class are scattering around the local maximum. So, most of the histogram-based thresholding technique applied themselves to search peaks and calculate threshold value corresponding to valley between two adjacent peaks. In this paper, because of the reasons mentioned in the previous paragraph, we do this work in the fuzzy mode. In the sight of fuzzy theory, it can be seen in some sense that each value in normalized histogram expresses the fuzzy degree of a gray-level corresponding to a class. Peaks have bigger fuzzy degrees than their surrounding gray-levels. It is a kind of global information. As for each unique gray-level, it may belong to the class characterized by itself, or may belong to the class characterized by an adjacent local maximum. This possibility has a typical local ambiguity. If the global information implying in histogram and the local possibility are incorporated, these ambiguities would be clarified and the segmentation would be achieved.
Suppose there is a gray-level (or gray-level pair in 2-D case, the same below) G in an image, whose local possibility of class attribute is represented by a fuzzy set G~. The argument domain of G~ is the range of gray-levels in image, and its core element (with grade of membership be 1) is G itself (this means that, in local sense, G belongs to the class characterized
Accumulating all the gray-level fuzzy sets of pixels in the image, we get a fuzzy histogram H~ (1-D or 2-D). The grade of membership µH~ expresses the global probability of a gray-level corresponding to a class, with local ambiguities taken into account.
To reason out which class each gray-level is belonging to, the global information (grade of membership µH~) and the local information (grade of membership µG~) should be taken into account synthetically. To do so, we set up a fuzzy reasoning rule, with its formation described as below:
If gray-level G belongs to class Cj locally, and class Cj exists globally, thenG belongs to Cj globally.
G
~
in
elements
of
number
,
,
j
=
1
L
,where a class is represented by its center gray-level Cj. In this rule, the confidence level of the first antecedent is denoted by membership function
) (
~ j
G C
µ , and the second is denoted by µH~(Cj). According to the fuzzy reasoning mechanism, the confidence level of G globally belonging to a class Cj is given by:
( )
G~ in elements of number , , j ), j C ( H~ ) j C ( G~ j C G L 1 = ∗=µ µ
µ
(1)
where star (∗) denotes t-norm operator which can be selected as minimum or product. The global and local information are combined by this operator. With local ambiguity, G may belong to many classes, so that many sentences are generated in the form of the reasoning rule, while different sentence is accompanied with different confidence level. In order to make sure which class G is indeed belonging to, the sup-star fuzzy reasoning algorithm is adopted. Namely, the class Cj, which makes Supremum value of µG in Eq.
1, is the class that G belongs to with the most possibility. We can write it as:
{
(Cj)}
H~ ) j C ( G~ j C arg G
C = supµ ∗µ (2)
where the sup operator ensures that G is assigned to the class characterized by the local maximum.
image segmentation is achieved. In this process, the number of classes in image is not predefined, and no thresholds are computed. At the same time, segmented image is displayed by the most representative gray-levels of classes. Thus, the bits needed to store the image are reduced, as well as the intensity information of original image can be preserved preferably.
DESCRIPTION OF THE PROCEDURE
1-D histogram is the most fundamental statistical information of gray image. It is also one of the simplest image information with the result that 1-D histogram based techniques are straightforward and effective. The SSFR multilevel segmentation algorithm based on 1-D histogram consists of four steps as below:
Based on its gray-level Gi, all pixels Ii of image I are fuzzified as fuzzy sets Gi =∫j G gj gj
i( ) ~
~
µ
[
0,255]
∈
j
g where ∫ denotes the union of elements.
i
G~
µ renders the local possibility of class contribution of Gi with G~ (Gi)=1
i
µ and the membership of remaining elements inversely proportional to
i
j G
g − . In this paper, the Gaussian membership function is adopted, so we have:
(
)
[
2 2σ2]
µ (gj ) exp gj Gi i
G~ = − − (3)
where σ is the deviation of Gaussian function. step 1 Supposing the number of pixels in I is M,
the fuzzy 1-D histogram,
[
0,255]
, ) (
~ ~ ∈
∫
= j H gj gj gj
H µ ,
can be calculated as:
∑ = ∑= ∑ = = 255 0 1 1 j M
i G~i(gj) M
i G~i(gj ) )
j g (
H~ µ
µ
µ (4)
( )
j H~ gµ renders the global possibility of g j corresponding to a class.
step 2 Compute class CGi. which Gi is belonging to according to Eq. 2, with * selected as minimum operator:
[
0,255]
~ ~ ∈ = j C ) j (C H µ ), j (C i G µ min sup j C arg i G C , (5)
Then, replace all pixels taking gray-level Gi in original image with class gray-level CGi. Consequently, we can get a new histogram H' described as Eq. 6, where δ
( )
⋅ denotes the Dirac function:[
0,255]
∈ ∑ = ∑= − ∑ = − = ′ k 255 0 k M 1
i δ CGi k M
1
i δ CGi k (k)
H
, (6)
step 3 After operating as mentioned above, the most gray-levels of original image have been merged into some classes characterized by several distinct and isolated peaks. But, there may be few pixels, whose gray-levels are still scattering around peaks. Because of that the noise occurs and gray-levels of some classes spread widely. In order to overcome this problem, step 1~3 can be repeated till all the gray-levels are merged into their classes and the histogram does not change anymore. Lastly, the original image is segmented.
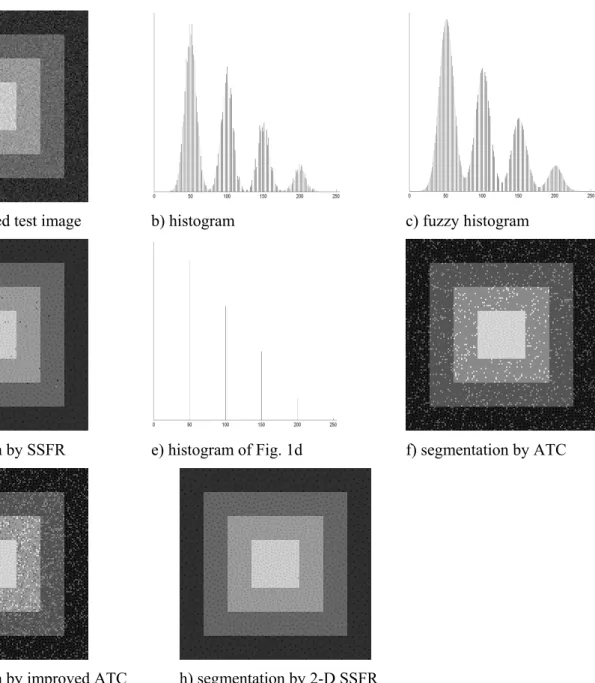
a) slightly noised test image b) histogram c) fuzzy histogram
d) segmentation by SSFR e) histogram of Fig. 1d f) segmentation by ATC
g) segmentation by improved ATC h) segmentation by 2-D SSFR
Fig. 1. Illustration of the SSFR segmentation procedure, through a slightly noised emulational test image (Gaussian noise with variance of 65.535) of four classes. Parameter σ =6 for SSFR.
As mentioned previously, 2-D histogram catches more image information than 1-D histogram so that it can give rise to more favorable segmentation result. The SSFR method can be extended to 2-D case straightforwardly. A simple and typical 2-D histogram is constructed by gray-level of pixel and its local average level. These two kinds of gray-levels compose a gray-level pair Pi for each pixel. By analogy with 1-D case (e.g. Eq. 3), Pi is fuzzified as a 2-D fuzzy set P~i = ∫∫ µP~(gj, fk) (gj, fk),
(
)
[
2 2σ2]
[
(
)
2 2σ2]
µ
i f k f exp i
g j g exp
) k f , j g ( i P~
− − ⋅ −
−
=
(7)
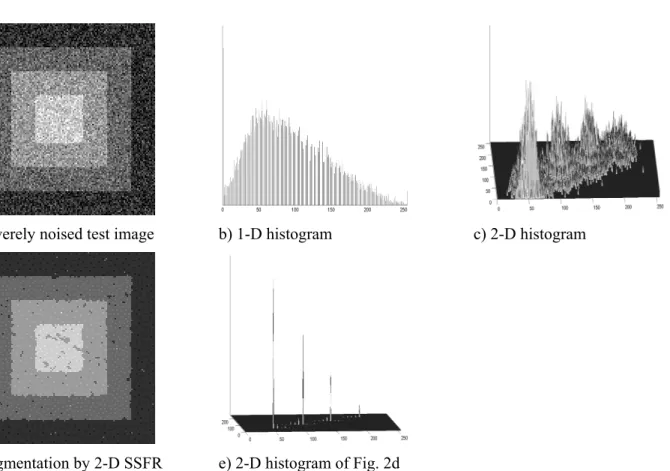
is shown in Fig. 1h, with only 1 pixel misclassified. To exhibit the advantages of 2-D SSFR further, an experiment on a severely noised (Gaussian noise with variance of 655.35) test image (Fig. 2a) is displayed in Fig. 2. It can be seen from Fig. 2b that the four classes of the image are totally mixed up in its 1-D histogram, that is, it is almost impossible to segment this image based only on its 1-D histogram. However, four peaks are visible in its 2-D histogram (Fig. 2c), which means that segmentation based on 2-D histogram would be promising. Figs. 2d-e display the segmented image and its D histogram resulted in 2-D SSFR. The four classes have been partitioned favorably even in this difficult condition. In this test, 429 pixels have been misclassified.
EXPERIMENTAL RESULTS AND
DISCUSSION
To demonstrate the effectiveness of the proposed SSFR method for automatic multilevel segmentation,
some experimental results are given in this section (σ =3 for all the experiments in this section).
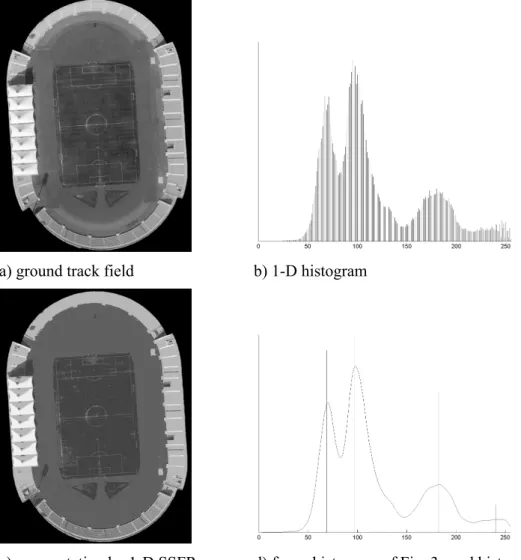
First, to examine the exactness of SSFR segmentation algorithm, an aerial image of a ground track field is segmented by 1-D SSFR. Figs. 3a-b display the original image and its histogram. The field is composed of four regions (grass court, running path, bleachers, and awning), and four peaks are generated in its histogram. Fig. 3c shows the segmented result, which is favorable with the four regions partitioned distinctly. In Fig. 3d, fuzzy histogram of the original image and histogram of the segmented image are depicted together. It can be seen that the proposed method aggregates all the gray-levels into classes characterized accurately by four local maxima, so that the segmented image is displayed by the most representative gray-levels of the classes. Therefore, the intensity information of the original image is preserved preferably.
a) severely noised test image b) 1-D histogram c) 2-D histogram
d) segmentation by 2-D SSFR e) 2-D histogram of Fig. 2d
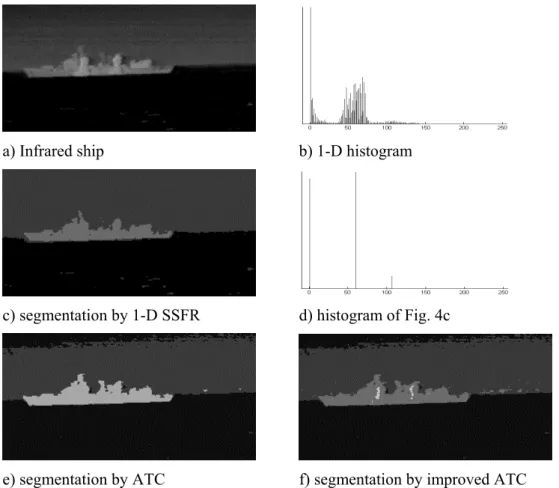
Fig. 4 indicates a segmentation experiment on an infrared ship image. The original infrared ship image and its histogram are shown in Figs. 4a-b. Figs. 4c-d display the segmented image using SSFR and its histogram. For comparison, the results of the ATC and the improved ATC are shown simultaneously, in Figs. 4e-f, respectively. The uniformity measure (Levine and Nazif, 1985) is used to make the quantitative evaluation of the methods and to test the performance. It indicates the degree of spread of the segmented regions from the mean. The uniformity
measure of a region is inversely proportional to the variance of the values evaluated at those pixels belonging to that region. A well-segmented image will have uniformity measure close to 1. Class numbers C and uniformity measures UM of this experiment are listed in Table 1. Obviously, this image should be partitioned into three regions: ship, sky, and ocean. As we can see, the results of 1-D SSFR are the best either in visual impression or in quantitative evaluation, ATC takes is second best, while the improved ATC computes a wrong class number.
a) ground track field b) 1-D histogram
c) segmentation by 1-D SSFR d) fuzzy histogram of Fig. 3a and histogram of Fig. 3c
a) Infrared ship b) 1-D histogram
c) segmentation by 1-D SSFR d) histogram of Fig. 4c
e) segmentation by ATC f) segmentation by improved ATC
Fig. 4. “Infrared ship” image and automatic multilevel segmentation results of different methods.
Table 1. Number of classes of segmented images (C) and uniformity measure (UM).
1-D SSFR ATC Improved ATC 2-D SSFR
Fig. 4 C 3 3 4
UM 0.9429 0.8629 0.8621
Fig. 5 C 3 3 3 3
UM 0.9230 0.7163 0.7163 0.9281
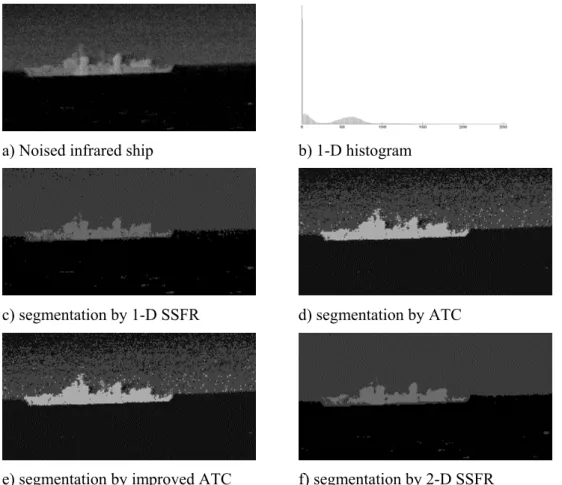
In order to examine the effectiveness of 2-D SSFR, an artificially noised (Gaussian noise with variance of 65.535) infrared ship image is used. Figs. 5a-b display the noised image and its histogram. Figs. 5c-f show the segmented image resulted in 1-D SSFR, ATC, improved ATC, and 2-D the SSFR, respectively. Class numbers and uniformity measures of this experiment are also listed in Table 1. It can be observed that all the methods compute the right class
a) Noised infrared ship b) 1-D histogram
c) segmentation by 1-D SSFR d) segmentation by ATC
e) segmentation by improved ATC f) segmentation by 2-D SSFR
Fig. 5. Noised “Infrared ship” image (Gaussian noise with variance of 65.535) and automatic multilevel segmentation results of different methods.
CONCLUSION
An automatic multilevel image segmentation algorithm is presented. The main point of this method is that, in terms of sup-star fuzzy reasoning, it combines the global statistical information implied in the 1-D or 2-D histogram with the local information represented by the fuzzy sets of gray-levels, and aggregates scattering gray-levels into the representative gray-levels of classes. 1-D and 2-D based SSFR segmentation methods determine the appropriate number of classes automatically, and do not calculate any threshold or classifying function. The experimental results prove that the presented methods have improved performance in contrast with respect to other approaches.
ACKNOWLEDGEMENTS
This research is supported by the National Natural Science Foundation of China (No. 60172066). We are
"The preliminary form of this paper was originally presented at the XIth International Congress for Stereology-Beijing Conference, Beijing, China, 4-8 November 2003."
REFERENCES
Bonnet N, Cutrona J, Herbin M (2002). A “No-Threshold” Histogram-Based Image Segmentation Method. Pattern Recogn 35:2319-22.
Brink AD (1992). Thresholding of Digital Images Using Two-Dimentional Entropics. Pattern Recogn 25: 803-8. Chang CC, Wang LL (1997). A Fast Multilevel Thresholding
Method Based on Lowpass and Highpass Filtering. Pattern Recogn Lett 18:1469-78.
Chen WT et al. (1994). A Fast Two-Dimentional Entropic Thresholding Algorithm. Pattern Recogn 27:885-93. Cheng HD, Chen JR, Li JG (1997). Threshold Selection
Based on Fuzzy C-Patition Entropy Approach. Pattern Recogn 31(7):857-70.
Glasbey CA (1993). An Analysis of Histogram-Based Thresholding Algorithms.CVGIP 55(6):532-7. Levine MD, Nazif AM (1985). Dynamic measurement of
computer generated image segmentation. IEEE Trans. On Pattern Analysis and Machine Intelligence 7(2): 155-64.
Pei JH, Xie WX (1999). Adaptive Multi Thresholds Images Segmentation Based on Fuzzy Restrained Histogram FCM Clustering (in Chinese). Acta Electronica Sinica 27(10):38-42.
Sezgin M, Tasaltìn R (2000). A New Dichotomization Technique to Multilevel Thresholding Devoted to Inspection Applications. Pattern Recogn Lett 21:151-61.
Yen JC, Chang FJ, Chang S (1995). A New Criterion for Automatic Multilevel Thresholding. IEEE Trans. On Image Processing 4(3):370-8.