Web Report #4313b
Performance Benchmarking for
Performance Benchmarking for
About the Water Research Foundation
The Water Research Foundation (WRF) is a member-supported, international, 501(c)3
nonprofit organization that sponsors research that enables water utilities, public health
agencies, and other professionals to provide safe and affordable drinking water to
consumers.
WRF’s mission is to advance the science of water to improve the quality of life. To achieve
this mission, WRF sponsors studies on all aspects of drinking water, including resources,
treatment, and distribution. Nearly 1,000 water utilities, consulting firms, and
manufacturers in North America and abroad contribute subscription payments to support
WRF’s work. Additional funding comes from collaborative partnerships with other national
and international organizations and the U.S. federal government, allowing for resources to
be leveraged, expertise to be shared, and broad-based knowledge to be developed and
disseminated.
From its headquarters in Denver, Colorado, WRF’s staff directs and supports the efforts of
more than 800 volunteers who serve on the board of trustees and various committees. These
volunteers represent many facets of the water industry, and contribute their expertise to
select and monitor research studies that benefit the entire drinking water community.
Research results are disseminated through a number of channels, including reports, the
Website, Webcasts, workshops, and periodicals.
WRF serves as a cooperative program providing subscribers the opportunity to pool their
resources and build upon each other’s expertise. By applying WRF research findings,
subscribers can save substantial costs and stay on the leading edge of drinking water
science and technology. Since its inception, WRF has supplied the water community with
more than $460 million in applied research value.
More information about WRF and how to become a subscriber is available at
Sponsored by:
Water Research Foundation
Prepared by:
Michael Matichich
CH2M HILL, 901 New York Avenue NW, Suite 5100 W, Washington, DC 20001
Yakir J. Hasit
CH2M HILL, 1717 Arch Street, Suite 4400, Philadelphia, PA 19103
Fair Yeager
CH2M HILL, 2625 South Plaza Drive, Suite 300, Tempe, AZ 85282
Jaason Englesmith
CH2M HILL, 1737 North 1st Street, Suite 300, San Jose, CA 95112-4524
Linda Paralez
Demarche Consulting Group, 999 Third Avenue, Suite 3800, Seattle, WA 98104-3100
Wayne Francisco
GHD Inc., 222 South Church Street, Suite 400, Charlotte, NC 28202
and
Rob Greenwood
Ross & Associates, 1218 Third Avenue, Suite 1207, Seattle, WA 98101
Performance Benchmarking for
DISCLAIMER
This study was funded by the Water Research Foundation (WRF). WRF assumes no
responsibility for the content of the research study reported in this publication or for the
opinions or statements of fact expressed in the report. The mention of trade names for
commercial products does not represent or imply the approval or endorsement of WRF.
CONTENTS
LIST OF TABLES ... ix
LIST OF FIGURES ... xi
FOREWORD ... xiii
ACKNOWLEDGMENTS ... xv
EXECUTIVE SUMMARY ... xvii
CHAPTER 1
:
INTRODUCTION ... 1
Background ... 1
Objectives ... 2
Project Team ... 2
Utility Participants ... 3
Report Organization ... 6
CHAPTER 2
:
PROJECT APPROACH ... 9
Introduction ... 9
Phase 1 ... 9
Literature Review... 9
Utility Surveys ... 10
Development of Benchmarking Framework ... 10
Development of Benchmarking Tool ... 11
Phase 2 ... 11
Recruitment of Additional Utilities ... 11
Benchmarking Test ... 11
Refinements to Benchmarking Framework and Tool ... 11
Development of Recommendations ... 12
CHAPTER 3
:
LITERATURE REVIEW ... 13
Introduction ... 13
Summary of Literature Review ... 13
Support Development of Practice Areas and Associated Benchmarking
Metrics ... 14
CHAPTER 5
:
DEVELOPMENT OF BENCHMARKING FRAMEWORK ... 21
Introduction ... 21
Development of Practice Areas ... 21
Development of Performance Measures ... 22
Benchmarking Framework ... 24
CHAPTER 6
:
BENCHMARKING SELF-ASSESSMENT TOOL ... 29
System Requirements... 29
Tool Features ... 29
CHAPTER 7
:
PHASE 2 BENCHMARKING TESTS ... 35
Overview of Phase 2 Testing ... 35
Elements of Phase 2 Testing ... 35
Webinar Kickoff ... 35
Select Attributes ... 36
Develop Framework... 36
Conduct Self-Assessment ... 36
Consider How to Narrow Gaps ... 36
Provide Feedback ... 36
Report on Level of Effort ... 37
Schedule for Phase 2 Testing ... 37
Summary of Attributes Tested ... 37
Feedback From Phase 2 Utilities ... 38
Feedback on the Overall Benchmarking Process ... 38
Feedback on Attributes and Subcomponents of Greatest Interest ... 39
Feedback on the Framework ... 46
Feedback on the Benchmarking Tool ... 49
Feedback on Time Requirements to Conduct the Self-assessment
Benchmarking ... 51
Feedback on the Usefulness of the Process for Others ... 54
Use of Feedback to Refine the Benchmarking Framework and Tool ... 55
CHAPTER 8: RECOMMENDED APPROACH FOR CONDUCTING
A SELF-ASSESSMENT ... 57
Introduction ... 57
Form a Benchmarking Team and Develop an Initial Action Plan ... 57
Tracking the Implementation Plans ... 67
Future Benchmarking Plans ... 67
CHAPTER 9
:
CONCLUSIONS AND RECOMMENDATIONS ... 69
Significance of the Results for Utilities ... 69
Other Considerations and Additional Research ... 69
Future Development... 70
Development of a Library of Strategies ... 70
Provision for Cross-Utility Comparisons... 70
Future Updates to the Tool and Recommended Process ... 72
Use of the Framework/Tool Developed for this Project ... 72
REFERENCES ... 73
ABBREVIATIONS ... 75
APPENDIX A:
LITERATURE SURVEY OF THE PRACTICE AREAS AND
ASSOCIATED METRICS FOR THE TEN ATTRIBUTES... A-1
APPENDIX B1 AND B.2: PARTICIPATING UTILITY PRACTICE AREAS
TABLES
1.1
Phase 1 participating utilities and their practice areas ... 3
3.1
EUM practice areas observed from the literature review ... 15
4.1
Practice areas in use for each attribute by participating utilities ... 17
7.1
Summary of attributes tested ... 37
7.2
Comments on attributes and subcomponents of greatest interest ... 40
7.3
Summary of time required ... 51
FIGURES
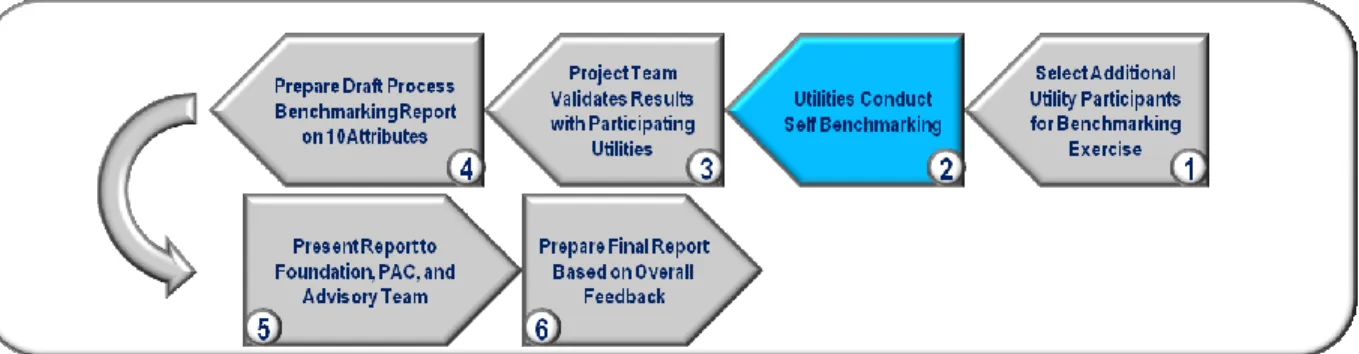
ES.1 Project approach... xviii
2.1
Project approach... 9
4.1
Distribution of reported practices ... 20
5.1
Example performance measure for product quality ... 23
5.2
Example performance measure for financial viability ... 24
5.3
Outline of the benchmarking framework ... 25
6.1
Example screen to select attributes ... 30
6.2
Example screen to select current and target performance for a measure ... 31
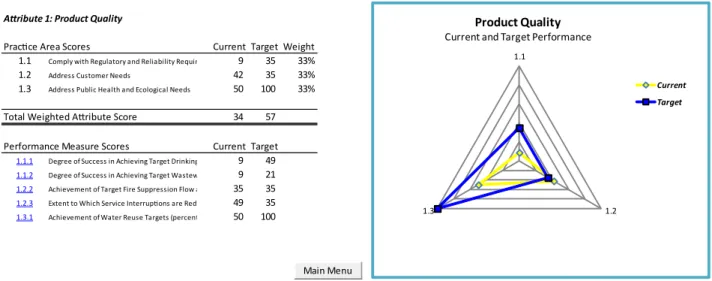
6.3
Example radar chart showing relative impact and contribution each practice had on
an attribute’s score ... 32
6.4
Example radar chart showing relative impact and contribution each attribute had on
overall utility score ... 33
7.1
Phase 2 testing steps... 35
7.2
Phase 2 utility benchmarking and report development steps ... 37
7.3
Most frequently selected attributes ... 39
7.4
Usefullness of the process as a means to identify strategies around performance gaps ... 47
7.5
Usefulness of the tool as a method for conducting self-assessment benchmarking. ... 48
8.1
Example of path to narrow gap for one performance measure ... 65
FOREWORD
The Water Research Foundation (WRF) is a nonprofit corporation dedicated to the
development and implementation of scientifically sound research designed to help drinking
water utilities respond to regulatory requirements and address high-priority concerns. WRF’s
research agenda is developed through a process of consultation with WRF subscribers and other
drinking water professionals. WRF’s Board of Trustees and other professional volunteers help
prioritize and select research projects for funding based upon current and future industry needs,
applicability, and past work. WRF sponsors research projects through the Focus Area, Emerging
Opportunities, and Tailored Collaboration programs, as well as various joint research efforts with
organizations such as the U.S. Environmental Protection Agency and the U.S. Bureau of
Reclamation.
This publication is a result of a research project fully funded or funded in part by WRF
subscribers. WRF’s subscription program provides a cost-effective and collaborative method for
funding research in the public interest. The research investment that underpins this report will
intrinsically increase in value as the findings are applied in communities throughout the world.
WRF research projects are managed closely from their inception to the final report by the staff
and a large cadre of volunteers who willingly contribute their time and expertise. WRF provides
planning, management, and technical oversight and awards contracts to other institutions such as
water utilities, universities, and engineering firms to conduct the research.
A broad spectrum of water supply issues is addressed by WRF's research agenda,
including resources, treatment and operations, distribution and storage, water quality and
analysis, toxicology, economics, and management. The ultimate purpose of the coordinated
effort is to assist water suppliers to provide a reliable supply of safe and affordable drinking
water to consumers. The true benefits of WRF’s research are realized when the results are
implemented at the utility level. WRF's staff and Board of Trustees are pleased to offer this
publication as a contribution toward that end.
Denise L. Kruger
Robert C. Renner, P.E.
Chair, Board of Trustees
Executive Director
ACKNOWLEDGMENTS
The authors of this report thank the Water Research Foundation (WRF) for its support of
this study and Linda Reekie,WRF research manager, for her help and guidance in the execution
of the project. The authors acknowledge the active participation and direction provided by the
members of the Project Advisory Committee, namely James Horne, U.S. Environmental
Protection Agency, Robin Casale Meterchick, American Water (retired), Dan Hartman, City of
Golden Public Works, Colorado, and JC Goldman, United Water, New Jersey (deceased). The
authors also acknowledge the six water industry organizations and their liaisons that supported
the project: Julia Anastasio, American Public Works Association, John Anderson, American
Water Works Association, Carolyn Peterson, Association of Metropolitan Water Agencies, Chris
Hornback, National Association of Clean Water Agencies, Matthew McCaffree, National
Association of Water Companies, and Barry Liner, Water Environment Federation. Roop
Lutchman (formerly with CH2M HILL, now with GHD) served as the principal investigator at
the start of this project.
The authors of this report are indebted to the following utilities and individuals for their
participation in this project by providing input on current utility practices, contributing to the
development of the benchmarking framework, and testing the benchmarking tool developed for
this project:
Frank Roth, Albuquerque Bernalillo County Water Utility Authority, New Mexico
Kathy Davies Murphy and Wayne Lingard, City of Calgary Water Resources, Alberta,
Canada
Richard Bickerstaff, Charleston Water System, South Carolina
John Presta, Regional Municipality of Durham, Ontario, Canada
Amber Halloran, Louisville Water Company, Kentucky
Eric Saylor, Metropolitan Sewer District of Greater Cincinnati (MSDGC), Ohio
Mark Cross, Peoples Water Service Company of Florida, Inc., Florida
Janice Hatton, Region of Peel, Ontario, Canada
Richard Noehammer and Madis Kreem, Toronto Water, Ontario, Canada
Cheryl Welch, Tualatin Valley Water District, Oregon
Donna Wies, Union Sanitary District, California
Steve Whipp, United Utilities Water PLC, United Kingdom
The authors also thank the following utilities and individuals who either provided input
for the framework or tested the tool:
Gwenn Maxfield, Covington Water District, Washington
Judy Gleason, Fort Wayne City Utilities, Indiana
Gregory Anderson and Kathryn Garcia, New York City Department of Environmental
Protection, New York
Stephen Rot, City of Scottsdale, Arizona
Sandy Oblonsky and Angela Cheung, Santa Clara Valley Water District, California
Tommy Brown, Tampa Bay Water, Florida
Mike Sweeney, Toho Water Authority, Florida
Julia Hunt, Trinity River Authority, Texas
Laurie Krause, WaterOne, Water District #1 of Johnson County, Kansas
Crystal Knight-Lee, Washington Suburban Sanitary Commission, Maryland
EXECUTIVE SUMMARY
OBJECTIVES
The objectives of this project, “Performance Benchmarking for Effectively Managed
Water Utilities”, were to build upon past Effective Utility Management (EUM) work by:
Identifying practice areas associated with achieving the Ten Attributes associated
with EUM;
Identifying key performance metrics for each practice area;
Providing the capability for utilities to identify targets associated with each leading
practice;
Developing a benchmarking framework and assessment methodology;
Developing a supporting benchmarking tool;
Pilot testing the framework across an appropriate cross-section of utilities; and
Making the tool available for the use and benefit of the water sector.
BACKGROUND
The U.S. Environmental Protection Agency (EPA) and organizations representing North
American water and wastewater utilities have long been cognizant of the challenges water sector
utilities are facing and have been identifying EUM practices to address them. In May 2006, EPA
and six of these organizations formed the Effective Utility Management Collaborating
Organizations to “formalize a collaborative effort among the signatory organizations in order to
promote effective utility management” (EPA et al. 2008). They developed a framework for
utility management that would result in effectively managed water utilities. These organizations,
with the support of 16 water and wastewater utilities then identified the following “Ten
Attributes of Effectively Managed Water Sector Utilities”:
1.
Product Quality
2.
Customer Satisfaction
3.
Employee and Leadership Development
4.
Operational Optimization
5.
Financial Viability
6.
Infrastructure Stability
7.
Operational Resiliency
8.
Community Sustainability
An explicit identification of the practice areas used by water sector utilities to support
the Ten Attributes, including a number of AWWA QualServe business systems areas
referenced in the previous EUM documents; and
A structured process benchmarking exercise that could help water sector utilities to
identify relevant performance metrics within the practice areas that could be scored to
guide the development of strategies to achieve performance excellence.
As a result, WRF sponsored this project to fill these gaps.
APPROACH
To achieve the project objectives, the project team executed the project in two phases.
Figure ES.1
shows the implementation methodology of this phased approach. WRF and the
Project Advisory Committee (PAC) encouraged a focus on the framework development and the
EUM self-assessment benchmarking tool.
RESULTS/CONCLUSIONS
Overall, the participating utilities found the tool useful in identifying gaps in performance
and helping to identify steps that they can take to reduce the priority gaps. In addition, they
offered many useful suggestions on refinements to the benchmarking framework
1, process, and
how it can be used by other interested utilities. A number of the suggestions on functionality and
contents made by utilities that tested the benchmarking tool have been incorporated into the tool
that is included with this report.
Feedback from the utilities included a number of important recommendations, including:
Form a benchmarking team to maximize the value of this effort.
Secure executive leadership endorsement and engagement in the benchmarking
process. Several utilities mentioned the value of engaging a cross-functional team that
includes representatives from the diverse functions addressed in the Ten Attributes.
Encourage dialogue about performance targets and current performance among
colleagues from diverse sections within utility organizations. This was found to be
useful in defining a path forward as an organization.
Use the findings of the benchmarking efforts to inform other planning processes,
including utility strategic plans, capital and operating budgets, and the development
of internal initiatives to address priority gaps.
Engage external stakeholders in the process. Some utilities did so even though the
testing period for this project was confined to a short time period.
Consider entering the benchmarking process progressively, conducting an initial
self-assessment, and then building upon the process as useful initial insights and action
steps are identified.
A number of utilities expressed interest in further development and research related to
identifying appropriate performance targets for some of the practice areas, and the possible need
for additional performance measures within some of the practice areas. In addition they
recommended three primary areas for future development of the benchmarking process and tool:
Develop a library of strategies for addressing priority performance gaps
Provide for cross-utility comparisons of utility targets and performance
Develop a process for future updates to the tool and self-assessment process
APPLICATIONS/RECOMMENDATIONS
3.
Select associated practice areas and performances measures to address.
4.
Revise plan of action (if needed).
5.
Conduct self-assessment benchmarking for selected attributes, practice areas, and
performance measures.
6.
Evaluate results and identify methods to narrow priority gaps.
7.
Develop follow-up plans.
Each utility’s context, however, is unique, including different goals for conducting
self-assessments, varying histories with performance measurement, and varying availability of
information and other resources to populate the assessment. As such, adaptation of the approach
and the sequence of these steps may be needed to provide maximum efficiency and value.
MULTIMEDIA
Some of the material covered in this report can be found on the
#4313 project page
.
These include the benchmarking self-assessment tool and user guide developed for this project,
which was designed using Microsoft Excel 2007 and Visual Basic.
The tool enables users to customize and select specific attributes and weigh these
attributes in relation to one other. Users can select any grouping of the Ten Attributes and the
model creates a customized self-assessment containing only the relevant attributes, practice areas
and performance measures chosen by the user. Based on the custom framework, the tool allows
users to score both current and target performance for the selected practices.
PARTICIPANTS
Close to 30 water sector utilities from the United States, Canada, UK and Australia
participated in this project. They were of different sizes (from less than 100,000 customers to
over millions of customers), geographies (different parts of North America), and types (water,
wastewater, and stormwater).
CHAPTER 1:
INTRODUCTION
BACKGROUND
Utilities are facing significant challenges as they strive to increase the quality and lower
the cost of services to their customers. These challenges include:
Increased customer level of service demands
Financial constraints
Aging infrastructure
Security and emergency response concerns
Growth
Climate change and reduced environmental footprint pressures
Stricter regulatory requirements
Retirement of experienced staff and related workforce shortages
The U.S. Environmental Protection Agency (EPA) and organizations representing North
American water and wastewater utilities have long been cognizant of these challenges and have
been identifying Effective Utility Management (EUM) practices to address them. For example,
EPA’s Office of Water has been working with utilities to promote the adoption of innovative
management system approaches to ensure utilities are sustainable into the future. One such effort
was documenting the management systems at eight leading utilities, the drivers to implement
these approaches, their costs and benefits, successes and challenges, and roles that stakeholders
can and do play in the process of developing and implementing the system (Ross & Associates
Environmental Consulting 2005).
In May 2006, EPA, the American Public Works Association (APWA), the Association of
Metropolitan Water Agencies (AMWA), the American Water Works Association (AWWA), the
National Association of Clean Water Agencies (NACWA), the National Association of Water
Companies (NAWC), and the Water Environment Federation (WEF) formed the Effective Utility
Management Collaborating Organizations (Collaborating Organizations). The Collaborating
Organizations entered into a Statement of Intent to “formalize a collaborative effort among the
signatory organizations in order to promote Effective Utility Management” (EPA et al. 2008) and
developed a framework for utility management that would result in effectively managed water
utilities. The seven organizations formed and chartered the Effective Utility Management
Steering Committee (Steering Committee) to advise them on a future joint water utility sector
management strategy that would be applicable to water, wastewater, and combined utilities
3.
Employee and Leadership Development
4.
Operational Optimization
5.
Financial Viability
6.
Infrastructure Stability
7.
Operational Resilience
8.
Community Sustainability
9.
Water Resource Adequacy
10.
Stakeholder Understanding and Support
These attributes provide reference points for utility managers seeking to improve
organization-wide performance. Additional sources on EUM can be found in Chapter 3,
Literature Review.
OBJECTIVES
Despite the number of EUM-related documents available to the water sector,
Effective
Utility Management: A Primer for Water and Wastewater Utilities (EPA et al. 2008) (the Primer)
and related documents offered no specific or discrete recommendations on how utilities would
develop and implement the attributes. WRF identified this opportunity to build upon the work
developed in the Primer and the AWWA QualServe program by addressing some components
that were not included in either of these efforts, including:
An explicit identification of the practice areas used by water sector utilities to support
the Ten Attributes and to excel in the various QualServe business systems areas, and
the associated metrics.
A structured process benchmarking exercise that could help water sector utilities to
identify practice areas and achieve performance excellence.
As a result, WRF sponsored this research project to fill the gaps identified above. The
project had the following objectives:
Identify practice areas associated with achieving the Ten Attributes.
Identify key metrics and potential targets associated with each leading practice.
Develop a benchmarking framework and assessment methodology. The framework
refers to the combination of practice areas and performance measures defined for the
Ten Attributes during this project, as elaborated in Chapter 4.
manager, Fair Yeager, deputy project manager and lead engineer, and Jaason Englesmith, software
tool developer. Additional members of CH2M HILL’s project team included Alan Ispass, who
served as senior advisor to the project management team and as attribute lead for Operational
Resiliency. Other attribute leads included Paul Swaim (Product Quality), Robert Pickett (Employee
Leadership and Development), Andrea Ramage (Community Sustainability), Steve McNicol
(Operational Optimization), and Armin Munevar (Water Resource Adequacy). Linda Paralez,
Demarche Consulting, led the Customer Satisfaction attribute, participated in the workshops and
contributed to the authorship of the report. Wayne Francisco, GHD, led the Infrastructure Stability
attribute, participated in the workshops, and reviewed the final report. Rob Greenwood, Ross
Strategic, led the Stakeholder Understanding and Support attribute and reviewed the final report.
Rob was supported by Morgan Hoenig from Ross Strategic.
Utility Participants
As discussed in Chapter 2, Project Approach, the project was executed in two phases.
During Phase 1, 20 utilities agreed to participate from the project outset by providing input on
their leading EUM practices and by joining teleconferences and workshops, when possible. One
additional utility joined the project during Phase 1. Some of them also tested the benchmarking
tool developed during Phase 2. Of these 21 utilities, 17 participated in Phase 1 and are listed in
Table 1.1
.
Table 1.1
Phase 1 participating utilities and their practice areas
Utility
Type
Type of
Ownership
Size
Region
Practice areas
Albuquerque
Bernalillo County
Water Utility
Authority, New
Mexico
W/WW
Public
Large
U.S.
All Ten Attributes
Charleston Water
System, South
Carolina
W/WW
Public
Medium U.S.
Water Resource Adequacy,
Customer Satisfaction,
Operational Resiliency
City of Calgary,
Water Resources,
Alberta
W/WW
Public
Large
Canada
Customer Satisfaction,
Infrastructure Stability,
Operational Resiliency,
Stakeholder Understanding
Table 1.1 (Continued)
Phase 1 participating utilities and their practice areas
Utility
Type
Type of
Ownership
Size
Region
Practice areas
Clean Water
Services
1, Oregon
WW/SW Public
U.S.
Not available
Green Bay
Metropolitan
Sewerage District,
Wisconsin
WW
Public
Medium U.S.
Financial Viability,
Customer Satisfaction,
Infrastructure Stability,
Community Stability
Gwinnett County
Department of
Water Resources,
Georgia
W/WW
Public
Medium U.S.
Stakeholder Understanding
and Support, Infrastructure
Stability, Customer
Satisfaction
Louisville Water
Company,
Kentucky
W
Public
Large
U.S.
Financial Viability,
Operational Resiliency,
Customer Satisfaction,
Infrastructure Stability,
Water Quality
Metropolitan
Sewer District of
Greater
Cincinnati, Ohio
WW
Public
Large
U.S.
Employee Leadership and
Development, Operational
Optimization,
Infrastructure Stability,
Stake Holder
Understanding and
Support
Onondaga County
Water Authority,
New York
W
Public
Medium U.S.
Customer Satisfaction,
Financial Viability,
Operational Resiliency,
Operational Optimization
Peoples Water
Table 1.1 (Continued)
Phase 1 participating utilities and their practice areas
Utility
Type
Type of
Ownership
Size
Region
Practice areas
The Regional
Municipality of
Durham, Works
Department,
Ontario
W/WW
Public
Large
Canada
Customer Satisfaction,
Infrastructure Stability,
Operational Resiliency,
Stakeholder Understanding
and Support, Community
Stability, Product Quality
Region of Peel,
Ontario
W/WW
Public
Large
Canada
Financial Viability,
Customer Satisfaction,
Infrastructure Stability,
Stakeholder Understanding
and Support, Community
Stability, Product Quality
South East Water,
Victoria
W/WW
Public
(Economic
Regulator)
Large
Australia All Ten Attributes
Toronto Water,
Ontario
W/WW
Public
Large
Canada
Employee Leadership and
Development, Product
Quality, Stakeholder
Understanding and
Support
Tualatin Valley
Water District,
Oregon
W
Public
Medium U.S.
Customer Satisfaction,
Financial Viability,
Operational Resiliency,
Operational Optimization
Union Sanitary
District, California
WW
Public
Medium U.S.
Product Quality, Customer
Satisfaction, Employee
Leadership and
Development, Operational
Optimization, Financial
Viability, Operational
Resiliency
Table 1.1 (Continued)
Phase 1 participating utilities and their practice areas
Utility
Type
Type of
Ownership
Size
Region
Practice areas
United Utilities
Water PLC,
Warrington
W/WW
Public
(Economic
Regulator)
Large
UK
Customer Satisfaction,
Infrastructure Stability,
Operational Resiliency,
Stakeholder Understanding
and Support
Notes:
1 Clean Water Services joined in the middle of Phase 1 and did not provide its practice areas SW=stormwater, W=water, WW= wastewater
Large >= 500,000 customers, Medium >=100,000 and < 500,000 customers, Small = <100,000 customers
During Phase 2, the following public water utilities that were not involved in its
development were recruited to test the tool and provide feedback:
Beaver Water District, Arkansas
Charlotte
‐
Mecklenburg Utility Department, North Carolina
Covington Water District, Washington
Fort Wayne City Utilities, Indiana
New York City Department of Environmental Protection, New York
City of Scottsdale, Arizona
Santa Clara Valley Water District, California
Tampa Bay Water, Florida
Toho Water Authority, Florida
Trinity River Authority, Texas
WaterOne, Water District #1 of Johnson County, Kansas
Washington Suburban Sanitary Commission, Maryland
Report Organization
This chapter (Chapter 1) provides project background and objectives. The remainder of
the report is organized as follows:
Chapter 4, Survey of Participating Utility Current Practice Areas and Performance
Measures, summarizes the results of an effort that was conducted by gathering
information from the participating Phase 1 utilities; details are provided in
Appendix B.
Chapter 5, Development of Benchmarking Framework, describes the development of
the practice areas, associated performance measures, and the resulting benchmarking
framework.
Chapter 6, Benchmarking Self-Assessment Tool, provides an overview of the
benchmarking self-assessment tool. Both the tool and the user guide can be accessed
on the
#4313 project page
.
Chapter 7, Phase 2 Benchmarking Tests, provides the results of the benchmarking
tool tests conducted during Phase 2 by the participating utilities.
Chapter 8, Recommended Approach for Conducting a Self-Assessment, provides the
recommended approach for conducting a self-assessment based on the conclusions
drawn from the feedback received by the utilities and recommendations made by the
Project Advisory Committee (PAC) and other technical experts.
Chapter 9, Conclusions and Recommendations, summarizes the major findings and
recommendations of the study and provides recommendations for future
enhancements to the self-assessment tool.
CHAPTER 2:
PROJECT APPROACH
INTRODUCTION
To achieve the project objectives, the team executed the project in two phases, with
project management provided throughout.
Figure 2.1
shows the implementation methodology of
this phased approach. WRF and the PAC encouraged a focus on the framework development and
the EUM self-assessment benchmarking tool.
Figure 2.1 Project approach
PHASE 1
Phase 1 identified the key metrics and practice areas associated with achieving the Ten
Attributes as described below.
attribute for easy reference in subsequent benchmarking framework and tool development
(Appendix A.)
Utility Surveys
As described in Chapter 1, this research effort engaged the participation of nearly 20
utilities representing a diverse group in terms of geographic location, system size, age of assets,
and ownership model. The effort included a number of utilities, such as the Union Sanitary
District and the Louisville Water Company, both of which have been active participants in the
EUM program since its inception. Input from the participating utilities on practices and
performance measures that they found useful within the Ten Attributes provided valuable input
during the development of the benchmarking framework.
Data requests were sent to all utility participants. Participants were asked to identify
practice areas and metrics that they currently employ for each of the Ten EUM Attributes
(Appendix B.) For practices currently in use, they were asked to describe the practice and then
provide information on the following:
Depth of implementation of the practice (capability and execution)
Metrics used to track performance for the practice
Supporting information related to the practice/measures if applicable
Any comments deemed important by the utility representatives
Development of Benchmarking Framework
Based on information compiled from the literature review and the participating utility
responses to the Phase 1 data requests, the team developed a benchmarking framework to capture
quantitative metrics and convert qualitative metrics to quantitative metrics to support the
assessment process. The framework was assembled in a hierarchical format as follows: (1)
attribute, (2) practice areas within the selected attribute, and (3) performance measures within the
identified practice areas.
After identifying specific performance measures, the team developed a scoring matrix for
each, capturing specific targets for degree of implementation and level of performance achieved
for each measure. The format for the performance measurement was developed by the project
team after a review of prior approaches to performance measurement, such as the process
benchmarking developed by the Water Services Association of Australia (WSAA) (Gee and
Vincent 2008), focusing on capability with regard to the measure and extent of execution of the
measure, and applicability to the Ten Attributes of EUM.
Development of Benchmarking Tool
Team members then designed and developed a Microsoft Excel 2007 with Visual Basic
assessment tool that supports the overall benchmarking framework. The tool was developed in
coordination with the PAC to ensure practicality, ease of use, and adaptability for future use. The
tool includes useful reports that can identify opportunity gaps and suggest generic strategies that
can be customized for each utility. The team also developed a User Guide to aid utilities in
completing their self-assessments in the testing phase.
PHASE 2
During Phase 2, the EUM framework, methodology, and tool were tested with water and
wastewater utilities, as described in the following sections.
Recruitment of Additional Utilities
While the types of initial utility participants provided adequate depth and breadth, the
team solicited additional participants to increase the overall value of the benchmarking results.
The team developed informational materials on the objectives, processes, expected results, and
benefits to utilities. Requests for participation were distributed via WRF’s Water Current
e-newsletter and AMWA’s e-e-newsletter. Also a few utilities expressed interest in participating
after attending a technical presentation about the research effort at the 2012 Utility Management
Conference. In addition to Phase 1 participants, 27 other utilities were recruited to participate in
the benchmarking test, with 12 of these utilities ultimately completing the testing process. In
total, 25 utilities provided feedback on the tool and benchmarking process at the close of the
Phase 2 test period.
Benchmarking Test
In addition to the User Guide, the team developed materials on the overall benchmarking
framework, assessment process, and use of the self-assessment tool. These resources were shared
via a series of webinars with the utility participants. After the webinars, the team distributed a
testing package to utilities; the package included the webinar presentation, instructional
memorandum, the tool, and the User Guide. The team then assigned liaisons to each utility to
serve as primary points of support contact during the testing effort. To capture feedback, the
team developed a standardized form that was distributed to utility participants midway through
the testing period.
elements used in defining some of the practice areas and performance measures. The team
considered the recommendations using several criteria including:
Consistency with research and feedback by the full project team throughout the
research project
Frequency (i.e., similar comments made by several utilities)
Applicability to multiple utility contexts (i.e., would the suggested revision decrease
the usability of the tool by some utilities)
Feasibility within the schedule/resource constraints of the current research project
Based on this review, a number of changes were made and are part of the tool delivered
in this project. These include:
The capability for utilities to edit the definition of the performance measures to meet
their specific contexts;
Addition of several performance measures; and
Revision of the definition of the scales for a number of performance measures.
A number of other potential modifications left for future revisions, such as the provision
for cross-utility comparisons, are described in Chapter 9, Conclusions and Recommendations.
Development of Recommendations
The team prepared the draft “Performance Benchmarking for Effectively Managed Water
Utilities” report that built on previous documentation and utility participant assessment results; it
then developed overall conclusions and recommendations. As part of the report development
process, the team conducted a PAC meeting where feedback was discussed and agreement
reached on changes to enhance the overall report so that it can create the desired value for
potential users.
CHAPTER 3:
LITERATURE REVIEW
INTRODUCTION
Reviewing existing EUM-related studies and other published documents was a critical
part of the project. The goals of the literature search were to:
Review, summarize, and extend the literature summaries developed to date on EUM,
and
Support development of practice areas and benchmarking metrics for those practices.
http://www.thewire.com/politics/2014/02/worlds-winter-olympic-sites-are-warming-and-we-have-graphs-prove-it/358067/
This chapter summarizes the literature review and overall findings. A table that includes
all of the literature reviewed is included in Appendix A. This review covers materials published
or presented through the summer of 2011; therefore, EUM and related materials published or
presented after that time are not included in this report.
SUMMARY OF LITERATURE REVIEW
The EPA, six sponsoring utility industry organizations, and a number of water sector
utilities performed considerable work to develop the Primer (EPA et al. 2008). Follow-on work
continued as additional documents were published. One document—Effective Water and
Wastewater Utility Management Case Studies (Columbus Water Works et al. 2009)—
summarizes case studies in the application of EUM principles. References to relevant documents
for each attribute and for EUM as a whole developed during these efforts have been posted to an
EPA-hosted web site (
www.watereum.org
). This site includes an interactive version of the
Primer. Other related research and activities, such as AWWA’s QualServe program (AWWA
1997), provided additional information that was considered in the execution of this research
project. To ensure that work conducted in this project built upon this existing body of identified
literature, a primary goal of this literature review was to review and summarize the key related
documents included in these past efforts.
The Ten Attributes of EUM identified in the Primer do not readily fit the requirements
for metric benchmarking, where clear quantitative metrics can be identified and benchmarked. A
number of the measures that would qualify as practice areas are qualitative in nature. Therefore,
the approach taken in this project dealt with qualitative metrics by using process or performance
benchmarking where each evaluation process focuses on capability with regard to the leading
on the development of practice areas, performance measures, and suggested methods for using
them to accomplish utility and industry goals.
Support Development of Practice Areas and Associated Benchmarking Metrics
Because this project was specifically tasked with establishing practice areas and ways to
measure them based on existing literature, input from participating utilities, and the experience
of the project team, a specific goal for the literature review was to identify practice areas and
candidates for performance measurements and scales identified in the existing literature. Some
practice areas for each of the Ten Attributes are identified in the Primer, as are potential
performance measurement areas. The literature review was intended to review and summarize
those elements and provide opportunities to refine, revise, and extend those elements through
material in other documents identified and reviewed by the project team. For example, because
performance scales that allow a utility to assign a score to actual performance compared with
target performance are needed to accomplish the benchmarking intended for this project, any
discussions in the literature related to development of such performance scales for identified
practice areas were identified and cited to the extent possible.
The team’s review of EUM-related documents and other reference materials identified no
literature gaps that would have prevented the team from meeting the objectives identified for this
research project.
Structure of the Literature Review
Details of the literature review can be found in Appendix A, which is organized as tables
for each of the Ten Attributes identified in the Primer. For each attribute, the literature review
table contains the following items:
Document Referenced: Document reviewed and, when available, a full citation of the
source.
Document Description: A brief description of document contents, when available.
Potential Leading Practice: Practices identified in the document, when available.
Metric (used to track effectiveness): Metrics identified in the document, when
available.
Utilities (using referenced Leading Practice): Any utilities referenced in the document
as implementing the practice. In most cases, the documents did not mention specific
utilities.
Table 3.1
EUM practice categories observed from the literature review
Attribute
Practice Categories
Product Quality (PQ)
Regulatory Compliance
Adherence to Guidelines
Customer Satisfaction (CS)
Customer Service
Billing and Payment
Customer Perception/Satisfaction
Customer Outreach
Customer Service Improvement Projects
Call Centers
Employee and Leadership Development (ED) Employee Recruitment, Retention, and Satisfaction
Succession Planning
Leadership
Training
Operational Optimization (OO)
Benchmarking
Operational Efficiency
Resource Optimization
Financial Viability (FV)
Financial Procedural Integrity
Maintenance of Strong Bond Rating
Budget Management Effectiveness
Rate Adequacy
Balance Debt and Equity Funding
Infrastructure Stability (IS)
Maintenance Management
Asset Reinvestment Planning
Risk Analysis
Asset Inventory
Levels of Service
Condition Assessment
Operational Resiliency (OR)
Risk and Vulnerability Assessments
Health and Safety of Employees
Business Continuity Planning
Emergency Preparedness and Response Planning
Community Sustainability (SU)
Watershed Health
Community Health
Green and Sustainable Infrastructure Planning
Greenhouse Gas Emissions
Climate Change
Service Affordability
Water Resource Adequacy (WA)
Water Supply Adequacy
CHAPTER 4:
SURVEY OF PARTICIPATING UTILITY PRACTICE AREAS AND
PERFORMANCE MEASURES
GOALS AND STRUCTURE OF CURRENT PRACTICE INFORMATION
This chapter summarizes the contributions from participating utilities to identify their
practice areas related to the Ten Attributes and associated performance measures. To develop the
draft benchmarking framework, the team used the following: (1) input from utilities
(summarized in this chapter), (2) the literature review (Chapter 3), and (3) the team’s own
experience in identifying practice areas and performance measures.
The participating utilities were listed previously in
Table 1.1
. Data requests were sent to
each participant early in the project. Participants were asked to identify practice areas and
metrics that they currently employ for each of the Ten Attributes. For practices currently in use,
participating utilities were asked to describe the practice and provide information about:
Depth of implementation of the practice (capability and execution).
Metrics used to track performance for the practice.
Supporting information related to the practice/measures, if applicable.
Comments deemed important by the utility representatives.
UTILITY SURVEY SUMMARY
Overall, the participating utilities identified an extensive group of practices and metrics
related to Effective Utility Management. In many cases, the participating utilities reported use of
practices and metrics similar to those reported by other utilities, but with slightly different names
or with variations in practice/usage.
Table 4.1
summarizes the practices for the Ten Attributes.
Table 4.1
Practice areas in use for each attribute by participating utilities
Attribute
Practice areas
Product Quality
Air quality
Wastewater treatment effectiveness/compliance
Drinking water quality/compliance
Biosolids beneficial use
Table 4.1 (Continued)
Practice areas in use for each attribute by participating utilities
Attribute
Practice areas
Product Quality (continued)
Preventative maintenance of the water distribution system
Enhance and protect the environment
Systematic process compliance (findings per internal audits)
Attribute
Practice areas
Customer Satisfaction
Understand overall customer satisfaction
Track complaints
Accurate meter reading and billing
Customer contact center efficiency and responsiveness
Service reliability
Use of social media
Employee and Leadership
Development
Succession planning
Leadership development
High performing workforce
Retain talent through employee satisfaction
Recruit talent
Operational Optimization
Energy optimization
Resource optimization: cost metrics
Resource optimization: human resources
Resource optimization: other
Financial Viability
Set appropriate balance between debt and equity funding for
capital program
Return on assets
Maintain adequate cash reserves, working capital, and margins
Maintain efficient operation and maintenance costs in relation to
customers and volume of sales
Maintain strong bond rating
Debt service coverage ratio
Recognize and support stockholder interest
Rate comparisons
Budget management effectiveness: capital budget
Budget management effectiveness: operating budget
Set rates and financial forecasts for a multi-year period
Minimize uncollected bills
Table 4.1 (Continued)
Practice areas in use for each attribute by participating utilities
Attribute
Practice areas
Infrastructure Stability
Capital program delivery
Rehabilitation and replacement rate
Planned maintenance effectiveness
Condition assessment/system integrity
Minimize water loss
Development and implementation of strategic asset
management plan
Risk management plan/program
Operational Resiliency
Reduce recordable incidents of work-related injury or illnesses
Maintain sufficient staffing levels
Emergency response readiness
Use of standard operating practices
Energy co-generation
Solid waste recycling/composting
Class A biosolids disposal
Risk management program
Community Sustainability
Promote customer service affordability
Implement environmental management system
Support community programs
Implement successful recycling and resource conservation programs
to support sustainability
Actively support employee and corporate participation in
establishing and supporting community goals
Manage greenhouse gas emissions to support environmental goals
Promote sustainability through capital improvement program
sustainability review
Promote energy efficiency
Support overall utility system efficiency
Support environmental stewardship
Water Resource Adequacy
Long-term water supply adequacy
Track current water demand
Reduce water consumption
Long-term ambient water quality
Minimize real water losses
Provide adequate capacity
participating utilities provided input on practice areas and metrics within the attributes, some
related topic areas appeared under different attributes. It is the opinion of the team that some
identified practices and metrics are likely best assigned to other attributes. Thus the team worked
with the PAC, project team members, and several participating utilities to align the practice areas
and associated measures to the appropriate attribute in the development of the framework as
described in Chapter 5.
UTILITY SURVEY CONCLUSIONS
The utilities provided several hundred measures overall. Most measures were reported in
the Operational Optimization attribute, and fewest were reported in the Stakeholder
Understanding and Support attribute. The distribution and count of measures are shown on
Figure 4.1
.
Figure 4.1 Distribution of reported practices
Participating utilities identified many practice areas and associated measures that were
54
52
73
116
62
71
43
34
33
12
0%
5%
10%
15%
20%
25%
CHAPTER 5:
DEVELOPMENT OF BENCHMARKING FRAMEWORK
INTRODUCTION
A primary goal of this project is to provide utilities the ability to conduct self-assessments
of the Ten Attributes identified in the Primer at a sufficiently detailed level to allow them to
identify priority areas for improvement and to chart a path forward to narrow identified gaps in
performance. To facilitate such self-assessments, a more detailed framework than that used in the
Primer was needed. The team developed an initial draft of the benchmarking framework based
on the findings of the literature review (Chapter 3), participating utility existing practices
(Chapter 4), and the experience and insights of the team members regarding the Ten Attributes.
The format and contents of the draft framework were vetted through several rounds of review
with the PAC, the six industry associations, the Phase 1 participating utilities, and the
Foundation.
After those reviews, the draft framework was embedded into the Excel-based
benchmarking tool developed for this project. The draft framework was then used as the basis for
testing during Phase 2, which is reported in Chapter 7. Based on feedback provided by
participating utilities, refinements were made to some practice areas and performance measures.
The version of the framework described in this chapter and embedded in Version 1.0 of the tool
that accompanies this report incorporates the refinements that were made in response to feedback
provided during the testing phase. This version number is used to differentiate it from future
updates that may be released by WRF.
As described in the remainder of this chapter, the primary organization for the framework
consists of practice areas defined within each of the Ten Attributes. Associated with each
practice area is one or more performance measures.
DEVELOPMENT OF PRACTICE AREAS
For each of the Ten Attributes, the team identified areas where a utility could undertake
activity to improve its performance. The term “practice areas,” rather than a more normative
term such as “best practices,” was deliberately selected because within these topic areas,
performance measures that reflect a range of performance are defined. In some cases, the high
end of defined performance did reflect industry practice areas. In other cases, particularly in
relatively new and emerging areas such as community sustainability, the definition of practice
areas for some measures is evolving or is in the process of being defined by the industry.
In most cases, the practice areas are framed as actions that a utility can undertake. For
example, for the Product Quality attribute, the team defined the three practice areas as follows:
few as two practice areas identified; some had as many as five. The practice areas identified for
each of the Ten Attributes are shown in the framework outline (
Figure 5.3
). Over time, as the
subject matter and technologies evolve in the water industry and as experience with
benchmarking processes evolve, the number and nature of practice areas within the Ten
Attributes may also evolve.
DEVELOPMENT OF PERFORMANCE MEASURES
Within each practice area, at least one performance measure was defined so that utilities
could track their progress in achieving performance goals in areas they define as high priority.
After consideration of several formats for tracking progress, a two-dimensional matrix was
selected. The selected format affords utilities the ability to track both the level of performance
achieved and the degree of implementation within their organizations for each performance
measure.
While many utilities track performance overall, adding ‘degree of implementation’
allows tracking of a second important dimension. The specific formulation of the degree of
implementation portion of the performance measure varies depending on the nature of the
performance measure. In some cases, this portion of the measure is used to address whether the
level of performance is achieved for only a portion of the organization or for only a limited time
in situations where long-term performance is needed to be successful. In other cases, it is used to
address whether the performance level has been achieved throughout the utility operations or
only by some functions or groups within the utility.
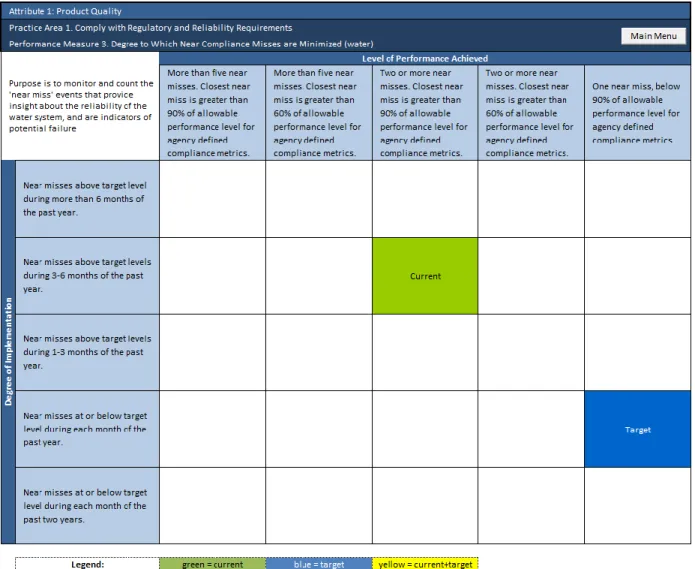
Figure 5.1
shows one of the performance measures for the Product Quality attribute. As
shown, utilities conduct a self-assessment rating, both at their current level of
performance/degree of implementation and at their target level of performance/degree of
implementation for each performance measure they include in their self-assessment.
Some of the performance measures, such as the one shown on
Figure 5.1
, are quantitative
in nature. Some of the performance measures, in light of the nature of the subject addressed
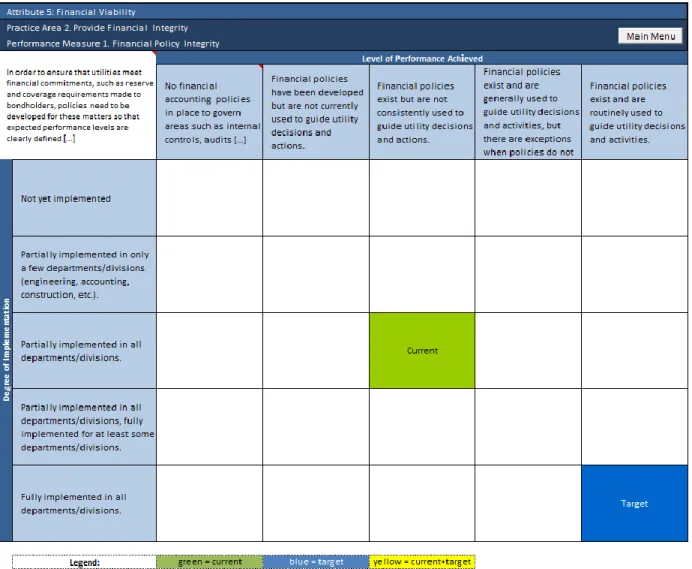
and/or the state of development of the topic in the water sector are more qualitative in nature.
Figure 5.2
shows one of the performance measures for the Financial Viability attribute, which is
defined in a more qualitative performance scale.
Figure 5.2 Example performance measure for financial viability
BENCHMARKING FRAMEWORK
Performance measures for all attributes and practice areas are embedded in the
benchmarking tool that accompanies this project report.
Figure 5.3
contains an outline that
iden-tifies all practice areas and performance measures that comprise the benchmarking framework
developed for this project.
1.
Product Quality1.1.
Comply with Regulatory and Reliability Requirements
1.1.1.Degree of Success in Achieving Target Drinking Water Compliance Rate (percent)
1.1.2.Degree of Success in Achieving Target Wastewater Treatment Effectiveness Rate (percent)
1.1.3.Degree to Which Near Compliance Misses are Minimized (water)
1.1.4.Degree to Which Near Compliance Misses are Minimized (wastewater)
1.1.5.Meet National and Other Applicable Objectives for Residuals Quantity and Quality
1.1.6.Extent to Which Supplemental Local Goals are Addressed
1.2.
Address Customer Needs
1.2.1.Achievement of Target Drinking Water Flow and Pressure (percent)
1.2.2.Achievement of Target Fire Suppression Flow and Pressure (percent)
1.2.3.Extent to Which Service Interruptions are Reduced to Target Levels (percent)
1.2.4.Extent to Which Sewer Backups are Reduced to Target Levels (percent)
1.2.5.Extent to Which Sanitary Sewer Overflows are Reduced to Target Levels
1.2.6.Extent to Which Combined Sewer Overflows are Reduced to Target Levels
1.2.7.Extent to Which Safe Drinking Water Act Secondary Standards are met
1.3.
Address Public Health and Ecological Needs
1.3.1.Achievement of Water Reuse Targets (percent)
1.3.2.Achievement of Beneficial Biosolids Usage Targets (percent)
2.
Customer Satisfaction2.1.
Minimize Customer Complaints
2.1.1.Extent to Which Customer Service Complaint Rates Fall within Target Levels
2.1.2.Extent to Which Technical Quality Complaint Rates Fall within Target Levels
2.2.
Achieve Target Level of Customer Service Delivery
2.2.1.Degree of Field Call Responsiveness (water)
2.2.2.Degree of Field Call Responsiveness (wastewater)
2.2.3.Degree to Which Error-driven Billing Adjustments Are Minimized
2.2.4.Degree to Which Service Start/Stop Responsiveness Falls Within Target Levels
2.2.5.Extent to Which Customer Issues are Resolved by Call Center/Customer Service at the time of the First Call
2.2.6.Degree to Which Customer Service Responsiveness Falls Within Target Levels
2.2.7.Degree of Abandoned Calls
2.3.
Receive Positive Customer Perceptions
2.3.1.Degree of Positive Customer Feedback Received
2.3.2.Perception of Effectiveness at Dispute Management and Resolution
2.4.
Efficiently Deliver Customer Service
2.4.1.Efficiency of Customer Service (Ratio of Cost/O&M Spending)
3.
Employee and Leadership Development3.1.
Recruit Appropriate Talent
3.1.1.Degree of Success in Implementing a Recruitment Strategy
3.1.2.Extent to Which Job Descriptions are Implemented
3.1.3.Adequacy of Interview and Selection Processes
3.2.
Retain Existing Talent
3.2.1.Degree of Implementation of Retention Management Plans