Federal Reserve Bank of New York
Staff Reports
Borrowing without Debt?
Understanding the U.S. International Investment Position
Matthew Higgins
Thomas Klitgaard
Cédric Tille
Staff Report no. 271
December 2006
This paper presents preliminary findings and is being distributed to economists and other interested readers solely to stimulate discussion and elicit comments. The views expressed in the paper are those of the authors and are not necessarily reflective of views at the Federal Reserve Bank of New York or the Federal Reserve System. Any errors or omissions are the responsibility of the authors.
Borrowing without Debt?
Understanding the U.S. International Investment Position
Matthew Higgins, Thomas Klitgaard, and Cédric Tille Federal Reserve Bank of New York Staff Reports, no. 271 December 2006
JEL classification: F32, F34, F36, F41
Abstract
Sustained large U.S. current account deficits have led some economists and
policymakers to worry that future current account adjustment could occur through a sudden and disruptive depreciation of the dollar and a sharp drop in U.S. consumption. Two factors that, to date, have cast doubt on such concerns are the stability of U.S. net external liabilities and the minimal net income payments made by the United States on these liabilities. We show that the stability of the external position reflects sizable capital gains stemming from strong foreign equity markets and a weaker dollar—conditions that could be reversed in the future. We also show that while minimal U.S. net income payments reflect a much higher measured rate of return on U.S. foreign direct
investment (FDI) assets than on U.S. FDI liabilities, ongoing borrowing is likely to overwhelm this favorable rate of return, pushing the U.S. net income balance more deeply into deficit.
In addition, we review the argument that the United States holds large amounts of intangible assets not captured in the data—assets that would bring the true U.S. net investment position close to balance. We argue that intangible capital, while a relevant dimension of economic analysis, is unlikely to be substantial enough to alter the U.S. net liability position.
Key words: current account deficit, valuation effect, intangible capital
Higgins: Federal Reserve Bank of New York (e-mail: matthew.higgins@ny.frb.org). Klitgaard: Federal Reserve Bank of New York (e-mail: tom.klitgaard@ny.frb.org). Tille: Federal Reserve Bank of New York (e-mail: cedric.tille@ny.frb.org). The views expressed in this paper are those of the authors and do not necessarily reflect the position of the Federal Reserve Bank of New York or the Federal Reserve System.
1. Introduction
Years of large current account deficits have left the United State with the world's largest net liability position. By the end of 2005, net foreign claims on the U.S. amounted to $2.5 trillion, more than 20 percent of U.S. GDP. Moreover, the U.S. current account deficit continues to climb higher, both in dollar terms and as a share of U.S. GDP. In 2006, according to the IMF, the U.S. deficit is likely to reach almost $870 billion, some 6.6 percent of GDP, and up from 4.8 percent of in 2003 and just 3.8 percent of GDP as recently as 2001.
Theses trends raise worries about the sustainability of the U.S. external position. After all, continued large current account deficits should result in a growing net international liability position, and growing payments on those liabilities. It's no surprise, then, that the clear consensus among policymakers and economists is that the U.S. current account deficit will eventually need to narrow, as a percentage of GDP if not in dollar
terms.1 And some argue that the U.S. faces a growing risk that current account
adjustment will be sudden and disruptive, with potential consequences of a sharply
weaker dollar and a contraction in U.S. consumption.2
However, other features of the data don't quite square with this disquieting view. First, the value of U.S. net external liabilities has been rising less rapidly in recent years than the amount of net financial inflows represented by the country's current account
deficit.3 Indeed, from the end of 2001 to the end of 2005, U.S. net liabilities rose by little
more than $200 billion, despite cumulative current account deficits of more than $2,400 billion over the period. With the U.S. economy growing, this has meant a decline in U.S. net liabilities as a percentage of GDP. Second, the U.S. now bears only a minimal servicing burden on its net liability position. Indeed, the $3.4 billion in net payments the U.S. made during the first half of 2006 implies a servicing cost of less than 0.3 percent (annualized) on net liabilities. In previous years, the net income balance was positive.
Why have large, ongoing current account deficits recently failed to translate into a sizeable buildup in U.S. net liabilities? And how has the U.S. managed to make such small service payments on its large net debt position? Do these facts imply that the U.S. could continue to run large current accounts deficits indefinitely without facing significant economic consequences?
To start answering these questions, it important to understand that increases in the dollar value of U.S. foreign assets, due to asset prices changes and a weaker dollar have moderated the decline in U.S. net liabilities in recent years. The risk is that United States cannot continue to count on future capital gains offset large net financial inflows into the
1 See for instance Clarida (2006), Faruqee et al. (2006), Obstfeld and Rogoff (2006). 2 Roubini and Setser (2006).
3 Some foreign assets and liabilities, notably corporate equities and foreign direct investment, confer
claims on future profits rather than to a stream of interest and principal repayments, and thus fall outside of the usual definition of debt. For convenience, however, we sometimes refer to debt and borrowing rather than the more cumbersome terms, net liabilities or net liability incurrence.
United States. In particular, asset price movements can easily move in the opposite direction and increase rather than decrease U.S. net liabilities.
A second development that has worked to the advantage of the United States is that it makes minimal net payments on its net liabilities because the United States earns a
substantially higher rate of return on foreign assets than it pays out on foreign liabilities.4
Some analysts have cited this higher rate of return as evidence that U.S. foreign assets are higher than reported in the official data, reflecting unmeasured holdings of intangible capital in the form of specialized knowledge, management expertise, and brand name
value (so called "dark matter" assets).5 However, even generous assumptions as to the
scale of intangible foreign assets would still leave the U.S. with a sizeable net foreign liability position. More important for current account adjustment, however, the scale of such intangible assets turns out to have no material implications for future net payments to the rest of the world. In particular, large ongoing current account deficits will steadily increase U.S. net payment over time.
Our analysis does not settle whether U.S. current account adjustment will be gradual and benign, as the consensus now expects, or sudden and disruptive, as others argue. It does indicate that any eventual adjustment will be made more difficult by a growing net income deficit. The paper is structured as follows: section 2 documents the role of capital gains in driving the U.S. international position, showing the increasing sensitivity of the U.S. position to movements in international asset prices. The role of intangible assets in the external position is discussed in section 3, and section 4 concludes.
2. Valuation Effects: Financial Flows vs. Capital Gains
As an accounting identity, the U.S. current account deficit is equal to the shortfall of domestic saving relative to investment spending. In essence, the United States finances the shortfall by borrowing surplus saving from the rest of the world. Such borrowing, of course, leaves foreign investors with financial claims on the United States, whether in the form of increased holdings of U.S. government, agency or corporate debt securities; U.S. corporate equities; direct ownership of U.S. companies; or increased banking claims on U.S. households and firms.
Over time, ongoing borrowing should translate into growing external liabilities. As already noted, however, the value of U.S. net liabilities has recently risen far less rapidly than the ongoing flow of new borrowing. While the U.S. net investment position has become increasingly negative since 1982, reaching $2.5 trillion at the end of 2005 (Chart 1, solid line), it deteriorated by a mere $207 billion from the end of 2001 to the end of 2005. This stability is striking as the U.S. accumulated $2,409 billion worth of additional liabilities to foreign investor over the period, and one would have expected the
4
Gourinchas and Rey (2006).
U.S. net debt to surge as a result (Chart 1, dotted line).6 Moreover, GDP growth led U.S. net international liabilities to actually decline as a share of GDP, from 23.1 percent in 2001 to 20.4 percent in 2005.
The large role of valuation effects
The first step in understanding the puzzling stability of the U.S. external position is to go beyond the numbers in net terms, to consider U.S. gross external assets and liabilities. A look at the gross figures reveals that both sides of the U.S. international balance sheet have been rising rapidly. At the end of 2005, the value of U.S. assets held abroad amounted to $11.1 trillion, 89 percent of U.S. GDP (Chart 2, dotted line). The value of foreign assets in the U.S. came to $13.6 trillion, some 109 percent of GDP (solid line). The gap between U.S. foreign assets and liabilities, of course, gives the U.S. net external position, with net liabilities at $2.5 trillion. Understanding the behavior of the U.S. net positions requires looking at the large—and largely offsetting—gross positions.
In particular, capital gains and losses on either side of the U.S. external balance sheet can have a substantial impact on the U.S. net position, quite apart from the behavior of the current account deficit. For example, a boom in U.S. stock prices boosts the value of foreign investors’ claims on U.S. companies. The resulting increase in U.S. gross
liabilities translate one-for-one into a deterioration of the U.S. net investment position.7
Notably, the potential impact of capital gains and losses on the U.S. net position rises with the scale of gross assets and liabilities. A given percentage change in U.S. stock prices, for example, has a larger impact on the U.S. net position the higher are foreign holdings of U.S. equities.
Data compiled by the Bureau of Economic Analysis (Nguyen 2006) break down the changes in the U.S. net position into four channels, including three distinct valuation effects (Chart 3, the solid line showing the change in the overall net position, with negative values indicating in increase in net indebtedness.) The four channels are as follows.
- Financial flows (grey bars). Current account deficits represent new borrowing
from foreign investors, increasing net liabilities. Not surprisingly, the buildup in liabilities via this channel has been substantial.
- Exchange rate valuation (black bars). While U.S. foreign liabilities are almost
entirely in dollars, roughly two-thirds of U.S. foreign assets are denominated in foreign currencies, most notably FDI and equity holdings (Tille 2005). A weaker dollar directly boosts the dollar value of U.S. assets denominated in foreign
6
While net financial flows are conceptually equal to the current account, $2,409 billion of net inflows differ from the $2,456 billion current account deficit over the period due to statistical discrepancies in the balance of payments.
7 This example makes clear that asset price changes that lead to a deterioration in the U.S. net investment
position might well have positive welfare implications. Because the bulk of the U.S. equity market is held by U.S. investors, a boom in U.S. equity prices would lead to an increase in overall U.S. wealth, alongside the increase in U.S. foreign liabilities.
currencies, generating a capital gain for the U.S. This channel has recently been sizeable, generating large capital gains during 2002-2004 when the dollar was weakening. Dollar strength in 2005 reversed some of these gains.
- Asset price valuation (white bars). Movements in asset prices affect the value of
gross assets and liabilities. A pickup in foreign equity prices boosts the value of U.S. holdings, while a pickup in U.S. equity prices raises the value of U.S.
liabilities.8 Because U.S. and foreign equity prices tend to move together, there
has generally been little impact on the U.S. net investment position via this channel. A notable exception occurred in 2005 when stock markets in Europe and Asia far outperformed markets in the United States, generating a large capital gain for U.S. investors.
- Other valuation effects (striped bars). The data sources underlying the BEA's
computations are regularly improved and revised, leading to adjustment in the data. Since not all of these adjustments can be assigned the three channels discussed above, the residual is included under this category.
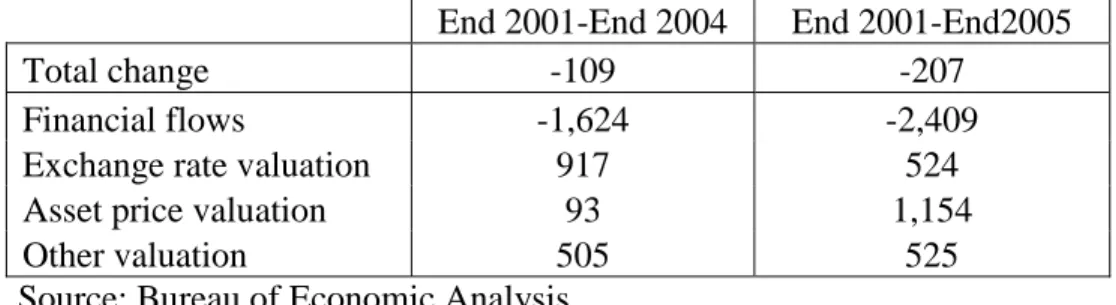
All three valuation channels have made positive contributions to the U.S. external position in recent years (Table 1). As already noted, the stability of the net position since the end of 2001 occurred despite $2.4 trillion worth of additional borrowing. Asset price changes have provided a sizable offset of almost $1.2 trillion, reflecting mostly the strong performance of foreign stock markets in 2005. The contribution from exchange rate changes and other valuation effects has been roughly equal, at just over $0.5 trillion. The role of the exchange rate was larger from the end of 2001 until the end of 2004, when the depreciation of the dollar led to a capital gain of $0.9 trillion. The appreciation of the dollar in 2005 partially offset that gain. All told, valuation effects have been enough to largely offset sizable net financial inflows from running current account deficits over the period.
The importance of the valuation effects described above is not limited to recent years in the United States. Lane and Milesi-Ferretti (2006) document large valuation effects for wide range of countries. Gourinchas and Rey (2005) show that valuation effects have had a sizeable impact on the U.S. external position going back more than a decade, if generally not quite so sizeable as in recent years.
The “other” valuation category was a sizable source of valuation changes in recent years, leading us to ask whether they represent a systematic problem in the official data. A closer look shows that this is not the case, as we can discern no steady, consistent pattern over time, or across assets and liabilities. Of the roughly $1.2 trillion in capital gains under this category from 1989 to 2005 (Table 2), half ($575 billion) came in just three years: 1993, 2002 and 2003. While the gains in 1993 and 2002 reflected a revaluation of assets, the gain in 2003 was driven by a re-assessment of liabilities. Of
8
Changes in equity prices affect the value of both portfolio equity holdings and foreign direct investment. In particular, the BEA relies on changes in foreign stock prices to estimate capital gains on U.S. FDI abroad, and changes in U.S. equity prices to estimate capital gains on foreign FDI in the U.S.
course, it is impossible to predict how future changes in BEA sources and methods might affect the measured U.S. external position. That said, the recent introduction of annual, from the earlier quadrennial, investors surveys of U.S. portfolio assets and liabilities may mean that future revisions may be smaller than they have sometimes been in the past.
Valuation and adjustment
The large positive impact on the U.S. external position from asset price and exchange rate movements in recent years is likely to help the U.S. external adjustment, but does not constitute a silver bullet.
Several economists have argued that a depreciation of the dollar will be a central component in a narrowing of the U.S. current account deficit. Such an exchange rate movement makes both traded and non-traded U.S. goods cheaper than imports, leading U.S. consumer to shift their purchases away from foreign goods and lower the trade deficit. The impact of the exchange rate through this standard channel is completed by its direct impact on the value of U.S. foreign assets. It is important to realize nonetheless that the latter valuation effect acts as a complement to the usual channel through the trade balance. In particular, the valuation effect hinges on a sizable movement in the exchange rate.
This complementarity is highlighted in recent work on adjustment scenarions for the U.S. current account. Cavallo and Tille (2006) describe adjustment scenarios in which a weaker dollar brings the U.S. current account into balance via the trade channel while, at the same time, keeping U.S. net liabilities constant through valuation effects. The key finding is that the valuation effects allow for more gradual and smooth dollar depreciation. However, while the valuation effects help, they do not remove the need for a sizable dollar depreciation to narrow the current account deficit. Similarly, Gourinchas and Rey (2005) do an exercise on how a weaker dollar can stabilize the U.S. net liability position. They find that one-third of the stabilization would come from exchange rate valuation effects and about two-thirds would come from a narrowing of the current account deficit through the trade channel.
While movements in asset prices and exchange rate have helped the U.S. in recent years, it remains unclear that the U.S. can count on them on a sustained basis. As already noted, the large factor minimizing the deterioration in net liabilities in 2005 was the much stronger performance of foreign equity prices relative to U.S. equity prices. Historically, however, changes in U.S. and foreign stock prices have been highly correlated so that the equal impact on the value of U.S. assets and liabilities meant that there was imprint on
the U.S. net position (Chart 4).9 Indeed, asset price changes during 1989 through 2004
actually imposed a small cumulative drag on the U.S. external position, at -$113 billion, before the mammoth $1,061 positive contribution recorded in 2005. The historical pattern is likely to reassert itself so that future asset price changes with little sustained impact on
9
Recall that the estimated values of U.S. equity and FDI assets and liabilities are linked, respectively, to foreign and U.S. stock prices.
the evolution of the U.S. external position. It appears highly unlikely that a sustained out-performance in foreign equity markets could offset ongoing current account deficits.
On the exchange rate side, a weaker dollar also helps stabilize U.S. net liabilities, but the sustainability of this mechanism remains unclear. In particular, the dollar could stabilize (ending valuation gains) or appreciate (reversing past gains). More importantly, the valuation gains from a dollar depreciation reflect a puzzling feature of foreign investors who have sustained sizable capital losses for the last four years, without asking for an offset through higher return on their holding of dollar assets. If ongoing dollar depreciation gets built into market expectations, foreign investors could demand compensation in the form of higher income payments, leading to higher income payments that add to the current account deficit.
The U.S. external position: growing sensitivity to valuation effects
While the overall U.S. net position has remained steady in recent years, there have been substantial changes in its composition (Table 3). Since the end of 2001, U.S. net
assets in FDI and equity shows a sizable increase, at $1.8 trillion, stemming nearly
exclusively from valuation changes, as these assets are in foreign currencies. By contrast, U.S. net liabilities in other categories, mostly debt instruments, show a sizeable increase, at $2.0 trillion, driven by fresh borrowing with little role for valuation effects. This pattern resulted in a leveraging of the U.S. international position between net FDI and equity assets, now at 13.6 percent of GDP, and net liabilities in debt securities and other categories, now at 34.1 percent of GDP.
The buildup in U.S. international assets and liabilities has worked to increase the sensitivity of the U.S. position to exchange rate and asset price changes (Table 4). A 10 percent depreciation of the dollar against all currencies would lead to a valuation gain for the U.S. of roughly 5 percent of GDP, nearly twice the gain that would have resulted a decade ago. A 10 percent increase in foreign equity prices would add 2.5 percent of GDP to the U.S. net position, while a similar increase in foreign bond prices would have a smaller effect. On the liability side, a 10 percent rise in U.S. equity prices would generate a capital loss of 1.7 percent of GDP. A similar increase in bond prices would have a larger effect, reducing the U.S. net position by 3.4 percent of GDP, reflecting the heavy weight of debt securities in U.S. liabilities. These effects are broadly twice as large as they would have been in 1995, and four times as in 1985. Growing international balance sheets have also increased the exposure of other countries' balance sheets to exchange rate and asset price movements, as documented in Warnock (2006).
3. The Surprising U.S. Net Income Balance: Does it Reflect "Dark Matter" Assets?
Despite having a negative international position of $2.5 trillion, the U.S. paid out only $3.4 billion in net income payments to foreign investors during the first half of 2006. This translates into payments on net international liabilities at only a 0.3 percent annual rate. In effect, the U.S. has been able to become a significant net debtor practically
for free! And U.S. net investment income balance was actually in positive territory prior to this year.
The future evolution of the U.S. net income balance has important implications for U.S. current account adjustment. The current account balance is equal to the sum of three components: the trade balance, the net income balance, and net international transfers (mostly workers' remittances and foreign add). If ongoing current account deficits lead to higher net liabilities and higher income service payments, the trade deficit would need continuously to narrow—merely to prevent the current account deficit from rising further.
Why is the U.S. net income deficit so small, and why was the net income balance in surplus until recently? This surprising state of affairs reflects the fact that the U.S. has earned a higher rate of return on its large stock of international assets than it has paid out on its even larger stock of international liabilities. Indeed, the $293 billion that the U.S. earned on foreign assets during the first half of 2006, on a base of $11.1 trillion, translates into an annual rate of return of 5.3 percent. The $296 billion that the U.S. paid out foreign liabilities, on a base of $13.6 trillion, translates into an annualized rate of return of 4.3 percent. This gap in rates of return was enough to keep the U.S. net income
balance close to zero.10
A closer look at the data reveals that the U.S. rate of return advantage lies entirely in FDI (Chart 5). Indeed, the rate of return on U.S. FDI assets abroad came to 8.0 percent during the first half of 2006 (top panel, solid line), vs. a rate of return on foreign FDI assets in the U.S. of just 5.1 percent (dotted line). A persistent U.S. earnings advantage is also evident in earlier years. In contrast, rates of return on other U.S. international assets and liabilities (bottom panel) were about the same during the first half of 2006, a pattern that has held historically.
Could "dark matter" eliminate the need for U.S. current account adjustment?
Hausmann and Sturzenegger (2006) cite the higher rate of return on U.S. foreign assets as evidence that these assets are higher than counted in the official data, especially for FDI. On this view, the official data miss intangible U.S. assets in the form specialized knowledge, management expertise, and brand name value—assets the authors’ term "dark matter." If the value of U.S. FDI assets were calculated instead by capitalizing the value of the profit streams they generate, the authors argue, the U.S. net liability position would disappear and the U.S. faces much less pressure for the current account deficit to narrow.
Considering the notion of intangible capital makes sense, despite the obvious difficulties in valuing such items as knowledge and brand name. After all, standard economic theory treats investment as any current cost incurred to yield a future income stream. One point, though, should be clear. How U.S. foreign assets are valued has no implications for the income flows associated with them. If we conclude that U.S. FDI
assets are "really" worth $6 trillion rather than the reported $3.5 trillion, we must also conclude that the rate of return on U.S. FDI has "really" been 4.7 percent rather than 8.0 percent. The same point holds for future FDI investments and income flows. If we believe that DubaiDisney, although requiring an initial investment of only $1 billion, actually generates a business line worth $2 billion, than it may make sense to value it at $2 billion. But future income receipts will be the same; the measured rate of return on Dubai Disney will simply be half as high as if it had been valued it at $1 billion.
Since the dark matter hypothesis sheds no light on current or future investment income flows, it has no substantive implications for the evolution of U.S. and global imbalances. Only asset reappraisals actually due to changes in expected future income receipts would carry such implications. Nor can the United States count on further leveraging its FDI position to keep large, ongoing current account deficits from translating into a deteriorating net income balance. Suppose, for example, that the current account deficit holds steady at 6.5 percent of GDP, close to its current level. Suppose also that U.S. borrowing exceeds the current account deficit in order to finance additional outbound FDI. In particular, suppose that U.S. parents can borrow at 4 percent, but earn a rate of return of 8 percent. Simple arithmetic shows that the outbound FDI would have to climb to nearly 6.5 percent of GDP (roughly $850 billion today) each year to keep the
net income balance stable.11
The reality is that outbound FDI has averaged 1.3 percent of GDP since 1990, with a top value of 2.4 percent of GDP in 1999. In addition, it is doubtful that recent high returns on U.S. FDI could be maintained were the pace of new FDI investments ramped
up dramatically.12
How much foreign intangible capital might the U.S. have?
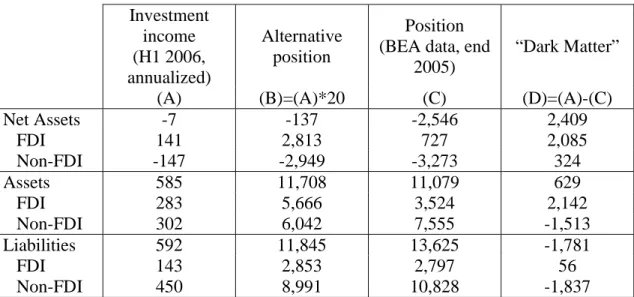
Hausmann and Sturzenneger (2006) propose to value the U.S. net investment position by applying a 5 percent discount factor to the U.S. net investment income stream. Using the investment income flows recorded over the first two quarters of 2006 (Table 5, column A), the method indicates that the U.S. now carries net liabilities of only $137 billion (Table 5, column B, first row). Comparing this to the official data (Table 5 column C) shows that net liabilities are about $2.4 trillion less (Table 5 column D) under the alternative measure than reported in the official data. As a result, the authors would conclude, the United States must own some $2.4 trillion in unmeasured intangible assets. Nearly $2.1 trillion of this discrepancy is accounted for by FDI net assets.
11 Specifically, the net income in year t is: NI(t) = rA * A(t) – rL * L(t), where rA and rL are the rates of
return on assets and liabilities, which we hold at 8 and 4 percent, and A(t) and L(t) are the asset and liability positions in year t. For the net income to remain constant between year t and t+1, we require that 8% * A(t+1) – 4% * L(t+1) = 8% * A(t) – 4% * L(t), which can be rewritten as: 8% * [A(t+1)-A(t)] = 4% * [L(t+1)-L(t)]. The current account deficit implies a larger increase for liabilities than for assets between the two years. With a current account deficit of 6.5 percent of GDP, this implies: [L(t+1)-L(t)]=6.5+[A(t+1)-A(t)]. Putting everything together, we get 8% * [A(t+1)-A(t)] = 4% * 6.5+4% * [A(t+1)-A(t)], that is A(t+1)-A(t) = 6.5 percent of GDP.
Of course, this valuation method should be equally valid for valuing gross U.S. assets and liabilities by asset category. Focusing on U.S. assets (Table 5 middle panel) show that the United States indeed has unmeasured intangible FDI assets, to the tune of $2.1 trillion. However, other U.S. assets would now be worth $1.5 trillion less than reported in the official data (Call it "dark antimatter"). As a result, total U.S. dark matter assets come to just $0.6 trillion. What then account for the $2.4 trillion figure cited above for net assets? It simply reflects that reflects that applying a 5 percent discount factor to U.S. income payouts implies that U.S. liabilities (Table 5 bottom panel) are worth $1.8 trillion less than reflected in the official data, with this gap lying entirely outside FDI.
It would seem that this valuation procedure implies a large valuation shortfall, relative to the official data, for non-FDI assets and liabilities. This casts substantial doubt on the procedure used. After all, non-FDI assets should be relatively straightforward to value. As the BEA notes in the latest U.S. International Investment Position report:
Virtually all the categories in the international investment position accounts except direct investment positions can be directly estimated with reference to readily observable market prices. For example, the value of positions in portfolio investment securities, gold, loans, currencies, and bank deposits can be directly estimated based on face values or market prices of recent transactions.
As a result, we can see little reason to think that official estimates of U.S. non-FDI assets and liabilities might be seriously amiss. Instead, the large gap outside FDI are likely to reflect the low level of interest rates in recent years, as seen in the bottom panel of Chart 5. Low interest rates automatically reduce the interest streams on the positions in debt instruments (bonds and banking positions). By applying a constant 5 percent discount rate, the method described above wrongly infers that the positions themselves have fallen. Valuing FDI assets and liabilities involves greater complexities, as Hausmann and Sturzenegger (2006) rightly emphasize. The IIP report continues:
Direct investment positions typically involve illiquid ownership investments in
companies that may possess many unique attributes─such as customer base,
management, and ownership of intangible assets─whose value in the current
period may be difficult to determine, because there is no widely accepted standard for revaluing company financial statements at historical cost prices into prices in the current period.
While the discussion above casts doubt on Hausmann and Sturzenegger's (2006) approach to measuring the U.S. net investment position, this does not mean that intangible assets are unimportant. Recent research for the U.S. finds that intangible capital is indeed an sizable and growing component of the U.S. capital stock. Corrado, Hulten and Sichel (2006) estimate that investment in intangible capital is now 1.4 times as large as the investment in tangible capital; only the latter is captured in the national
accounts statistics. They estimate a stock of intangible assets of $3.6 trillion in 2003,
representing one-third of the value of private non-residential fixed assets.13
Using these results, we can compute an estimate of the holdings of FDI including intangible capital. We multiply the assets and liabilities in FDI in 2005 by an adjustment factor to capture intangible assets, and leave all the non-FDI positions as in the reported data. Table 6 shows the results for several values of the adjustment factors.
The official data correspond to an adjustment of zero on FDI holdings (column A). Increasing the FDI holdings by 30 percent (column B), in line with the estimates of Corrado, Hulten and Sichel (2006) improves the net international investment position, as the U.S. holds more FDI assets than liabilities. The impact is moderate, however, with an improvement by 1.8 percent of GDP. Doubling the FDI holdings (column C) improves the net international position further, but even such a large adjustment improves the position by just 5.8 percent of GDP, leaving a net debt of 14.6 percent of GDP.
The impact on the net position can be sizable only if we consider a larger adjustment factor for FDI assets than for liabilities. For example, increasing FDI assets by 30 percent while leaving FDI liabilities unchanged improves the net position by 8.5 percent of GDP (column D). Notably, however, applying such an asymmetric adjustment factor requires making a question assumption that foreign FDI in fundamental different in nature to U.S. FDI.
The point of this analysis is that adjusting for intangible assets would likely not have a meaningful impact on the U.S. net position. While the approach taken here is stylized, it shows that intangible assets could play a sizable role only if they are substantially more relevant for FDI assets than liabilities. While a definitive assessment of this possibility would require much further research, such a discrepancy with foreign firms bringing much less skills and brand assets into the U.S. than U.S. firms bring abroad seems unlikely.
4. Conclusion
The relative stability of the U.S. external position in recent years would seem to undermine worries about the sustainability of continued large current account deficits. The small minimal income payments on its large measured net debt position would also seem to undermine those worries.
The small recent increase in U.S. net indebtedness owes to capital gains on U.S. foreign assets, both from higher equity prices abroad and the depreciation of the dollar since 2001. Addition valuation changes from a weaker dollar or increases in foreign asset prices are possible, reducing pressure on the current account deficit to narrow. The risks are that these favorable valuation changes stop or are reversed.
13
While investment in intangible capital is 1.4 times as large as in tangible capital, this high value is relatively recent and intangible capital has a faster rate of depreciation. As a result, the estimated stock of intangible capital is only one-third the stock of tangible capital.
The pressure for current account adjustment has also been eased by minimal U.S. income payments due to a higher measure rate of return on U.S. FDI assets than FDI liabilities. On present trends, however, ongoing net borrowing will drag the U.S. net income balance steadily into significant deficit, adding to current account adjustment pressures.
Some authors have pointed to the higher rate of return on U.S. FDI assets as evidence that the U.S. holds large amounts of intangible assets not captured in the data. On this view, the U.S. net investment position close to balance, eliminating any pressing need for current account adjustment. According to our analysis, however, plausible estimates for U.S. intangible capital imply only a small reduction in U.S. net external liabilities.
References
Buiter, Willem, 2006, Dark Matter or Cold Fusion?, Goldman Sachs Global Economics Paper 136.
Clarida, Richard (Ed.), 2006, G7 Current Account Imbalances: Sustainability and Adjustment, University of Chicago Press, Chicago.
Cavallo, Michele, and Cédric Tille, 2006, Current Account Adjustment with High Financial Integration: A Scenario Analysis, Federal Reserve Bank of San Francisco
Economic Review, March 2006, pp. 31-46.
Corrado, Carol, Charles Hulten, and Daniel Sichel, 2006, Intangible Capital and Economic Growth, National Bureau of Economic Research Working paper 11948.
Faruqee, Hamid, Doug Laxton, Dirk Muir, and Paolo Pesenti, 2006, Smooth Landing or Crash? Model-Based Scenarios of Global Current Account Rebalancing, in Clarida, R.H. (Ed.), G-7 Current Account Imbalances: Sustainability and Adjustment. University of Chicago Press, Chicago.
Gourinchas, Pierre-Olivier, and Hélène Rey, 2005, International Financial Adjustment,
National Bureau of Economic Analysis Working Paper no. 11155.
Hausmann, Ricardo, and Federico Sturzenegger, 2006, Global Imbalances or Bad Accounting? The Missing Dark Matter in the Wealth of Nations, Center for International
Development at Harvard University working paper 124.
Higgins, Matthew, Thomas Klitgaard and Cédric Tille, 2005, The Income Implications of Rising U.S. International Liabilities, Current Issues in Economics and Finance 11, no. 12, Federal Reserve Bank of New York.
Lane, Philip, and Gian-Maria Milesi-Ferretti, 2006, A Global Perspective on External Positions, in Clarida, R.H. (Ed.), G-7 Current Account Imbalances: Sustainability and Adjustment. University of Chicago Press, Chicago.
Nguyen, Elena, 2006, The International Investment Position of the United States at Yearend 2005, Bureau of Economic Analysis, Survey of Current Business, July 2006, pp. 9-19.
Obstfeld, Maurice, and Kennneth Rogoff, 2006, The Unsustainable U.S. Current Account Position Revisited, in Clarida, R.H. (Ed.), G-7 Current Account Imbalances: Sustainability and Adjustment, University of Chicago Press, Chicago.
Roubini, Nouriel and Brad Setser, 2006, The U.S. as a Net Debtor: The Sustainability of U.S. External Imbalances. Mimeo, Stern School o f Business, New York University. Tille, Cédric, 2005, Financial Integration and the Wealth Effect of Exchange Rate Fluctuations, Federal Reserve Bank of New York Staff Report no. 226.
Warnock, Francis, 2006, How Might a Disorderly Resolution of Global Imbalances affect Global Wealth?, International Monetary Fund Working Paper no. 06/170.
Table 1: Source of changes in the Net international investment position $ billions
End 2001-End 2004 End 2001-End2005
Total change -109 -207
Financial flows -1,624 -2,409
Exchange rate valuation 917 524
Asset price valuation 93 1,154
Other valuation 505 525
Source: Bureau of Economic Analysis
Table 2: Breakdown of ‘other’ valuation changes $ billions
Year 1993 2002 2003 Total All other
Net position 119 217 240 575 597
Assets 98 197 -36
Liabilities -21 -20 -275 Source: Bureau of Economic Analysis
Table 3: Changes in U.S. Net International Position (end 2001 to end 2005, $U.S. billions)
Total FDI and equity Other
Change in position -207 1,809 -2,016 Valuation change 2,203 1,517 686 Financial flows -2,409 292 -2,702 Position end 2005 (percent of GDP) -20.4 13.6 -34.1 Source: Bureau of Economic Analysis
Table 4: Impact of Exchange Rate and Asset Prices on U.S. Net International Position (change in the net position, percent of GDP)
Based on positions in 1985 1995 2005
10 % dollar depreciation 1.0 2.9 5.3
10 % increase in foreign equity prices 0.1 1.1 2.5
10 % increase in foreign bond prices 0.2 0.6 0.8
10 % increase in US equity prices -0.3 -0.7 -1.7
10 % increase in US bond prices -0.7 -1.7 -3.4
Table 5: Official and alternative measures of assets and liabilities $ billion Investment income (H1 2006, annualized) Alternative position Position (BEA data, end
2005)
“Dark Matter”
(A) (B)=(A)*20 (C) (D)=(A)-(C)
Net Assets -7 -137 -2,546 2,409 FDI 141 2,813 727 2,085 Non-FDI -147 -2,949 -3,273 324 Assets 585 11,708 11,079 629 FDI 283 5,666 3,524 2,142 Non-FDI 302 6,042 7,555 -1,513 Liabilities 592 11,845 13,625 -1,781 FDI 143 2,853 2,797 56 Non-FDI 450 8,991 10,828 -1,837
Source: BEA and authors’ calculations.
Table 6: Net International Position with Intangible FDI Holdings
FDI holdings with intangibles = FDI holdings from BEA * (1 + adjustment factor)
(A) (B) (C) (D)
Adjustment factor for FDI assets 0 0.3 1.0 0.3
Adjustment factor for FDI liabilities 0 0.3 1.0 0.0
Net international position (% of GDP) -20.4 -18.6 -14.6 -11.9
Chart 1: Net international investment position
End of year, $ billion
-5,000 -4,000 -3,000 -2,000 -1,000 0 1,000 1982 1984 1986 1988 1990 1992 1994 1996 1998 2000 2002 2004
Actual position Cumulative financial flows from end-2001
Chart 2: Gross assets and liabilites
End of year, $ billion
0 2,000 4,000 6,000 8,000 10,000 12,000 14,000 1982 1984 1986 1988 1990 1992 1994 1996 1998 2000 2002 2004
Chart 3: Drivers of the net position percent of GDP -10% -8% -6% -4% -2% 0% 2% 4% 6% 8% 10% 1990 1992 1994 1996 1998 2000 2002 2004
Financial flows Exchange rate valuation Asset price valuation
Other valuation Change in the net position
Chart 4: Asset price valuation: gross assets and liabilites
$ billion -1,000 -800 -600 -400 -200 0 200 400 600 800 1,000 1989 1990 1991 1992 1993 1994 1995 1996 1997 1998 1999 2000 2001 2002 2003 2004 2005
Gross assets Gross liabilities
Correlation: 1989-2004 : 0.93 1989-2005 : 0.79
Chart 5: Rates of return
return on US assets return on US liabilities
Returns for year t are the receipts on assets and payments on liabilities in year t, divided by the corresponding positions at the end of year t-1
Returns for 2006 are based on receipts and payments in the first two quarters
Foreign direct investment
-2% 0% 2% 4% 6% 8% 10% 12% 1982 1986 1990 1994 1998 2002 2006 Non-FDI -2% 0% 2% 4% 6% 8% 10% 12% 1982 1986 1990 1994 1998 2002 2006