Oracle® TimesTen In-Memory Database
Troubleshooting Guide
11
g
Release 2 (11.2.2)
E21636-06Oracle TimesTen In-Memory Database Troubleshooting Guide, 11g Release 2 (11.2.2) E21636-06
Copyright © 2011, 2012, Oracle and/or its affiliates. All rights reserved.
This software and related documentation are provided under a license agreement containing restrictions on use and disclosure and are protected by intellectual property laws. Except as expressly permitted in your license agreement or allowed by law, you may not use, copy, reproduce, translate, broadcast, modify, license, transmit, distribute, exhibit, perform, publish, or display any part, in any form, or by any means. Reverse engineering, disassembly, or decompilation of this software, unless required by law for interoperability, is prohibited.
The information contained herein is subject to change without notice and is not warranted to be error-free. If you find any errors, please report them to us in writing.
If this is software or related documentation that is delivered to the U.S. Government or anyone licensing it on behalf of the U.S. Government, the following notice is applicable:
U.S. GOVERNMENT END USERS: Oracle programs, including any operating system, integrated software, any programs installed on the hardware, and/or documentation, delivered to U.S. Government end users are "commercial computer software" pursuant to the applicable Federal Acquisition Regulation and agency-specific supplemental regulations. As such, use, duplication, disclosure, modification, and
adaptation of the programs, including any operating system, integrated software, any programs installed on the hardware, and/or documentation, shall be subject to license terms and license restrictions applicable to the programs. No other rights are granted to the U.S. Government.
This software or hardware is developed for general use in a variety of information management applications. It is not developed or intended for use in any inherently dangerous applications, including applications that may create a risk of personal injury. If you use this software or hardware in dangerous applications, then you shall be responsible to take all appropriate fail-safe, backup, redundancy, and other measures to ensure its safe use. Oracle Corporation and its affiliates disclaim any liability for any damages caused by use of this software or hardware in dangerous applications.
Oracle and Java are registered trademarks of Oracle and/or its affiliates. Other names may be trademarks of their respective owners.
Intel and Intel Xeon are trademarks or registered trademarks of Intel Corporation. All SPARC trademarks are used under license and are trademarks or registered trademarks of SPARC International, Inc. AMD, Opteron, the AMD logo, and the AMD Opteron logo are trademarks or registered trademarks of Advanced Micro Devices. UNIX is a registered trademark of The Open Group.
This software or hardware and documentation may provide access to or information on content, products, and services from third parties. Oracle Corporation and its affiliates are not responsible for and expressly disclaim all warranties of any kind with respect to third-party content, products, and services. Oracle Corporation and its affiliates will not be responsible for any loss, costs, or damages incurred due to your access to or use of third-party content, products, or services.
iii
Contents
Preface
... ix Audience... ix Related documents... ix Conventions ... ix Documentation Accessibility ... xWhat's New
... xiiiNew features in release 11.2.2.1.0 ... xiii
New features in release 11.2.2.0.0 ... xiii
1
Tools for Troubleshooting TimesTen
Using the ttIsql utility... 1-1 Using the ttStatus utility... 1-2 Using the ttCapture utility... 1-5 Using the logs generated by the TimesTen daemon... 1-6 Using the ttTraceMon utility... 1-6
Starting a trace and reading the trace buffer... 1-7
SQL tracing... 1-9 API tracing ... 1-10 DEADLOCK tracing ... 1-10 LOCK tracing ... 1-12 ERR tracing... 1-13 AGING tracing ... 1-14 AUTOREFRESH tracing... 1-16 Using the ttXactAdmin utility... 1-19 Using ODBC tracing... 1-20 Using SNMP traps to detect events... 1-20 Monitoring the TimesTen system tables... 1-20 Using the query optimizer... 1-21
2
Troubleshooting Installation, Upgrades and Downgrades
Installing 32-bit TimesTen on 64-bit Windows... 2-1 Downgrading a database with Oracle data types to TimesTen 6.0... 2-1
3
Troubleshooting TimesTen Applications and Databases
Unable to start or stop TimesTen daemon... 3-1 No response from TimesTen daemon or subdaemon... 3-2
Check the TimesTen user error log... 3-2
Extract a stack trace from the core file ... 3-2 Unable to create shared segment... 3-3 Application unable to connect to database in direct mode... 3-3
Upgrading your database ... 3-4
Privileges to connect to database ... 3-4
Check file system permissions to access database ... 3-4
Check that the TimesTen daemon is running ... 3-4
Check DSN definition... 3-4
Check DSN attributes ... 3-4
Check path name to database and transaction log directories... 3-5
Manage semaphores and shared memory segments... 3-5
Check available swap space (virtual memory) ... 3-6
Increase the number of available file descriptors... 3-6 Troubleshooting Client/Server problems... 3-6
Cannot connect to the TimesTen Server ... 3-6
TimesTen Server failed ... 3-7
Cannot find Server DSN... 3-7
TimesTen Server failed to load DRIVER ... 3-8
Application times out when accessing TimesTen Server... 3-8
TimesTen Client loses connection with TimesTen Server ... 3-8
Failed to attach to shared memory segment for IPC... 3-8
Increasing the maximum server connections on Windows XP... 3-8
Thread stack overflow when using multiple client connections... 3-8
Out of space when DSN specifies new database... 3-9 Application connects or disconnects are slow... 3-9
Check if database is being recovered ... 3-9
Check ODBC tracing... 3-9 Application becomes disconnected unexpectedly... 3-9
Check for ODBC or JDBC errors ... 3-10
Check the user error log ... 3-10 Application is slow... 3-10
Consider connection mode ... 3-11
Update statistics for your tables... 3-11
Verify lock and isolation levels ... 3-12
Check trace settings ... 3-12
Check partition counts for the tables... 3-12 Application unresponsive, appears hung... 3-13
Check logs and gather trace information... 3-13
Check for ODBC errors ... 3-13
Check for deadlocks and timeouts ... 3-14 Application unable to find previously created objects... 3-14
Specify object owner ... 3-15
v Check temporary DSN attribute ... 3-15
Check Overwrite DSN attribute... 3-15
Check path name to database... 3-15 Troubleshooting OCI and Pro*C/C++ applications... 3-16 Running out of a resource... 3-16
Operating system tools and shared memory ... 3-16
Check the amount of memory allocated to the database ... 3-17
Permanent segment filling up... 3-17
Temporary segment filling up ... 3-18
Update query optimizer statistics... 3-18
Check memory used by queries... 3-18
Check available swap space (virtual memory) ... 3-18
Out of memory after fatal crash of the database ... 3-19
Check transaction log file use of disk space ... 3-19
Check if tracing is enabled... 3-20
Check the semaphore limit ... 3-20 Duplicate results from a SELECT statement... 3-20 Cannot attach PL/SQL shared memory... 3-21
4
Troubleshooting Oracle In-Memory Database Cache
Unable to create a cache group... 4-2 Unable to start or stop the cache agent... 4-2
Check status of the cache agent... 4-3
Check ORACLE_HOME environment variable ... 4-3
Check NLS environment variables... 4-3 Recovering cache grid after unexpected system shutdown... 4-3
A portion of the cache grid nodes are still running ... 4-3
All cache grid nodes exited unexpectedly... 4-4 Unable to resolve Oracle Service Name... 4-4 Unable to resolve connect identifier... 4-5 Incompatible Oracle Server and Client versions... 4-5 Unable to validate Oracle username and password... 4-5
Check library path environment variable ... 4-6
Check status of TNS listener and Oracle Server ... 4-6
Check Oracle privileges... 4-6
Check DSN definition... 4-7
Reboot TimesTen machine... 4-7
Set the cache administration user name and password ... 4-7
Check user and system environment ... 4-7
Verify the loaded dynamic libraries ... 4-8 OCI initialization failed... 4-9 Unsupported data type mapping... 4-9 Null constraint does not match Oracle... 4-9 DDL operations on cached Oracle tables may cause cache group operations to fail... 4-10 Changes not visible after updating object in cache group ... 4-10 Loading or refreshing fails... 4-11 Monitoring autorefresh cache groups... 4-11
Using the ttCacheAutorefreshStatsGet procedure... 4-11
Displaying information from the change log tables... 4-13
Understanding messages about autorefresh in the support log ... 4-14
Diagnosing autorefresh failure ... 4-15
Diagnosing autorefresh performance problems... 4-16
Using SNMP traps for alerts about autorefresh problems... 4-16 Optimize performance for IMDB Cache... 4-16 Avoiding performance and memory problems for large batch jobs on Oracle tables... 4-17 Autorefresh not refreshing cache at the specified interval... 4-19
Reset autorefresh state... 4-20
Recover and reset autorefresh Oracle objects ... 4-20 Incremental autorefresh not progressing... 4-20
Validate autorefresh Oracle objects ... 4-21 Incremental autorefresh becomes full autorefresh... 4-21
Detecting when incremental autorefresh becomes full ... 4-22
Understanding the cache administration user tablespace ... 4-22
Diagnosing a full cache administration user tablespace ... 4-23
Monitoring the usage of the cache administration user's tablespace ... 4-23
Considerations when the cache administration user's tablespace is full ... 4-24 Poor autorefresh performance... 4-25
Unresponsive or dead TimesTen database degrades autorefresh performance ... 4-25
Setting cached TimesTen database timeout ... 4-26
Configuring recovery method for certain cache groups ... 4-26
Autorefresh cache group refresh with excessive waiting on resources ... 4-29
Abnormally large change log and base tables degrade autorefresh performance ... 4-30
Fragmented autorefresh change log table space ... 4-31
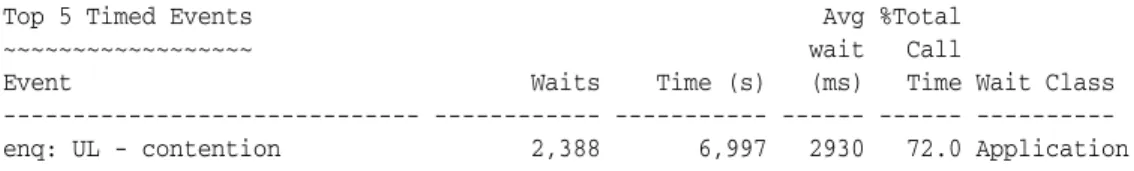
Performance degrades when autorefresh interval is small... 4-31 Declaring NOVALIDATE on constraints causes cache group creation failure... 4-32 AWR report showing lock contention with DBMS_LOCK ... 4-33
5
Troubleshooting Replication
Unable to create a replication scheme... 5-1 Unable to alter a replication scheme... 5-2 Unable to start or stop replication agent... 5-2 Using SNMP traps for notification of replication events... 5-3 Replication does not work... 5-3
Check status of TimesTen daemon and replication agents... 5-3
Check that replication agents are communicating ... 5-5
Check replication state ... 5-5
Check replication scheme configuration ... 5-6
Check ttRepAdmin -showconfig ... 5-6
Check the TTREP.TTSTORES table ... 5-6
Check host names ... 5-7
Check owner names... 5-7
Checking replication owner ... 5-7
Checking table owner... 5-8
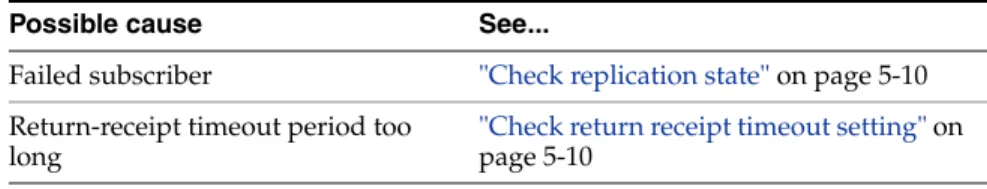
vii Replication unresponsive, appears hung... 5-10
Check replication state ... 5-10
Check return receipt timeout setting... 5-10 Poor replication or XLA performance... 5-11
Check network bandwidth ... 5-11
Check use of return receipt blocking... 5-11
Check replication configuration... 5-11
Check size of log buffer ... 5-12
Check durability settings ... 5-12
Check for reads from transaction log files... 5-12 Problems using ttRepAdmin... 5-14
Problems when changing the state of a replication receiver ... 5-14
Problems using ttRepAdmin -duplicate ... 5-15
Database created before duplication... 5-15
Wrong database or host name... 5-15
Returns 'Must specify -scheme' error ... 5-15 Problems with conflict checking... 5-16
Column cannot be used for replication timestamp... 5-16
Timestamp does not exist ... 5-16
Conflict reporting slows down replication... 5-17
6
Troubleshooting AWT Cache Groups
Replication agent not started... 6-1 AWT performance monitoring... 6-1
Enable AWT performance monitoring... 6-2
Display AWT performance results with the ttRepAdmin utility ... 6-2
Using system tables to monitor AWT operations ... 6-3 Possible causes of poor AWT performance... 6-3
Problems on the Oracle Database ... 6-4
UNLOAD CACHE GROUP requires row updates to complete propagation ... 6-4 Oracle errors reported by TimesTen for AWT... 6-4
Permanent Oracle errors reported by TimesTen ... 6-4
Transient Oracle errors reported by TimesTen... 6-5
Index
ix
Preface
Oracle TimesTen In-Memory Database is a memory-optimized relational database. Deployed in the application tier, Oracle TimesTen In-Memory Database operates on databases that fit entirely in physical memory using standard SQL interfaces. High availability for the in-memory database is provided through real-time transactional replication.
Audience
This guide describes how to troubleshoot some of the problems users encounter when using the Oracle TimesTen In-Memory Database.
To work with this guide, you should understand how database systems work and have some knowledge of SQL (Structured Query Language).
Related documents
TimesTen documentation is available on the product distribution media and on the Oracle Technology Network:
http://www.oracle.com/technetwork/products/timesten/documentation/
Conventions
TimesTen supports multiple platforms. Unless otherwise indicated, the information in this guide applies to all supported platforms. The term Windows refers to all
supported Windows platforms and the term UNIX applies to all supported UNIX platforms and also to Linux. Refer to the "Platforms" section in Oracle TimesTen In-Memory Database Release Notes for specific platform versions supported by TimesTen.
This document uses the following text conventions:
Note: In TimesTen documentation, the terms "data store" and "database" are equivalent. Both terms refer to the TimesTen database unless otherwise noted.
Convention Meaning
boldface Boldface type indicates graphical user interface elements associated with an action, or terms defined in text or the glossary.
TimesTen documentation uses these variables to identify path, file and user names:
Documentation Accessibility
For information about Oracle's commitment to accessibility, visit the Oracle Accessibility Program website at
http://www.oracle.com/pls/topic/lookup?ctx=acc&id=docacc.
italic Italic type indicates book titles, emphasis, or placeholder variables for which you supply particular values.
monospace Monospace type indicates commands within a paragraph, URLs, code in examples, text that appears on the screen, or text that you enter.
italic monospace Italic monospace type indicates a variable in a code example that you must replace. For example:
Driver=install_dir/lib/libtten.sl
Replace install_dir with the path of your TimesTen installation directory.
[ ] Square brackets indicate that an item in a command line is optional. { } Curly braces indicated that you must choose one of the items separated
by a vertical bar ( | ) in a command line.
| A vertical bar (or pipe) separates alternative arguments.
. . . An ellipsis (. . .) after an argument indicates that you may use more than one argument on a single command line.
% The percent sign indicates the UNIX shell prompt.
# The number (or pound) sign indicates the UNIX root prompt.
Convention Meaning
install_dir The path that represents the directory where the current release of TimesTen is installed.
TTinstance The instance name for your specific installation of TimesTen. Each installation of TimesTen must be identified at install time with a unique alphanumeric instance name. This name appears in the install path.
bits or bb Two digits, either 32 or 64, that represent either the 32-bit or 64-bit operating system.
release or rr The first three parts in a release number, with or without dots. The first three parts of a release number represent a major TimesTen release. For example, 1122 or 11.2.2 represents TimesTen 11g Release 2 (11.2.2).
jdk_version Two digits that represent the version number of the major JDK release. Specifically, 14 represent JDK 1.4; 5 represents JDK 5.
timesten A sample name for the TimesTen instance administrator. You can use any legal user name as the TimesTen administrator. On Windows, the TimesTen instance administrator must be a member of the
Administrators group. Each TimesTen instance can have a unique instance administrator name.
DSN The data source name.
xi Access to Oracle Support
Oracle customers have access to electronic support through My Oracle Support. For information, visit
http://www.oracle.com/pls/topic/lookup?ctx=acc&id=info or visit http://www.oracle.com/pls/topic/lookup?ctx=acc&id=trs if you are hearing impaired.
xiii
What's New
This section summarizes the new features and functionality of Oracle TimesTen In-Memory Database Release 11.2.2 that are documented in this guide, providing links into the guide for more information.
New features in release 11.2.2.1.0
■ If you try to change the state of a replication receiver when replication has been
configured to use a secondary IP address, a misconfiguration of the /etc/hosts
file may cause ttRepAdmin to print an error. See "Problems when changing the state of a replication receiver" on page 5-14 for more information.
■ If you provide an incorrect host name for a subscriber or have made an error
entering the subscriber database name or host name in the replication scheme, you may see an error. See "Wrong database or host name" on page 5-15 for more information.
New features in release 11.2.2.0.0
■ Additional information was added about possible causes for a loss in AWT
performance. For more details, see "AWT performance monitoring" on page 6-1.
■ The error log messages for the cache agent daemon were modified as follows: ■ The TimesTen ORA component was often misunderstood to be the Oracle
standard for Oracle messages. Now, the TimesTen ORA component is renamed to CAC.
■ Previously, the TimesTen error message was printed, but the message number
was not identified. Now, the message number is included in all messages, so that the user can reference the error message guide for further details.
For an example of these changes, see "Understanding messages about autorefresh in the support log" on page 4-14.
1
Tools for Troubleshooting TimesTen 1-1
1
Tools for Troubleshooting TimesTen
The following sections in this chapter describe how to use the TimesTen utilities and other tools that are used to diagnose problems with the TimesTen database:
■ Using the ttIsql utility ■ Using the ttStatus utility ■ Using the ttCapture utility
■ Using the logs generated by the TimesTen daemon ■ Using the ttTraceMon utility
■ Using the ttXactAdmin utility ■ Using ODBC tracing
■ Using SNMP traps to detect events ■ Monitoring the TimesTen system tables ■ Using the query optimizer
Using the ttIsql utility
The ttIsql utility enables you to interactively execute SQL statements and report status information on your TimesTen database.
All TimesTen SQL operations can be executed from a ttIsqlCommand> prompt. Example 1–1 Using the ttIsql utility
To start the ttIsql utility for the demo database, enter:
% ttIsql demo
You should see output similar to the following:
Copyright (c) 1996-2011, Oracle. All rights reserved. Type ? or "help" for help, type "exit" to quit ttIsql. connect "DSN=demo";
Connection successful: DSN=demo;UID=ttuser;DataStore=c:\temp\demo; DatabaseCharacterSet=US7ASCII;ConnectionCharacterSet=US7ASCII;
DRIVER=C:\WINDOWS\system32\ttdv70.dll;Authenticate=0;PermSize=20;TypeMode=0; (Default setting AutoCommit=1)
Command>
Using the ttStatus utility
"Using the ttIsql Utility" in the Oracle TimesTen In-Memory Database Operations Guide describes how to use the most common ttIsql commands. The following ttIsql
commands are commonly used when troubleshooting:
■ monitor formats the contents of the SYS.MONITOR table.
See "Displaying database structure information" in the Oracle TimesTen In-Memory Database Operations Guide.
■ dssize prints database size information.
See "Displaying database structure information" in the Oracle TimesTen In-Memory Database Operations Guide.
■ showplan prints the optimizer execution plans for selects, updates, and deletes in this transaction.
See "Viewing and changing query optimizer plans" in the Oracle TimesTen In-Memory Database Operations Guide.
■ isolation sets or displays the isolation level.
See "Working with transactions" in the Oracle TimesTen In-Memory Database Operations Guide.
■ timing prints query timing.
See "Timing ODBC function calls" in the Oracle TimesTen In-Memory Database Operations Guide.
■ optprofile prints the current optimizer flag settings and join order. See "Viewing and changing query optimizer plans" in the Oracle TimesTen In-Memory Database Operations Guide.
For the full list of ttIsql features, see the lists of options and commands under the description of the ttIsql utility in the Oracle TimesTen In-Memory Database Reference.
Using the ttStatus utility
Use the ttStatus utility to check the status of the TimesTen daemon and the state of all TimesTen connections.
Example 1–2 ttStatus shows TimesTen daemon is not running
In this example, the output from ttStatus indicates that no TimesTen daemon is running. If the daemon has stopped unexpectedly, see "No response from TimesTen daemon or subdaemon" on page 3-2 for troubleshooting information.
On Windows:
C:\>ttStatus
ttStatus: Could not connect to the TimesTen service.
If the TimesTen service is not running, please start it by running "ttDaemonAdmin -start".
On UNIX platforms:
$ ttStatus
ttStatus: Could not connect to the TimesTen daemon. If the TimesTen daemon is not running, please start it by running "ttDaemonAdmin -start".
Using the ttStatus utility
Tools for Troubleshooting TimesTen 1-3 Example 1–3 ttStatus shows TimesTen daemon is running
In this example, the output from ttStatus indicates that the TimesTen daemon is running. It recognizes one database named demo.
The first line indicates that the TimesTen daemon is running as process 884 on port 17000 for the TimesTen instance MYINSTANCE. The second line indicates the TimesTen Server is running as process 2308 on port 17002.
There are currently seven connections to the database: one user and six subdaemon connections. You may see up to 2047 connections.
The restart policies for the cache agent and the replication agent in the database are set to manual.
C:\>ttStatus
TimesTen status report as of Mon Aug 6 22:03:04 2012 Daemon pid 884 port 17000 instance MYINSTANCE
TimesTen server pid 2308 started on port 17002
---Data store c:\temp\demo
There are 7 connections to the data store Replication policy : Manual
Cache Agent policy : Manual PL/SQL enabled.
---Data store c:\temp\demo
Shared Memory KEY Global\DBI45b94095.1.SHM.4 HANDLE 0x278
Type PID Context Connection Name ConnID
Process 4616 0x00d08820 demo 1
Subdaemon 2136 0x00526768 Worker 2042
Subdaemon 2136 0x0072e750 Flusher 2043
Subdaemon 2136 0x007348b8 Checkpoint 2044
Subdaemon 2136 0x067b0068 Aging 2045
Subdaemon 2136 0x067c0040 Monitor 2047
Subdaemon 2136 0x068404c8 HistGC 2046 Replication policy : Manual
Cache agent policy : Manual
---End of report
Example 1–4 ttStatus shows replication information
In this example, the output from ttStatus indicates that the TimesTen daemon is running. It recognizes three databases: demo, subscriber1ds, and masterds. The
subscriber1ds and masterds databases are replicated databases. In this example, the output from ttStatus indicates that the replication agents for the replicated databases have been started. Bidirectional replication has been configured between
masterds and subscriber1ds. Each replication agent has five connections to the database.
C:\>ttStatus
TimesTen status report as of Mon Aug 6 22:03:04 2012
Note: This example was produced on Windows. The results are the same on UNIX platforms except for the formats of the database path and the shared memory key.
Using the ttStatus utility
Daemon pid 5088 port 17000 instance MYINSTANCE TimesTen server pid 4344 started on port 17002
---Data store c:\temp\subscriber1ds
There are 12 connections to the data store
Shared Memory KEY Global\DBI45b9471c.2.SHM.2 HANDLE 0x280
Type PID Context Connection Name ConnID
Process 1244 0x00d08fb0 subscriber1ds 1
Replication 4548 0x00aed2f8 LOGFORCE 4
Replication 4548 0x00b03470 TRANSMITTER 5
Replication 4548 0x00b725a8 RECEIVER 6
Replication 4548 0x00b82808 REPHOLD 2
Replication 4548 0x00b98980 REPLISTENER 3
Subdaemon 2752 0x00526768 Worker 2042
Subdaemon 2752 0x0072a758 Flusher 2043
Subdaemon 2752 0x007308c0 Checkpoint 2044
Subdaemon 2752 0x00736a28 HistGC 2046
Subdaemon 2752 0x067f02f8 Aging 2045
Subdaemon 2752 0x068364a0 Monitor 2047
Replication policy : Manual Replication agent is running. Cache agent policy : Manual ---Data store c:\temp\masterds There are 12 connections to the data store Shared Memory KEY Global\DBI45b945d0.0.SHM.6 HANDLE 0x2bc Type PID Context Connection Name ConnID Process 5880 0x00d09008 masterds 1
Replication 3728 0x00aed570 LOGFORCE 4
Replication 3728 0x00b036e8 TRANSMITTER 5
Replication 3728 0x00b168b8 REPHOLD 3
Replication 3728 0x00b1ca20 REPLISTENER 2
Replication 3728 0x00b22b88 RECEIVER 6
Subdaemon 3220 0x00526768 Worker 2042
Subdaemon 3220 0x0072e768 Flusher 2043
Subdaemon 3220 0x007348d0 Checkpoint 2044
Subdaemon 3220 0x067b0068 Aging 2045
Subdaemon 3220 0x067c0040 Monitor 2047
Subdaemon 3220 0x068404c8 HistGC 2046 Replication policy : Manual
Replication agent is running. Cache agent policy : Manual
---Data store c:\temp\demo
There are no connections to the data store Replication policy : Manual
Cache agent policy : Manual
---End of report
Example 1–5 ttStatus shows cache group information
This example shows the cache agent running on rep1 database. There is one cache group in the database. The cache agent has five connections to the database.
C:\>ttStatus
TimesTen status report as of Mon Aug 6 22:03:04 2012 Daemon pid 1012 port 17000 instance MYINSTANCE No TimesTen server running
---Using the ttCapture utility
Tools for Troubleshooting TimesTen 1-5
Data store c:\data\rep1
There are 12 connections to the data store
Shared Memory KEY Global\DBI45ef98ac.1.SHM.56 HANDLE 0x260 Type PID Context Connection Name ConnID
Cache Agent 3380 0x00bbddf0 Handler 2
Cache Agent 3380 0x00c3f318 Aging 3
Cache Agent 3380 0x07380398 Timer 4
Cache Agent 3380 0x073cfa18 ttora70 6
Cache Agent 3380 0x073ff010 ttora70 7
Process 2084 0x00c48ee8 rep1 1
Subdaemon 1632 0x006bc430 Worker 2042
Subdaemon 1632 0x06630458 Flusher 2045
Subdaemon 1632 0x0664f978 Checkpoint 2044
Subdaemon 1632 0x0665ee60 HistGC 2043
Subdaemon 1632 0x066de720 Aging 2046
Subdaemon 1632 0x0670dc78 Monitor 2047 Replication policy : Manual
Cache agent policy : Manual
TimesTen's Cache agent is running for this data store
---End of report
Example 1–6 ttStatus shows connection to old instance
This example shows a connection to an old instance of a database. This can occur when a database is invalidated, but some users have not disconnected from the invalidated copy of the database still in memory. After all users disconnect, the memory can be freed.
C:\>ttStatus
TimesTen status report as of Mon Aug 6 22:03:04 2012 Daemon pid 5088 port 17000 instance MYINSTANCE TimesTen server pid 4344 started on port 17002
---Data store c:\temp\sample
There are no connections to the data store Obsolete or not yet active connection(s):
Process 4696 context 0xd08800 name sample connid 1, obsolete connection, shmKey 'Global\DBI45b94c6f.3.SHM.4'
Replication policy : Manual Cache agent policy : Manual
---End of report
Using the ttCapture utility
The ttCapture utility captures information about the configuration and state of your TimesTen system into a file that provides technical support with a snapshot of your system at the time the ttCapture utility is running. The ttCapture utility generates a file named ttcapture.date.time.log. By default, the file is written to the directory from which you invoke the ttCapture utility. Use the ttCapture-dest
option to direct the output file to be written to another directory. If you run ttCapture again, it writes the information to a new file.
On Windows platforms, running ttCapture also produces an XML file named
Using the logs generated by the TimesTen daemon
When you experience a problem with a TimesTen database, run ttCapture with the
DSN option for the database as soon as possible, either when you are encountering the problem or immediately afterward.
When you contact technical support, upload the ttcapture.date.number.log file to the Service Request. Windows users should also upload the
ttcapture.date.time.nfo file.
See "ttCapture" in the Oracle TimesTen In-Memory Database Reference for information about additional options.
Using the logs generated by the TimesTen daemon
TimesTen uses a TimesTen daemon to manage access to the databases. As the daemon operates, it generates error, warning and informational messages. These messages may be useful for TimesTen system administration and for debugging applications.
By default, informational messages are stored in:
■ A user error log that contains information you may need to see. Generally, these
messages contain information about actions you may need to take.
■ A support log containing everything in the user error log plus information for use
by technical support.
See "Modifying informational messages" in the Oracle TimesTen In-Memory Database Operations Guide for information about configuring the logs, including their location and size.
Using the ttTraceMon utility
Use the ttTraceMon utility to log various trace information on a number of TimesTen components. Each TimesTen component can be traced at different levels of detail. You can list all of the traceable TimesTen components and their current tracing level by specifying ttTraceMon with the show subcommand. The full list of options for
ttTraceMon is described in the "ttTraceMon" section in the Oracle TimesTen In-Memory Database Reference.
TimesTen tracing severely impacts application performance and consumes a great deal of disk space if trace output is directed to a file. In addition, when using AWT cache groups, you must restart the replication agent when trying to trace the ORACON
component with ttTraceMon. Use the ttTraceMon utility only when diagnosing problems. When you are finished, reset tracing to the default values.
Example 1–7 Default trace levels for components
This example shows that the levels for most tracing components are set to level 0 (off) for the demo database. Both the ERR and DEADLOCK components are set to 1 for tracing by default. See "ERR tracing" on page 1-13.
% ttTraceMon -e show demo AGING ... 0 API ... 0 ASYNCMV ... 0 AUTOREFRESH ... 0
Note: Always double-quote directory and file names in case there are spaces in the names.
Using the ttTraceMon utility
Tools for Troubleshooting TimesTen 1-7
CG ... 0 CGRID ... 0 CGRIDC ... 0 CKPT ... 0 DEADLOCK ... 1 EE ... 0 ERR ... 1 FLOW ... 0 HEAP ... 0 LATCH ... 0 LOCK ... 0 LOG ... 0 LOGF ... 0 OPT ... 0 ORACON ... 0 PLOAD ... 0 PT ... 0 REPL ... 0 SM ... 0 SQL ... 0 TEST ... 0 TRACE ... 0 XA ... 0 XACT ... 0
The output for most TimesTen components is of interest only to technical support. However, the output for the SQL, API, LOCK, ERR, AGING and AUTOREFRESH
components may be useful to you when you are troubleshooting application problems. The rest of this section includes the following topics:
■ Starting a trace and reading the trace buffer ■ SQL tracing ■ API tracing ■ DEADLOCK tracing ■ LOCK tracing ■ ERR tracing ■ AGING tracing ■ AUTOREFRESH tracing
Starting a trace and reading the trace buffer
Start a new trace by specifying ttTraceMondatastore. For example, to start a trace on the demo database, enter:
% ttTraceMon demo
Trace monitor; empty line to exit Trace >
At the Trace prompt, specify the type of trace and its level. For example, to start tracing the SQL component at level 3, enter:
Trace > level sql 3
At this point you can run your application and the TimesTen trace information is written to a trace buffer. There are two ways to read the contents of the trace buffer:
Using the ttTraceMon utility
■ From the Trace prompt, use the outfile command to direct the trace buffer data to a file. You must do this before running your application. When writing tracing information to a file, new trace information is concatenated to the existing contents of the file.
■ From the Trace prompt, use the dump command to display the trace buffer data to your screen.
Each record from the trace buffer has the following format:
timestamp sequence component level connection processid operation
The fields in the records are defined as follows:
■ timestamp is the time at which the operation was executed. ■ sequence is the incremental number that identifies the trace line.
■ component is the TimesTen component being traced (such as SQL, API, LOCK, or
ERR).
■ level is the trace level associated with the trace line. The range of trace levels
differs by component, but for all components, the lowest trace level generates the least verbose output and highest trace level generates the most verbose output. For example, if you are tracing SQL at level 4, your output includes lines for levels 2 (prepare), 3 (execute), and 4 (open, close, fetch).
■ connection is the internal connection ID identifying the connection that
generated the trace. This number corresponds to the ConnID shown in the
ttStatus output. The connection ID is also used as the first element of the transaction ID.
■ processid is the operating system process ID for the process that generated the
trace.
■ operation is the operation that occurred (such as SQL statement, API operation,
or error message).
For example, a line from the trace buffer after a SQL trace at level 3 might look like this:
10:39:50.231 5281 SQL 2L 1C 3914P Preparing: select cust_num from customer
Note: The contents of the trace buffer accumulate with each new trace. To clear the trace buffer, use the flush command from a
ttTraceMon prompt. Clear the buffered trace records for a specific component by specifying the component with the flush command.
Note: Trace levels for some components are not a continuous range of numbers. If you enter a number that does not correspond to a supported level for a component, tracing occurs at the highest
supported level that is less than the number you entered. For example, if tracing levels for a component are 1, 2, 3, 4, and 6 and you enter 5, tracing events for level 1, 2, 3, and 4 are generated.
Using the ttTraceMon utility
Tools for Troubleshooting TimesTen 1-9
SQL tracing
Using ttTraceMon with the SQL component provides information about the SQL being prepared or executed by the TimesTen engine. Table 1–1 describes the levels for SQL tracing. Each level with a '+' sign includes the trace information described for that level, plus all levels preceding it.
Example 1–8 SQL trace
In this example, we execute ttTraceMon to do a SQL trace at level 4 on the demo
database. We direct the output from the SQL trace to the SQLtrace.txt file. We then flush the buffer so that the trace does not report past SQL statements.
% ttTraceMon demo
Trace monitor; empty line to exit Trace > outfile SQLtrace.txt Trace > level sql 4
Trace > flush
At this point, we execute an application that includes the following SQL statement:
SELECT * FROM departments WHERE department_id = 10;
The trace information is written to the SQLtrace.txt file:
12:19:36.582 269 SQL 2L 3C 29570P Preparing: select * from departments where department_id = 10
12:19:36.583 270 SQL 4L 3C 29570P sbSqlCmdCompile ()(E): (Found already compiled version: refCount:01, bucket:28) cmdType:100, cmdNum:1000146. 12:19:36.583 271 SQL 4L 3C 29570P Opening: select * from departments where department_id = 10;
12:19:36.583 272 SQL 4L 3C 29570P Fetching: select * from departments where department_id = 10;
12:19:36.583 273 SQL 4L 3C 29570P Closing: select * from departments where department_id = 10;
5 records dumped
When the application has completed, we turn off SQL tracing and exit ttTraceMon.
Trace > level sql 0
Table 1–1 SQL tracing levels
Level Output
2 SQL commands being prepared. 3 + SQL commands being executed
4 + The effect of command pooling (prepares not being done because the prepared command already exists in the pool), the need for reprepares (for example, because an index was created), and commands being destroyed.
At this level, ttTraceMon also shows when a query command is being opened, fetched, and closed.
5 + Some internal data, such as command numbers, which are not generally useful for customer-level debugging.
Note: TimesTen recommends tracing SQL at level 3 or 4. SQL tracing does not show any information about the optimizer. Optimizer tracing is managed by a separate component (OPT) at level 4 only, and is not designed for customer use.
Using the ttTraceMon utility
Trace > {press ENTER – blank line}
API tracing
API traces are generated for database operations such as connecting to a database, changing a connection attribute, and committing a transaction. Table 1–2 describes the levels for API tracing. Each level with a '+' sign includes the trace information
described for that level, plus all levels preceding it.
Example 1–9 API trace
In this example, we execute ttTraceMon to do a API trace at level 3 on the demo
database. The output from the API trace is written to the APItrace.txt file. Before saving the API trace to the buffer, we use the flush command to empty the buffer.
% ttTraceMon demo
Trace monitor; empty line to exit Trace> outfile APItrace.txt Trace> level api 3
Trace > flush
At this point, we execute the application. When the application has completed, we turn off API tracing and exit ttTraceMon:
Trace > level api 0
Trace > {press ENTER – blank line}
The contents of APItrace.txt are similar to the sample output shown below. The output shows connection to the database, setting the connection character set, setting the isolation level, and committing a transaction.
11:54:26.796 1016 API 3L 2C 4848P sb_dbConnect()(X) 11:54:26.796 1017 API 3L 2C 4848P sb_dbConnCharsetSet()(E) 11:54:26.796 1018 API 3L 2C 4848P sb_dbConnSetIsoLevel()(E) 11:54:39.795 1019 API 3L 2C 4848P sb_dbConnSetIsoLevel()(E) 11:54:45.253 1020 API 3L 2C 4848P sb_xactCommitQ()(E)
DEADLOCK tracing
Use the DEADLOCK component to trace the occurrences of all deadlocks for all applications.
Table 1–2 API tracing levels
Level Output
1 All rollback attempts by the subdaemon. This occurs if an application exits abruptly and the subdaemon recovers its connection.
2 + Some low-on-space conditions.
3 + Create, connect, disconnect, checkpoint, backup, and compact operations for the database, as well as commit and rollback for each connection, and a few other operations.
4 + Most other operations conducted at TimesTen's internal API level. It does not show numerous operations on the storage manager and indexes that are done internally.
Using the ttTraceMon utility
Tools for Troubleshooting TimesTen 1-11
Table 1–3 describes the DEADLOCK tracing levels. Each level with a '+' sign includes the trace information described for that level, plus all levels preceding it.
Example 1–10 DEADLOCK trace
In this example, we execute ttTraceMon to do a DEADLOCK trace at level 1, which is the default, on myDSN database.
We make two connections to myDSN. For the first connection, autocommit is on. We create table test and insert two rows. Then, we set autocommit off and update the
x1=1 row of table test. Because autocommit is off, the row is not inserted into the table until we commit. A lock is held until we commit or roll back the transaction.
Command> create table test (x1 int unique, y1 int); Command> insert into test values (1,1);
1 row inserted.
Command> insert into test values (2,2); 1 row inserted.
Command> autocommit 0;
Command> update test set y1=y1 where x1=1; 1 row updated.
For the second connection to myDSN, autocommit is set to off. We update the x1=2 row of table test.
Command> autocommit 0;
Command> update test set y1=y1 where x1=2; 1 row updated.
Now, we create a deadlock situation by executing update statements in both connections for rows that are locked by each other. The first connection executes an update against the row where x1=2.
Command> update test set y1=y1 where x1=2; 6003: Lock request denied because of time-out
Details: Tran 2.1 (pid 32750) wants Un lock on rowid BMUFVUAAAAaAAAAETk, table ME.TEST. But tran 3.2 (pid 32731) has it in Xn (request was Xn). Holder SQL (update t1 set y1=y1 where x1=2)
The command failed.
The second connection executes an update against the row where x1=1.
Command> update test set y1=y1 where x1=1; 6002: Lock request denied because of deadlock
Details: Tran 3.2 (pid 32731) wants Un lock on rowid BMUFVUAAAAaAAAADzk, table ME.TEST. But tran 2.1 (pid 32750) has it in Xn (request was Xn). Holder SQL (update t1 set y1=y1 where x1=1)
The command failed.
We use the flush command to empty the buffer.
% ttTraceMon myDSN
Trace monitor; empty line to exit Trace> flush
Table 1–3 DEADLOCK tracing levels
Level Output
1 Logs deadlock cycles as they are discovered.
Using the ttTraceMon utility
The trace buffer contains the following information showing all level 1 deadlock traces, as evidenced by '1L'.:
Trace> dump
09:50:26.444 13 DEADLOCK 1L 2036C 3484P edge 1: xid 3.2, cid 3, <Row BMUFVUAAAAaAAAADzk,0x8c5
74(574836)> 0 cnt=1 , Tbl 'T1', SQL='update t1 set y1=y1 where x1=1' 09:50:26.455 14 DEADLOCK 1L 2036C 3484P edge 0: xid 2.1, cid 2, <Row BMUFVUAAAAaAAAAETk,0x8c5
74(574836)> 0 cnt=1 , Tbl 'T1', SQL='update t1 set y1=y1 where x1=2' 09:50:26.455 15 DEADLOCK 1L 2036C 3484P Victim: xcb:3.2, SQL='update t1 set y1=y1 where x1=1'
If you want more information, set DEADLOCK tracing to a higher value. For example, the following sets DEADLOCK tracing to level 4 in ttTraceMon:
Trace > level deadlock 4
LOCK tracing
Use the LOCK component to trace the locking behavior of your application to detect trouble with deadlocks or lock waits. LOCK tracing generates a great deal of volume, so it is important to choose the appropriate level of tracing. Level 3, for example, begins to generate a large number of traces, as traces are written for fairly common events. In addition, the traces themselves may be somewhat hard to read in places. If you cannot discern enough information for your purposes, contact technical support for more information.
Table 1–4 describes the LOCK tracing levels. Each level with a '+' sign includes the trace information described for that level, plus all levels preceding it.
Example 1–11 LOCK trace
In this example, we execute ttTraceMon to do a LOCK trace at level 4 on myDSN
database.
We make two connections to myDSN. For the first connection, we set autocommit on. We create table test and insert three rows. We create a materialized view using table
test.
We turn on tracing at level 4 and use the flush command to empty the buffer.
% ttTraceMon myDSN
Trace monitor; empty line to exit Trace> level lock 4
Trace> flush
Table 1–4 LOCK tracing levels
Level Output
1 Deadlock cycles as they are discovered. 2 + Failures to grant locks for any reason.
3 + Lock waits (which may or may not be granted).
4 + All lock grants/releases, some routine calls, and the mechanism of the deadlock detector.
Using the ttTraceMon utility
Tools for Troubleshooting TimesTen 1-13 For the second connection to myDSN, we set autocommit off. We insert a row into table test. Because autocommit is off, the row is not inserted into the table until we commit. A lock is held until we commit or roll back the transaction.
If we use the dump command to display the contents of the trace buffer, we see that there are no records in the trace buffer:
Trace> dump 0 records dumped
From the first connection, we try to drop the materialized view. We cannot drop the view because there is a transaction that has not been committed or rolled back:
Command> drop materialized view v;
6003: Lock request denied because of time-out
Details: Tran 3.71 (pid 24524) wants Sn lock on table TTUSER.TEST. But tran 1.42 (pid 24263) has it in IXn (request was IXn). Holder SQL (insert into test values (100);)
The command failed.
The trace buffer contains the following information:
Trace> dump
20:09:04.789 174759 LOCK 3L 3C 24524P ENQ: xcb:00003 <Tbl 0x9b894,0x0> 0+Sn=>SL activity 0 Sn cnt=0; Holder xcb:00001 IXn
20:09:04.789 174760 LOCK 3L 3C 24524P Connection 3 scheduled for sleep 20:09:04.789 174761 LOCK 3L 3C 24524P Connection 3 sleeping
20:09:14.871 174762 LOCK 3L 2047C 24237P Connection 3 timed out 20:09:14.871 174763 LOCK 3L 2047C 24237P Connection 3 woken up 20:09:14.871 174764 LOCK 3L 3C 24524P Connection 3 awake
20:09:14.871 174765 LOCK 2L 3C 24524P ENQ: xcb:00003 <Tbl 0x9b894,0x0> 0+Sn=>TM activity 0 Sn cnt=1; Holder xcb:00001 IXn
7 records dumped
When finished with the trace, we set LOCK tracing back to its default setting (0) and exit ttTraceMon:
Trace > level lock 0
Trace > {press ENTER – blank line}
ERR tracing
It may be useful to trace the ERR component. For example, an ERR trace at level 4 shows all of the error messages that are pushed in the TimesTen direct driver (not all errors are output to the user because they are handled internally). ERR tracing at level 1 is the default. No output is written for ERR tracing at level 2 and 3.
Table 1–5 describes ERR tracing levels. Each level with a '+' sign includes the trace information described for that level, plus all levels preceding it.
Example 1–12 ERR trace
In this example, we execute ttTraceMon to do a ERR trace at level 4 on myDSN
database.
Table 1–5 ERR tracing levels
Level Output
1 (set by default) Fatal errors
4 + All other error messages, many of which are handled internally by TimesTen.
Using the ttTraceMon utility
First we create a table:
Command> create table test (id tt_integer);
Next we turn on tracing at level 4. Rather than direct the trace output to a file as in the previous examples, we read it directly from the trace buffer. Before saving the ERR
trace to the buffer, we use the flush command to empty the buffer.
% ttTraceMon myDSN
Trace monitor; empty line to exit Trace> level err 4
Trace> flush
Now we execute a SQL script with three errors in it. The errors are:
■ Creating a table with the same name as an existing table ■ Using incorrect syntax to insert values into the table ■ Inserting CHAR data into a TT_INTEGER column
Command> create table test (id tt_integer); 2207: Table TEST already exists
The command failed.
Command> insert into test values 'abcd');
1001: Syntax error in SQL statement before or at: "'abcd'", character position: 25
insert into test values 'abcd'); ^^^^^^ The command failed.
Command> insert into test values ('abcd'); 2609: Incompatible types found in expression The command failed.
The trace information is written to the trace buffer. We display it by using the dump
command.
Trace> dump
19:28:40.465 174227 ERR 4L 1C 24263P TT2207: Table TEST already exists -- file "eeDDL.c", lineno 2930, procedure "sbEeCrDtblEval()"
19:28:51.399 174228 ERR 4L 1C 24263P TT1001: Syntax error in SQL statement before or at: "'abcd'", character position: 25
insert into test values 'abcd'); ^^^^^^
-- file "ptSqlY.y", lineno 6273, procedure "reserved_word_or_syntax_error" 19:29:00.725 174229 ERR 4L 1C 24263P TT2609: Incompatible types found in expression -- file "saCanon.c", lineno 12618, procedure "sbPtAdjustType()" 3 records dumped
Set ERR tracing back to its default setting (1) and exit ttTraceMon:
Trace > level err 1
Trace > {press ENTER – blank line}
AGING tracing
Use the ttTraceMon utility to obtain the following information:
■ When aging starts and ends
■ How many rows have been deleted by the aging subdaemon
See "Implementing aging in your tables" in the Oracle TimesTen In-Memory Database Operations Guide.
Using the ttTraceMon utility
Tools for Troubleshooting TimesTen 1-15
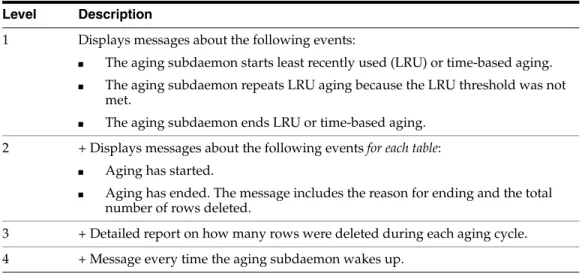
Table 1–6 describes the AGING tracing levels. Each level with a '+' sign includes the trace information described for that level, plus all levels preceding it.
Example 1–13 AGING trace
In this example, we execute ttTraceMon to do an AGING trace on myDSN database. The database contains TTUSER.MYTAB table, which has a time-based aging policy. The table is described as follows:
Command> describe TTUSER.MYTAB; Table TTUSER.MYTAB:
Columns:
*ID TT_INTEGER NOT NULL TS TIMESTAMP (6) NOT NULL Aging use TS lifetime 3 minutes cycle 1 minute on 1 table found.
(primary key columns are indicated with *)
The table contains the following rows before the aging cycle begins:
Command> select * from TTUSER.MYTAB; < 1, 2007-03-21 12:54:06.000000 > < 3, 2010-03-17 08:00:00.000000 > < 4, 2007-03-21 12:59:40.000000 > < 5, 2007-03-21 13:00:10.000000 > < 6, 2007-03-21 13:01:22.000000 > 5 rows found.
We execute ttTraceMon to do an AGING trace at level 3. Rather than direct the trace output to a file, we read it directly from the trace buffer. Before saving the AGING trace to the buffer, we use the flush command to empty the buffer.
% ttTraceMon myDSN
Trace monitor; empty line to exit Trace> level aging 3
Trace> flush
Display the trace information in the buffer by using the dump command.
Trace> dump
13:16:56.802 1247 AGING 1L 2045C 17373P Entering sbAgingTB(): curTime=78
Table 1–6 AGING tracing levels Level Description
1 Displays messages about the following events:
■ The aging subdaemon starts least recently used (LRU) or time-based aging. ■ The aging subdaemon repeats LRU aging because the LRU threshold was not
met.
■ The aging subdaemon ends LRU or time-based aging.
2 + Displays messages about the following events for each table:
■ Aging has started.
■ Aging has ended. The message includes the reason for ending and the total
number of rows deleted.
3 + Detailed report on how many rows were deleted during each aging cycle. 4 + Message every time the aging subdaemon wakes up.
Using the ttTraceMon utility
13:16:56.803 1248 AGING 2L 2045C 17373P Entering sbAgingOneTable(): curTime=78, ltblid= 637140
13:16:56.804 1249 AGING 3L 2045C 17373P curTime=78, 4 deleted, 1 remaining, tbl = TTUSER.MYTAB
13:16:56.804 1250 AGING 2L 2045C 17373P Exiting sbAgingOneTable(): curTime=78, reason = 'no more rows', 4 deleted, 1 remaining, tbl = TTUSER.MYTAB 13:16:56.804 1251 AGING 1L 2045C 17373P Exiting sbAgingTB(): curTime=78 5 records dumped
We set AGING tracing back to its default setting (0) and exit ttTraceMon:
Trace > level aging 0
Trace > {press ENTER – blank line}
AUTOREFRESH tracing
Use the ttTraceMon utility to obtain information about the progress of autorefresh operations for cache groups with the AUTOREFRESH cache group attribute.
See "AUTOREFRESH cache group attribute" in the Oracle In-Memory Database Cache User's Guide.
Table 1–7 describes AUTOREFRESH tracing levels. Each level with a '+' sign includes the trace information described for that level, plus all levels preceding it.
Table 1–7 AUTOREFRESH tracing levels Level Description
1 Autorefresh summary for the interval:
■ The time that autorefresh started
■ Number of autorefreshed rows for the interval ■ Number of autorefreshed root table rows for interval
■ Total number of autorefreshed rows since the cache agent started
■ Total number of autorefreshed rows in the root table since the cache agent
started
■ The time that autorefresh ended
Note: Times and information about root table rows are reported for full autorefresh.
2 + Autorefresh summary at the cache group level:
■ The time that autorefresh started for each cache group ■ Number of autorefreshed rows for each cache group
■ Number of autorefreshed root table rows for each cache group
■ Total number of autorefreshed rows for each cache group since the cache
agent started
■ Total number of autorefreshed rows in the root table for each cache group
since the cache agent started
■ The time that autorefresh ended for each cache group
Note: Times and information about root table rows are reported for full autorefresh.
Using the ttTraceMon utility
Tools for Troubleshooting TimesTen 1-17 Example 1–14 AUTOREFRESH trace
In this example, we use the ttTraceMon utility to trace autorefresh operations on the
cgDSN database. When we set the trace level to 1, we see information that is similar to the output of the ttCacheAutorefreshStatsGet built-in procedure.
% tttracemon cgDSN
Trace monitor; empty line to exit Trace> level autorefresh 1 Trace> dump
08:56:57.445 19398 AUTOREFRESH 1L 5C 32246P Autorefresh number 1415 started for interval 60000
08:56:57.883 19419 AUTOREFRESH 1L 5C 32246P Duration For Interval 60000ms: 420 08:56:57.883 19420 AUTOREFRESH 1L 5C 32246P Num Rows For Interval 60000ms: 0 08:56:57.883 19421 AUTOREFRESH 1L 5C 32246P Num Root Rows For Interval 60000ms: 0
08:56:57.883 19422 AUTOREFRESH 1L 5C 32246P Cumulative Rows for Interval 60000ms: 11587
08:56:57.883 19423 AUTOREFRESH 1L 5C 32246P Cumulative Root Rows for Interval 60000ms: 1697
08:56:57.883 19424 AUTOREFRESH 1L 5C 32246P Autorefresh number 1415 ended for interval 60000ms successfully.
7 records dumped
Tracing at level 4 produces additional information about autorefresh operation 1415. Information about autorefresh is provided for the testuser.readcache cache group, the testuser.readtab root table and the autorefresh interval.
Trace> level autorefresh 4 Trace> dump
08:56:57.445 19398 AUTOREFRESH 1L 5C 32246P Autorefresh number 1415 started for interval 60000
08:56:57.471 19399 AUTOREFRESH 2L 5C 32246P Autorefresh started for cachegroup
3 + Autorefresh summary at the table level:
■ The time that autorefresh started ■ Number of autorefreshed rows
■ Total number of autorefreshed rows since the cache agent started ■ The time that autorefresh ended
4 + Autorefresh details for each table:
■ The time that autorefresh started for each table ■ The autorefresh query
■ Query execute time in milliseconds on the Oracle database ■ Query fetch time in milliseconds on the Oracle database ■ Query apply time in milliseconds on TimesTen
■ Query execute time in milliseconds on the Oracle database for child tables ■ Query fetch time in milliseconds on the Oracle database for child tables ■ Query apply time in milliseconds on TimesTen for child tables
■ The time that autorefresh ended for each table
■ The autorefresh bookmark (logseq) to which autorefresh was completed Table 1–7 (Cont.) AUTOREFRESH tracing levels
Using the ttTraceMon utility
TESTUSER.READCACHE
08:56:57.471 19400 AUTOREFRESH 3L 5C 32246P Incremental autorefresh started for table TESTUSER.READTAB
08:56:57.471 19401 AUTOREFRESH 4L 5C 32246P Autorefresh Query: SELECT L."COL_10", X."COL_20", X.ft$NotDelete, Z.rowid FROM (SELECT DISTINCT "COL_10" FROM
"TESTUSER"."TT_06_454854_L" WHERE logseq >:logseq AND ft_cacheGroup <> 100000000000*1844259679+-299200618) L,(SELECT "TESTUSER"."READTAB"."COL_10", "TESTUSER"."READTAB"."COL_20", 1 AS ft$NotDelete FROM "TESTUSER"."READTAB", "TESTUSER"."T1" WHERE "TESTUSER"."READTAB"."COL_10" = "TESTUSER"."T1"."COL_10") X, "TESTUSER"."READTAB" Z WHERE L ."COL_10" = X."COL_10" (+) AND X."COL_10" = Z."COL_10" (+), logseq: 7
08:56:57.870 19402 AUTOREFRESH 3L 5C 32246P Duration for table TESTUSER.READTAB: 70
08:56:57.870 19403 AUTOREFRESH 3L 5C 32246P Num Rows for table TESTUSER.READTAB: 1
08:56:57.870 19404 AUTOREFRESH 3L 5C 32246P Cumulative rows for table TESTUSER.READTAB: 1559
08:56:57.870 19405 AUTOREFRESH 4L 5C 32246P Autorefresh Query Execute duration for table TESTUSER.READTAB: 60
08:56:57.870 19406 AUTOREFRESH 4L 5C 32246P Autorefresh Query Fetch duration for table TESTUSER.READTAB: 0
08:56:57.870 19407 AUTOREFRESH 4L 5C 32246P Autorefresh Query Apply duration for table TESTUSER.READTAB: 0
08:56:57.870 19408 AUTOREFRESH 4L 5C 32246P Max logseq applied for table TESTUSER.READTAB: 8
08:56:57.870 19409 AUTOREFRESH 4L 5C 32246P Autorefresh Query Execute duration for 7 child(ren) table(s): 32
08:56:57.870 19410 AUTOREFRESH 4L 5C 32246P Autorefresh Query Fetch duration for 7 child(ren) table(s): 0
08:56:57.870 19411 AUTOREFRESH 4L 5C 32246P Autorefresh Query Apply duration for 7 child(ren) table(s): 0
08:56:57.870 19412 AUTOREFRESH 3L 5C 32246P Incremental autorefresh ended for table TESTUSER.READTAB
08:56:57.872 19413 AUTOREFRESH 2L 5C 32246P Duration For Cache Group TESTUSER.READCACHE: 1020
08:56:57.872 19414 AUTOREFRESH 2L 5C 32246P Num Rows For Cache Group TESTUSER.READCACHE: 1
08:56:57.872 19415 AUTOREFRESH 2L 5C 32246P Num Root Rows For Cache Group TESTUSER.READCACHE: 0
08:56:57.872 19416 AUTOREFRESH 2L 5C 32246P Cumulative Rows for Cache Group TESTUSER.READCACHE: 11776
08:56:57.872 19417 AUTOREFRESH 2L 5C 32246P Cumulative Root Rows for Cache Group TESTUSER.READCACHE: 1697
08:56:57.872 19418 AUTOREFRESH 2L 5C 32246P Autorefresh ended for cache group TESTUSER.READCACHE
08:56:57.883 19419 AUTOREFRESH 1L 5C 32246P Duration For Interval 60000ms: 420 08:56:57.883 19420 AUTOREFRESH 1L 5C 32246P Num Rows For Interval 60000ms: 0 08:56:57.883 19421 AUTOREFRESH 1L 5C 32246P Num Root Rows For Interval 60000ms: 0
08:56:57.883 19422 AUTOREFRESH 1L 5C 32246P Cumulative Rows for Interval 60000ms: 11587
08:56:57.883 19423 AUTOREFRESH 1L 5C 32246P Cumulative Root Rows for Interval 60000ms: 1697
08:56:57.883 19424 AUTOREFRESH 1L 5C 32246P Autorefresh number 1415 ended for interval 60000ms successfully.
27 records dumped
We set AUTOREFRESH tracing back to its default setting (0) and exit ttTraceMon:
Trace > level autorefresh 0 Trace > {press ENTER – blank line}
Using the ttXactAdmin utility
Tools for Troubleshooting TimesTen 1-19
Using the ttXactAdmin utility
The ttXactAdmin utility displays ownership, status, log and lock information for each outstanding transaction. You can also use it to show all current connections to a database. The ttXactAdmin utility is useful for troubleshooting problems with replication, XLA, and asynchronous writethrough cache groups.
Example 1–15 Using ttXactAdmin to diagnose a lock timeout
Use ttXactAdmin to diagnose a lock timeout. Consider two connections that are trying to update the same row. The following transaction by Connection 1 is in progress:
UPDATE table1 SET c1 = 2 WHERE c1 = 1;
Connection 2 attempts to make the following update:
UPDATE table1 SET c1 = 3 WHERE c1 = 1;
Connection 2 receives the following error:
6003: Lock request denied because of time-out
Details: Tran 2.3 (pid 2880) wants Un lock on rowid 0x00156bbc, table TTUSER.TABLE1.
But tran 1.21 (pid 2564) has it in Xn (request was Xn). Holder SQL (update table1 set c1 = 2 where c1 = 1;)
The command failed.
The details of the error indicate that transaction 1.21 has a lock on row 0x00156bbc, the row that transaction 2.3 wants to update. ttXactAdmin displays this information in output that pertains to actions in the entire database:
$ ttXactAdmin myDSN 2011-03-07 12:57:41.237 c:\datastore\myDSN
TimesTen Release 11.2.2.0.0 Outstanding locks
PID Context TransID TransStatus Resource ResourceID Mode Name Program File Name: ttIsql
2564 0xeeb9a8 1.21 Active Database 0x01312d00 IX
Row 0x00156bbc Xn TTUSER.TABLE1
Table 1910868 IXn TTUSER.TABLE1
Program File Name: ttIsql
2880 0xeeb9a8 2.3 Active Database 0x01312d00 IX
Table 1910868 IXn TTUSER.TABLE1 Command 19972120 S
Awaiting locks
PID Context TransID Resource ResourceID RMode HolderTransID HMode Name
2880 0xeeb9a8 2.3 Row 0x00156bbc Un 1.21 Xn TTUSER.TABLE1
2 outstanding transactions found
Using ODBC tracing
Using ODBC tracing
On Windows, use the ODBC trace facility to verify the sequence and content of your commands. The ODBC trace facility works only if you have linked your application with the ODBC Driver Manager. Enable tracing by double-clicking ODBC in the Control Panel. This opens the ODBC Data Source Administrator. Choose the Tracing
tab.
On UNIX platforms, ODBC tracing is available only when using a driver manager. To turn on tracing, set the Trace and TraceFile attributes.
Using SNMP traps to detect events
Network management software uses SNMP (Simple Network Management Protocol) to query or control the state of network devices such as routers and switches. These devices can generate alerts called traps to inform the network management systems of problems.
TimesTen sends SNMP traps for particular critical events to help facilitate user recovery mechanisms. These events are also recorded in the support log. Exposing them through SNMP traps enables network management software to take immediate action.
How to configure TimesTen to generate SNMP traps as well as how to receive the traps is described in "Diagnostics through SNMP Traps" in the Oracle TimesTen In-Memory Database Error Messages and SNMP Traps.
Monitoring the TimesTen system tables
Each TimesTen database contains a group of system tables that store metadata about the current state of the database. The system tables are described in "System Tables" in the Oracle TimesTen In-Memory Database System Tables and Views Reference.
Of particular interest when troubleshooting is the SYS.MONITOR table, which contains statistics about certain events that have occurred since the first connection to the database. For example, the SYS.MONITOR table contains information about the number of connections to the database; the number of checkpoints taken; the size of the database; and the amount of memory currently in use. Check the contents of the
SYS.MONITOR table by executing SELECT statements on the columns or by using the
ttIsqlmonitor command. For an example of how to use the ttIsqlmonitor
command, see "Using the ttIsql Utility" in the Oracle TimesTen In-Memory Database Operations Guide.
The SYS.MONITOR table is useful for troubleshooting performance problems. See "Reading query plan from the PLAN table" in the Oracle TimesTen In-Memory Database Operations Guide for details. Check the contents of the SYS.MONITOR table by
executing SELECT statements on the columns or by using the ttIsqlshowplan
command, as described in "Viewing and changing query optimizer plans" in the Oracle TimesTen In-Memory Database Operations Guide.
Note: You can execute SELECT statements on a system table, but you cannot execute a statement such as INSERT, UPDATE or DELETE on these tables.
Using the query optimizer
Tools for Troubleshooting TimesTen 1-21
Using the query optimizer
The query optimizer is an important tool for performance tuning. For details about using the query optimizer, see:
■ "The TimesTen Query Optimizer" in the Oracle TimesTen In-Memory Database
Operations Guide
■ "Viewing and changing query optimizer plans" in the Oracle TimesTen In-Memory
Database Operations Guide
If you find that a given query runs more slowly than expected, confirm that the query optimizer has the latest statistics for the tables in your query, as described in "Update query optimizer statistics" on page 3-18. If, after updating your statistics, your query still runs too slowly, it is possible that the TimesTen optimizer is not choosing the optimal query plan to answer that query. Under these circumstances, you can adjust how the optimizer generates a plan by using the ttOpt procedures described in "Modifying plan generation" in the Oracle TimesTen In-Memory Database Operations Guide.