Important notice:
In order to prevent misunderstandings, it seems
important to underline that the figures on costs per
tonne of waste sorted or unit of energy saved cannot be
used directly to qualify a system as cost-efficient or not.
Careful reading, including of the preface, the footnotes
and assumptions, is necessary to fully understand the
context of the numbers and conclusions.
This document has been prepared for use within the Commission. It does not necessarily represent the Commission’s official position.
COST-EFFICIENCY OF
PACKAGING RECOVERY
SYSTEMS
-THE CASE OF FRANCE,
GERMANY, THE NETHERLANDS
AND THE UNITED KINGDOM
Final Report
Contract n°ETD/98/502038
FEBRUARY 2000
COMMISSION OF THE EUROPEAN
COMMUNITIES
DG ENTERPRISE
Contact TAYLOR NELSON SOFRES Consulting Jean-François CAGNOT ( 33 01 40 92 45 72 Véronique MONIER ( 33 01 40 92 47 00 Anaïs LE DORÉ ( 33 01 40 92 45 62 SBE / 2158.3
W E W O U L D L I K E T O T H A N K O U R C O N T A C T S I N F R A N C E , G E R M A N Y , T H E N E T H E R L A N D S A N D T H E U N I T E D K I N G D O M F O R T H E I N F O R M A T I O N T H E Y P R O V I D E D U S A N D F O R
T A Y L O R N E L S O N S O F R E S -Consulting ____________________________________________________________________________________________
COST-EFFICIENCY OF PACKAGING RECOVERY SYSTEMS: THE CASE OF FRANCE, GERMANY, THE NETHERLANDS AND THE UNITED KINGDOM (FEBRUARY 2000)
Preface
Packaging waste management is a controversial issue. Many discussions have taken place and not always on the basis of good analysis. Information might be available (however, usually dispersed among many actors and frequently confidential), but there is a lack of putting this information together in a way that allows to draw conclusions. Doing so is a risky exercise because one is bound sometimes to be imprecise, to work with assumptions and, last but not least, not to please everyone. Nevertheless, we felt that we should take this risk in order to move away from pre-conceived opinions to discussion on hard facts in so far as they are relevant for the main considerations.
Without repeating the explanations contained in the report, it seems important to underline the context of the present study. The purpose of the study is to analyse the financing of packaging recovery systems in the wider sense (i.e. the way how existing levels of packaging waste recycling and recovery are financed in the four countries considered). This should help to better understand the differences between national systems and to draw conclusions how existing systems could be developed in a cost-efficient way. Some of the conclusions can also feed into the revision of the targets of the Packaging and Packaging waste directive, although the study cannot give an answer to which levels of targets are appropriate. The study was also intended to help in developing more harmonized financing systems on a European level on the basis of the lessons to be drawn from the national experiences. This latter goal, however, is a long-term strategic objective rather than a concrete plan.
Information on packaging recovery systems is extremely complex and data are not readily available. It would, of course, have been possible to launch a very big and expensive study to verify all details of packaging management. However, this was not the idea for the present study. Using the limited financial resources, the study should make best value for money, i.e. to get a good
understanding of the way the systems run and how they can be compared. Rather than spending too much time on refining the last details of the figures, the consultant was told to focus on a reasonably exact picture on the core subject of the study, i.e. the
financing of household packaging waste recycling. For this subject, the data contained are certainly among the most robust available. On the other issues considered, in particular the non-household packaging section, only rough estimates were made since much more would not have been feasible without substantial research. We feel, however, that the picture would have been incomplete had we entirely left aside non-household packaging.
A similar approach has been taken as regards the environmental evaluation. This study is not a new life cycle analysis for packaging. It was based on existing information which may or may not be correct in its details. For the purpose of this study, the analysis of environmental benefits was used as a sort of currency to compare the systems since we felt that it is incorrect to
compare the costs of systems without looking at what they achieve. Therefore, the data should taken with certain care and, eventually, be refined in future to be representative for all situations.
As regards the conclusions, we do not think that the cost differences encountered can be used as simple means to say what is a good or a bad system. However, we think that the study made a number of choices transparent that lead to more or less cost-efficiency. Properly discussed in their context, they may give an indication in which a cost-efficient development of the systems should go. However, this is a discussion which needs to take place on a national level.
This said, we hope that the main purpose of the study was achieved, namely to remove some of the big unknowns – or rather “non-understoods” - as regards packaging waste management and to create a better knowledge and understanding of the ways the various systems work and how they can be compared.
T A Y L O R N E L S O N S O F R E S -Consulting ______________________________________________________________________________________________5 COST-EFFICIENCY OF PACKAGING RECOVERY SYSTEMS: THE CASE OF FRANCE, GERMANY, THE NETHERLANDS AND THE UNITED KINGDOM
(FEBRUARY 2000)
C
O N T E N T
1. Executive Summary _____________________________________________________________________________________________ 12
1.1 Context and Objective of the Study________________________________________________________________________________________ 13
1.2 Methodology and Limits of the Study ______________________________________________________________________________________ 13
1.3 Cost Analysis __________________________________________________________________________________________________________ 14
1.4 Conclusions ___________________________________________________________________________________________________________ 16
1.5 Likely Developments which may Change the Position of the Various Countries in the Near Future __________________________________ 26
2. Introduction ___________________________________________________________________________________________________ 27
2.1 Objective and Scope of the Study _________________________________________________________________________________________ 29
2.2 Methodological Issues___________________________________________________________________________________________________ 32
3. Current Situation of the 4 Countries compared with the Packaging Recycling and Recovery Directive Targets ____________________ 33
3.1 Current Situation for Total Packaging _____________________________________________________________________________________ 35
3.2 Current Situation per Type of Packaging: Household / Non Household__________________________________________________________ 37
3.3 Current Situation per Packaging Material__________________________________________________________________________________ 39
4. Cost and Cost-Efficiency of Household Packaging Waste Recycling ______________________________________________________ 40
4.1 Presentation of the Analysis Method_______________________________________________________________________________________ 41
4.1.1 Scope of the Analysis ___________________________________________________________________________________________________________ 41 4.1.2 Definitions used _______________________________________________________________________________________________________________ 42 4.1.3 Objectives of the Analysis _______________________________________________________________________________________________________ 42 4.1.4 Method ______________________________________________________________________________________________________________________ 43 4.1.5 Sources of Data _______________________________________________________________________________________________________________ 46
4.2 General Philosophy of the Household Packaging Waste Management Systems____________________________________________________ 47
4.3.1 Total Expenses ________________________________________________________________________________________________________________ 51 4.3.2 Market Revenues ______________________________________________________________________________________________________________ 54 4.3.3 “Financing Need”______________________________________________________________________________________________________________ 53 4.3.4 Comparison of the “Financing Need” to Alternative Waste Treatment Costs ________________________________________________________________ 54
4.4 Structure of the Expenses for PLASTICS __________________________________________________________________________________ 56
4.4.1 Total Expenses ________________________________________________________________________________________________________________ 56 4.4.2 Market Revenues ______________________________________________________________________________________________________________ 58 4.4.3 “Financing Need”______________________________________________________________________________________________________________ 59 4.4.4 Comparison of the “Financing Need” to Alternative Waste Treatment Costs ________________________________________________________________ 59
4.5 Structure of the Expenses for PAPER/BOARD______________________________________________________________________________ 62
4.5.1 Total Expenses ________________________________________________________________________________________________________________ 62 4.5.2 Market Revenues ______________________________________________________________________________________________________________ 64 4.5.3 “Financing Need”______________________________________________________________________________________________________________ 64 4.5.4 Comparison of the “Financing Need” to Alternative Waste Treatment Costs ________________________________________________________________ 64
4.6 Structure of the Expenses for TINPLATE __________________________________________________________________________________ 66
4.6.1 Total Expenses ________________________________________________________________________________________________________________ 68 4.6.2 Market Revenues ______________________________________________________________________________________________________________ 68 4.6.3 “Financing Need”______________________________________________________________________________________________________________ 69 4.6.4 Comparison of the “Financing Need” to Alternative Waste Treatment Costs ________________________________________________________________ 69
4.7 Structure of the Expenses for ALUMINIUM________________________________________________________________________________ 72
4.7.1 Total Expenses ________________________________________________________________________________________________________________ 74 4.7.2 Market Revenues ______________________________________________________________________________________________________________ 76 4.7.3 “Financing Need”______________________________________________________________________________________________________________ 76 4.7.4 Comparison of the “Financing Need” to Alternative Waste Treatment Costs ________________________________________________________________ 76
4.8 Total “Financing Need” to Recycle Household Packaging Waste _______________________________________________________________ 78
4.9 Actors Responsible for Covering the “Financing Need” _______________________________________________________________________ 79
4.10 Comparison of the “Financing Need” to Alternative Waste Treatment Costs ___________________________________________________ 79
T A Y L O R N E L S O N S O F R E S -Consulting ______________________________________________________________________________________________7 COST-EFFICIENCY OF PACKAGING RECOVERY SYSTEMS: THE CASE OF FRANCE, GERMANY, THE NETHERLANDS AND THE UNITED KINGDOM
(FEBRUARY 2000)
4.11.2 Efficiency of the Systems ________________________________________________________________________________________________________ 84 4.11.3 Recycling Rates and “Financing Need” per Tonne of Packaging put on the Market ___________________________________________________________ 86 4.11.4 Recycling Rates and “Financing Need” per Capita ____________________________________________________________________________________ 88
4.12 Evolution of Household Packaging Recycling Costs ________________________________________________________________________ 89
5. Cost and Cost-Efficiency of Non Household Packaging Waste Recycling (Order of Magnitude)________________________________ 90
5.1 Presentation of the Analysis Method_______________________________________________________________________________________ 92
5.1.1 Scope of the Analysis ___________________________________________________________________________________________________________ 92 5.1.2 Objective of the Analysis ________________________________________________________________________________________________________ 92 5.1.3 Method ______________________________________________________________________________________________________________________ 93 5.1.4 Sources of Information and Hypotheses_____________________________________________________________________________________________ 93
5.2 Order of Magnitude for the Cost of Non Household Packaging Waste Recycling __________________________________________________ 94
5.3 Cost-Efficiency of Non Household Packaging Recycling ______________________________________________________________________ 99
6. Cost of Total Packaging Waste Management ________________________________________________________________________ 102
6.1 Presentation of the Analysis Method______________________________________________________________________________________ 103
6.1.1 Objective of the Analysis _______________________________________________________________________________________________________ 103 6.1.2 Method _____________________________________________________________________________________________________________________ 103 6.1.3 Sources of Information and Hypotheses____________________________________________________________________________________________ 104
6.2 Comparison of the Unit Costs of Recycling and of Alternative Waste Treatments ________________________________________________ 106
7. Environmental Impacts and Benefits of Packaging Waste Management In the 4 Countries __________________________________ 108
7.1 Presentation of the Analysis Method______________________________________________________________________________________ 108
7.1.1 Scope of the Analysis __________________________________________________________________________________________________________ 110 7.1.2 Method _____________________________________________________________________________________________________________________ 108 7.1.3 Methodology for Recycling _____________________________________________________________________________________________________ 111 7.1.4 Methodology for Incineration and Landfilling _______________________________________________________________________________________ 120
7.2 Main Results _________________________________________________________________________________________________________ 123
7.2.1 Comparison between Treatment Routes per Material _________________________________________________________________________________ 123 7.2.2 Comparison between Alternative Treatment Routes of Currently Recycled Packaging Waste __________________________________________________ 125 7.2.3 Costs-Benefits Indicators for Household Packaging Recycling __________________________________________________________________________ 129
8. Appendix 1: Recycling Quantities and Rates in the 4 Countries Detailed Figures___________________________________________ 130 9. Appendix 2: PRN Price Variations ________________________________________________________________________________ 135 10. Appendix 3: Indicators of the Cost-Efficiency of the Recycling Systems for Household Packaging Waste _______________________ 137 11. Appendix 4: Hypotheses for the Cost of Packaging Waste Management __________________________________________________ 139 12. Appendix 5: Hypotheses of Sorting Refuse Rates _____________________________________________________________________ 141 13. Appendix 6: Bibliography _______________________________________________________________________________________ 143
T A Y L O R N E L S O N S O F R E S -Consulting ______________________________________________________________________________________________9 COST-EFFICIENCY OF PACKAGING RECOVERY SYSTEMS: THE CASE OF FRANCE, GERMANY, THE NETHERLANDS AND THE UNITED KINGDOM
(FEBRUARY 2000)
L I S T O F T A B L E S
Table 1: Current situation – Total packaging waste recycling and recovery____________________________________________________________________34 Table 2: Current situation: Split of the total packaging recycling rate between household and non household packaging ________ 36 Table 3: Current situation and national targets – Packaging waste recycling and recovery per type of waste(household, non
household) ____________________________________________________________________________________________ 38 Table 4: “Financing need” of household packaging waste recycling in 1998 _____________________________________________ 76 Table 5: Financing need breakdown by financer ____________________________________________________________________ 78 Table 6: Household packaging consumption in 1998 for materials which are recycled _____________________________________ 87 Table 7: Cost-efficiency of non household packaging recycling per material _____________________________________________ 98 Table 8: Net cost of packaging waste management in 1998 __________________________________________________________ 104 Table 9: Hypotheses regarding environmental benefits of packaging recycling per material _______________________________ 113 Table 10: Assessment of environmental benefits of packaging recycling per country ____________________________________ 115 Table 11: Hypotheses regarding environmental impacts and benefits of packaging incineration and landfilling________________ 117 Table 12: Comparison of the environmental impacts and benefits (energy) of alternative treatment routes per material _________ 120 Table 13: Assessment of the environmental impacts and benefits of packaging if they were incinerated instead of being recycled 122 Table 14: Comparison of the environmental impacts and benefits of treatment routes ____________________________________ 124 Table 15: Costs-benefits indicator (energy) for household packaging waste ____________________________________________ 126 Table 16: Costs-benefits indicator (solid waste) for household packaging waste _________________________________________ 128
L I S T O F G R A P H S
Financing sources for recycling of household packaging___________________________________________________________ 14 Financing need for recycling (household/non-household packaging waste ____________________________________________ 15 Cost per GJ of energy saved by household packaging recycling _____________________________________________________ 18 Cost benefit ratio of household packaging waste recycling _________________________________________________________ 19 Cost of recycling: glass, plastics_______________________________________________________________________________ 20 Cost of recycling: paper/board, tinplate, aluminium _______________________________________________________________ 23 Description of the methodology followed in the study______________________________________________________________ 28 France: financing of glass household packaging recycling : who paid for what in 1998 ? _________________________________ 50 Germany: financing of sales household packaging recycling: who paid for what in 1998 ? _______________________________ 50 Netherlands: financing of glass household packaging recycling : who paid for what in 1998 ? ____________________________ 52 United Kingdom: financing of glass household packaging recycling : who paid for what in 1998 ? _________________________ 52 France: financing of plastic household packaging recycling : who paid for what in 1998 ?________________________________ 54 Germany: financing of plastic household packaging recycling : who paid for what in 1998 ? ______________________________ 56 France: financing of paper/board household packaging recycling : who paid for what in 1998 ? ___________________________ 60 Germany: financing of paper/board household sales recycling : who paid for what in 1998 ?______________________________ 60 Netherlands: financing of paper/board household packaging recycling : who paid for what in 1998 ?_______________________ 62 France: financing of tinplate household packaging recycling : who paid for what in 1998 ? _______________________________ 64 Germany: financing of tinplate sales packaging recycling : who paid for what in 1998 ?__________________________________ 66 Netherlands: financing of tinplate household packaging recycling : who paid for what in 1998 ?___________________________ 68 France: financing of aluminium household packaging recycling : who paid for what in 1998 ? ____________________________ 70 Germany: financing of aluminium sales packaging recycling : who paid for what in 1998 ? _______________________________ 72
T A Y L O R N E L S O N S O F R E S -Consulting ______________________________________________________________________________________________11 COST-EFFICIENCY OF PACKAGING RECOVERY SYSTEMS: THE CASE OF FRANCE, GERMANY, THE NETHERLANDS AND THE UNITED KINGDOM
(FEBRUARY 2000)
Four cost efficiency indicators_________________________________________________________________________________ 80 Cost-efficiency analysis for household packaging: recycling rate versus “financing need” per tonne sorted _________________ 82 Cost-efficiency analysis for household packaging: recycling rate versus “financing need” per tonne put on the market _______ 84 Cost-efficiency analysis for household packaging: recycling rate versus “financing need” per capita per year _______________ 86 France: cost of commercial and industrial packaging recycling in 1998 _______________________________________________ 94 Germany: cost of non sales packaging recycling in 1998 ___________________________________________________________ 95 Netherlands: cost of commercial and industrial packaging recycling in 1998 ___________________________________________ 96 United Kingdom: cost of commercial and industrial packaging recycling in 1998 _______________________________________ 97
T A Y L O R N E L S O N S O F R E S -Consulting _____________________________________________________________________________________________13 COST-EFFICIENCY OF PACKAGING RECOVERY SYSTEMS: THE CASE OF FRANCE, GERMANY, THE NETHERLANDS AND THE UNITED KINGDOM
(FEBRUARY 2000)
1.1 Context and Objective of the Study
In the last years, the European Community has launched a number of initiatives aimed at increasing recycling and recovery of certain waste streams. Among these, the Packaging and Packaging Waste Directive (94/62/EC) had to be implemented into national law by 30 June 1996. In spite of delays in several countries, legislation is now in place in all Member States except Greece.
The objective of this study is to carry out a cost-efficiency analysis of recycling in four countries, including the comparison with alternative treatment routes (incineration with energy recovery, disposal). The study aims at making transparent the underlying political choices, the resulting cost structures and the relative benefits achieved by recycling. The countries chosen were France, Germany, the Netherlands and the United Kingdom.
Due to the differences in costs and benefits, the analysis distinguishes between the various materials (glass, plastics, paper and board, tinplate, aluminium) and sources (household and non-household packaging). It focuses on household packaging but also gives an order of magnitude of costs and cost-efficiency of the various treatment routes for non-household packaging.
The study aims at assessing the situation of packaging recycling in a country at a point in time (1997 for recycling rates1, 1998 for
costs) without separating the effect of the implementation of the Directive on recycling. Therefore it also includes recycling which was carried out before the Directive was implemented.
The term “packaging recovery systems” has been interpreted in a wider sense (i.e. not focusing only on particular compliance schemes such as DSD, Eco-Emballages, SVM-Pact, Valpak, Biffpack… and the PRN system) but on the way both recycling and recovery are organised and financed in the four countries.
1.2 Methodology and Limits of the Study
It was initially agreed that the methodology would rely on data available in the literature. However, after considerable secondary research we had to come to the conclusion that expert enquiries at national and European level would be necessary, due to the unavailability of the data and their lack of consistency and reliability when available. A large number of interviews were necessary to build and cross-check the data.
Assumptions and sources of information are systematically indicated in the individual chapters.
1
As a consequence of these difficulties, and in line with the terms of references of the study, we focused more on the household source for cost and energy savings assessments. Accordingly, the data on household waste can be considered as robust (although within the limits indicated in the study), whereas the figures on non-household packaging waste are estimates which may not
necessarily reflect the wide range of concrete situations occurring for this type of waste.
1.3 Cost Analysis
The cost analysis performed is close to the methodology of value-chain analysis: the various financial flows (costs and revenues) have been shown for each single step from collection to recycling.
Three types of costs were considered:
n The total cost: all costs from collection until the gate of a factory producing a final product.
n The “financing need”: total costs minus revenues from the sale of sorted materials.
This is the amount of financial injections necessary to render recycling profitable from a recycler’s point of view. Since the
“financing need” essentially corresponds to the amount covered by packaging recovery systems (in the wider sense, i.e. including contributions from tax payers), this study mainly focuses on this type of costs and the way it is shared between the various actors.
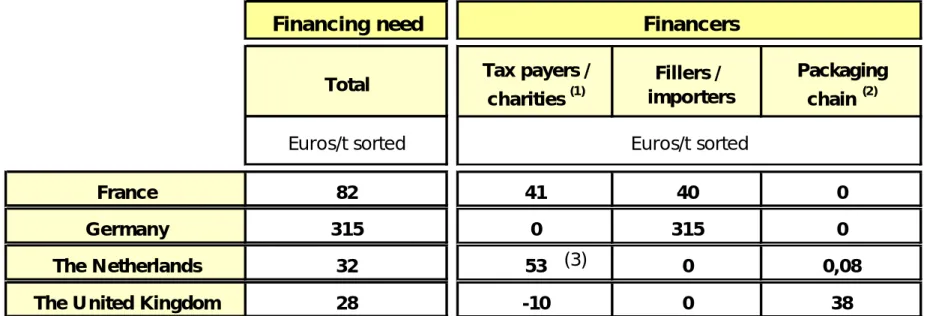
In Germany, fillers and importers pay the entire “financing need” for the collection and recycling of household packaging waste. In France, it is split between fillers/importers and tax payers. In the Netherlands, the “financing need” is almost entirely covered by the tax payer. In the UK, there is a split between tax payers and the packaging chain (which contributes via the PRN system).
Financing sources for recycling of household packaging
€/t sorted France Germany NL UK
Tax payers/ charities 41 0 53 -10 Fillers/ importers 40 315 0 0 Packaging chain 0 0 0.08 38
T A Y L O R N E L S O N S O F R E S -Consulting _____________________________________________________________________________________________15 COST-EFFICIENCY OF PACKAGING RECOVERY SYSTEMS: THE CASE OF FRANCE, GERMANY, THE NETHERLANDS AND THE UNITED KINGDOM
(FEBRUARY 2000)
Caveat: Whichever actor pays to finance the scheme in the first place, costs are to a large extent likely to be transferred to the
consumer/tax payer via product prices, charges and/or taxes.
In the case of industrial and commercial packaging waste, holders of the waste pay the entire net expenses. In the United Kingdom, the revenues from the PRN system may in future also contribute to these expenses.
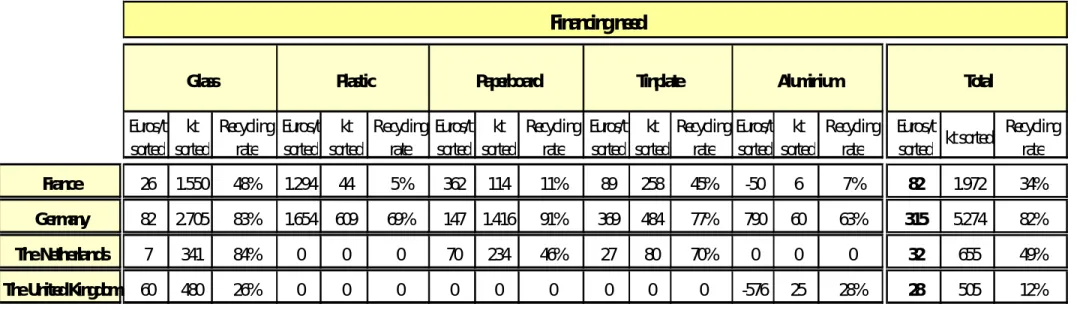
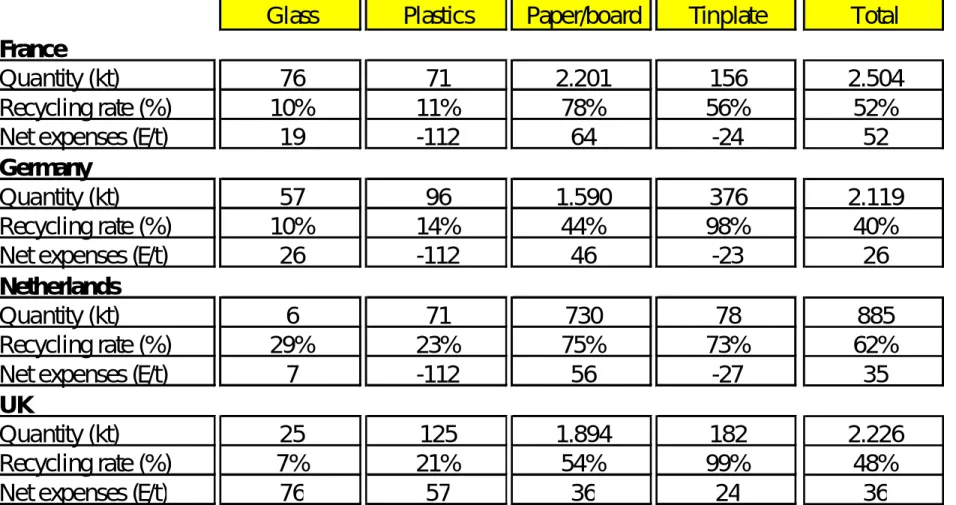
Financing need for recycling (household/non-household)
€/t sorted2 France Germany NL UK
Household Non household Household Non household Household Non household Household Non household Glass 26 19 82 26 7 7 60 76
Plastics 1294 -112 1654 -112 n.a. -112 n.a. 57
Paper/board 362 64 147 46 70 56 n.a. 36
Tinplate 89 -24 369 -23 27 -27 n.a. 24
Aluminium -50 n.a. 790 n.a. n.a. n.a. -576 n.a.
n The net costs comparing the “financing need” with alternative waste management options.
Obviously, waste that is not recycled must be treated in alternative waste management options. Therefore, from the point of view
of the waste holder as well as consumer/tax payer, spending funds for recycling is cheaper if the avoided waste treatment costs are higher than the “financing need” for recycling. Within the framework of this study, no such net costs were calculated due to difficulties to distinguish between fixed and variable costs for alternative waste treatment methods. Fixed costs occur independently from waste quantities. For example, local authorities cannot always optimise the organisation of residual waste collection (adjustment of containers, of the collection circuit, of manpower) in parallel with the development of separate collection due to management constraints (characteristics of existing equipment… ). In the case of incineration, the decrease in the total amount of waste incinerated can push up unit costs as a consequence of an under-utilisation of the incinerator if the recycled waste is not replaced by other sources. Additionally, it is difficult to allocate waste treatment costs per material due to different specific weights and other characteristics.
2
1.4 Conclusions
n Given the lack of reliable data, cost assessments rely on several hypotheses. As a consequence, the accuracy of the cost
values can be considered to be within a range of 10% to 15% for household packaging. For non-household packaging, the accuracy may be much lower.
n In the estimation of the environmental impacts and benefits of recycling compared to the other treatment routes, the packaging
mix currently recycled is taken as basis for the calculations. Energy savings and waste avoidance are used as indicators. The following factors seem to influence the cost-efficiency of packaging recycling.
n The possibility to choose between industrial and commercial sources and household sources reduces the costs per tonne of
waste recycled and per unit of energy saved substantially (focus on the cheapest source for each material).
n The density of population is an important factor. Obligations to cover small and remote municipalities increase costs
considerably. Environmentalbenefits, however, are reduced by higher transport distances only to a relatively smaller extent.
n As regards the influence of increasing quantities of collected and recycled packaging materials on the costs per tonne, there is
no clear trend recognisable. This may be the result of two opposite trends: on the one hand, economies of scale with higher recycling levels may reduce unit costs; on the other hand, higher recycling levels may result in the need to address sources more and more difficult to recycle (e.g. for plastics and aluminium in Germany). The relatively low costs in the Netherlands may be partly a result of relatively high recycling levels without, however, addressing relatively expensive sources.
n The recycling costs need to be compared to the costs of alternative waste treatment. Although the study cannot give concrete
net costs and has to rely on several hypotheses, as explained in the corresponding chapters, it is clear that in many cases recycling is the cheapest waste management option. This is confirmed by recycling activities that existed before any legislative measures were enacted.
n The direct comparison between France and Germany on the one hand and the Netherlands and the United Kingdom on the
other hand is difficult because the materials recycled do not always come from the same source. In the Netherlands and the United Kingdom, industrial and commercial sources prevail (although there are also highly effective systems for glass and paper/board collection from households in the Netherlands), whereas in France and Germany, there is a focus of recycling efforts on household sources (although there is also significant collection from industrial and commercial sources).
T A Y L O R N E L S O N S O F R E S -Consulting _____________________________________________________________________________________________17 COST-EFFICIENCY OF PACKAGING RECOVERY SYSTEMS: THE CASE OF FRANCE, GERMANY, THE NETHERLANDS AND THE UNITED KINGDOM
(FEBRUARY 2000)
n The French and German systems are based on an administrative approach, i.e. the setting of a relatively detailed legal
framework differentiating between household/sales and non-household/non-sales packaging. Further details are fixed by the approval conditions for the recycling/recovery systems for household/sales packaging. Consequently, these systems do not necessarily focus on the sources that are most cost-efficient to recycle.
n Although more costly per unit of environmental benefit, the highest recycling levels and environmental benefits in absolute terms
are attained by Germany.
n The French situation is usually somewhere between the Dutch and German systems as regards costs per unit of environmental
benefit (except for paper, where costs are highest for France). Recycled quantities are comparatively low (except glass).
n The Dutch system is to a large extent based on agreements with industry and public authorities and does not differentiate
between industrial and household packaging waste. As a consequence, there is a focus on the most cost-efficient sources for the respective packaging materials and it has the lowest costs per unit of environmental benefit. It fails, however, to achieve as high recycling rates as the German system.
n The United Kingdom system relies on the provision of evidence of recycling and recovery by obligated companies, this evidence
being tradable (“packaging recovery notes”). This system also leaves the choice between industrial and household sources open. So far, the system has, however, not yet substantially increased pre-existing recycling levels and therefore it is too early to evaluate the effects of the PRN system. The current recycling activities in the United Kingdom are not necessarily linked to the PRN system and are mostly limited to cases where it is financially cheaper than alternative waste management options. As regards household packaging, the only existing recycling schemes are for glass (medium to high costs, depending on whether a PRN price is included) and aluminium cans (financially profitable).
Cost per GJ of Energy saved by Household Packaging Recycling in comparison to Production from Virgin Material
Glass
Plastics
Paper board Tinplate
Alu
France Germany
The Netherlands The United King d o m
-10 0 10 20 30 40
T A Y L O R N E L S O N S O F R E S -Consulting _____________________________________________________________________________________________19 COST-EFFICIENCY OF PACKAGING RECOVERY SYSTEMS: THE CASE OF FRANCE, GERMANY, THE NETHERLANDS AND THE UNITED KINGDOM
(FEBRUARY 2000)
Cost-Benefit Ratio of Household Packaging Waste Recycling
Glass Recycling rate %3 €/GJ primary4 €/GJ marginal5 (incin.)
France 48 6 n.a
Germany 83 19 n.a
Netherlands 84 2 n.a
UK 26 14 n.a
Plastics Recycling rate % €/GJ primary €/GJ marginal (incin.)
France 5 27 38
Germany 69 39 59
Netherlands 0 n.a. n.a
UK 0 n.a n.a
Paper/board Recycling rate % €/GJ primary €/GJ marginal (incin.)
France 11 19 22
Germany 91 8 -3
Netherlands 46 4 -12
UK 0 n.a n.a
Tinplate Recycling rate % €/GJ primary €/GJ marginal (incin.)
France 45 12 n.a
Germany 77 20 n.a
Netherlands 70 4 n.a
UK 0 n.a n.a
Aluminium Recycling rate % €/GJ primary €/GJ marginal (incin.)
France 7 -1 -4
Germany 63 8 6
Netherlands 0 n.a n.a
UK 28 -12 -15
3
1998 figures
4
cost per GJ energy saved compared to the production of primary material
5
Household Plastic 1 294 1 654 152 0 300 600 900 1 200 1 500 1 800 France Germany E/t sorted Market revenues Total financing need Recycling rate Recycled quantity 12 Total expenses 69% 609 kt 5% 44 kt 1 447 1 654
Non Household Glass
19 26 7 76 0 20 40 60 80 100 F. G. NL. UK. Rate Quantity 10 10% 29% 7% 76 kt 57 kt 6 kt 25 kt E/t sorted Net expenses
Non Household Plastics
-112 -112 -112 57 -150 -100 -50 0 50 100 150 F. G. NL. UK. 10% 14% 23% 21% 71 kt 96 kt 71 kt 125 kt Rate Quantity E/t sorted Net expenses Household Glass 26 82 60 47 40 47 53 7 0 20 40 60 80 100 120 140
France Germany Netherlands United Kingdom
E/t sorted Market revenues Total financing need Recycling rate Recycled quantity 113 26% 480 kt 12 Total expenses 84% 341 kt 83% 2 705 kt 48% 1 550 kt 73 53 121
Cost of recycling Glass
T A Y L O R N E L S O N S O F R E S -Consulting _____________________________________________________________________________________________21 COST-EFFICIENCY OF PACKAGING RECOVERY SYSTEMS: THE CASE OF FRANCE, GERMANY, THE NETHERLANDS AND THE UNITED KINGDOM
(FEBRUARY 2000)
Household and Non Household, Multim aterial
146 177 191 84 97 155 134 80 0 100 200 300 F. G. NL. UK.
Incineration w ith energy recovery Disposal
n Specific patterns per material
Glass recycling generally results in low to medium costs per energy saved, due to the variation of recycling costs between countries.
Both Germany and the Netherlands achieve very high recycling rates for household packaging (83 and 84% respectively). In Germany the
costs per ton are relatively high which can partly be explained by old contracts. Additionally, the cleaning costs of the areas around the collection points are paid by DSD. In the Netherlands, the costs are low, in part because of the high population density. France has a lower recycling rate (48%) and intermediate costs. A cost-containing factor is that glass colours are not collected separately. The United Kingdom has a low recycling rate (26%) and relatively high costs, if the value of PRN is included in the calculation. A particular problem for the UK, but also true to some extent for Germany and the Netherlands, is the fact that collected glass has a high share of green glass for which there is only limited use for domestic beverages. The high costs may also reflect the need to build up additional infrastructure. In the case of glass, non-household packaging plays a minor role.
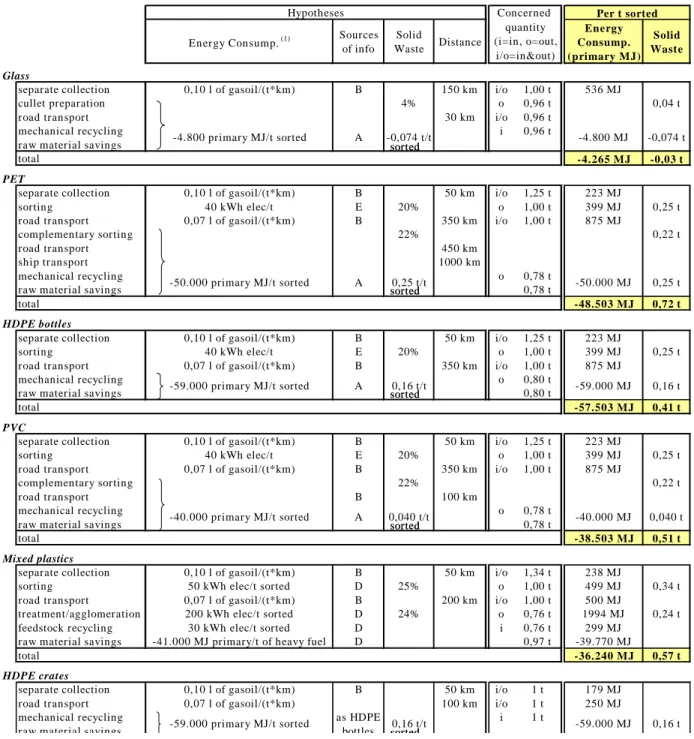
Plastics recycling results in relatively high costs per unit of energy saved. There is, however, a strong variability depending on the
composition of the material and the outlet chosen. Energy savings are highest for mechanical recycling of clean, source separated plastics fractions which substitute virgin plastic resins in the same proportion. Mechanical recycling of plastics fractions which substitute less virgin plastic resins or other materials (wood, concrete) as well as feedstock recycling (in the case the blast furnace process) result in lower energy savings. If compared to incineration with energy recovery, the energy balances of both material and feedstock recycling depend on the energy use efficiency of the alternative incineration process. In the case of highly efficient use of electricity and heat, the balances are still favourable to material recycling of PE, but not significant for other resins (PET, PVC) and may be unfavourable to feedstock recycling of mixed plastics. In the case of low efficiency of incineration, the balances are favourable to both material and feedstock recycling.
Plastics recycling from household sources seems to be relatively expensive per energy saved although still in the same rough dimension as other materials. This refers, however, to energy saving compared to virgin materials production. If the energy saving compared to alternative treatment methods such as incineration with energy recovery is considered, the relative costs will be to a certain extent higher. Plastics from household sources are collected mainly in France and Germany. The recycling rate is 69% for Germany and only 5% for France. In spite of different products (in France mainly plastics bottles, in Germany a wide range of products) and treatment methods (in Germany feedstock recycling for mixed plastics additionally to mechanical recycling for separated plastics), the costs per tonne are on the average comparable (15% lower in France).
Non-household plastics packaging waste arisings usually are slightly lower than from households. The exception is the United Kingdom where non-household sources dominate. Recycling of non-household plastics packaging waste seems to be substantially cheaper, in particular in the case of clean sources and high volumes. In many cases, it is profitable. The Netherlands and the UK recycle almost only plastics from non-household sources and reach around 20% for these sources. France and Germany have lower rates for these sources of around 10-15%.
T A Y L O R N E L S O N S O F R E S -Consulting _____________________________________________________________________________________________23 COST-EFFICIENCY OF PACKAGING RECOVERY SYSTEMS: THE CASE OF FRANCE, GERMANY, THE NETHERLANDS AND THE UNITED KINGDOM
(FEBRUARY 2000)
Cost of Recycling Paper Board
Cost of Recycling Tinplate Household Paper board 362 147 70 8 10 18 0 100 200 300 400
France Germany Netherlands
E/t sorted Market revenues Total financing need Recycling rate Recycled quantity 12 Total expenses 46% 234 kt 91% 1 416 kt 11% 114 kt 370 159 88 Household Tinplate 89 369 27 9 26 46 0 100 200 300 400 500
France Germany Netherlands
E/t sorted Market revenues Total financing need Recycling rate Recycled quantity 12 Total expenses 70% 80 kt 77% 484 kt 45% 258 kt 98 394 73
Non Household Paper Board
64 46 56 36 0 20 40 60 80 100 F. G. NL. UK. 78% 44% 75% 54% 2 201 kt 1 590 kt 730 kt 1 894 kt Rate Quantity E/t sorted Net expenses
Non Household Tinplate
-24 -23 -27 24 -50 -30 -10 10 30 50 F. G. NL. UK. 56% 98% 73% 99% 156 kt 376 kt 78 kt 182 kt Rate Quantity E/t sorted Net expenses
Cost of Recycling Aluminium Costs of Alternative Waste Treatments
Household and Non Household, Multimaterial
146 177 191 84 97 155 134 80 0 100 200 300 F. G. NL. UK.
Incineration w ith energy recovery Disposal
Household Alum inium 790 -576 915 -50 216 41 -800 -500 -200 100 400 700 1000
France Germany United Kingdom
E/t sorted Market revenues Total financing need Recycling rate Recycled quantity 12 Total expenses 28% 25 kt 63% 60 kt 7% 6 kt 165 831 338
T A Y L O R N E L S O N S O F R E S -Consulting _____________________________________________________________________________________________25 COST-EFFICIENCY OF PACKAGING RECOVERY SYSTEMS: THE CASE OF FRANCE, GERMANY, THE NETHERLANDS AND THE UNITED KINGDOM
(FEBRUARY 2000)
Paper and board recycling is in the lower to medium range of costs per unit of energy saved in relation to virgin materials
production. Again, the figures might be to a certain extent higher if compared to incineration with energy recovery. Recycling is, however, in the large majority of cases favourable in terms of energy savings.
For household sources, Germany reaches a recycling rate of 91%, the Netherlands of 46% and France of 11%. In the United Kingdom, very low quantities are collected from household sources. The costs per tonne are highest in France. This is to a large extent due to a high share of kerbside systems (with collection mixed with other materials, inducing sorting). Germany has intermediate costs. A cost advantage may be the mixed collection with newspapers, a drawback is the existence of old overpriced contracts. The Netherlands has the lowest costs per tonne, partly due to a strong involvement of charities.
Paper and board packaging waste arisings from non-household sources usually are somewhat more than double of household
paper packaging, with the exception of the United Kingdom (sevenfold). Recycling rates are 78% for France, 75% for the Netherlands, 54% for the UK and 44% for Germany. Costs are substantially lower for non-household sources, except for the Netherlands where they are comparable.
Recycling of tinplate is in the lower to medium range in terms of costs per energy saved.
The respective recycling rates for household sources are 77% for Germany, 70% for the Netherlands and 45% for France. The
costs are clearly highest in Germany where tinplate is part of the separate collection at source. Additionally, old contracts may play a cost-increasing role. In France, tinplate is mostly extracted after incineration, in the Netherlands before or after incineration of mixed municipal waste.
The distribution of tinplate between household and non-household sources varies between the countries with the extreme cases
of the UK (household is triple of non-household packaging) and the NL (non-household exceeds household packaging). Non-household tinplate is recycled to a high degree and cheaper than recycling of Non-household sources. In many cases it is profitable.
Aluminium packaging recycling is in the low range in terms of costs per energy saved or even profitable financially.
The recycling rates for household sources are 63% for Germany, 28% for the United Kingdom and 7% for France. Germany has
net costs, partly due to the wide range of collected aluminium packaging waste6 and as a consequence of old overpriced
contracts for separate collection. France has small profits from aluminium mostly collected after incineration of mixed municipal waste. The United Kingdom bring back for a fee scheme of source-separated cans (high quality aluminium) makes the highest profits.
6
1.5 Likely Developments which may Change the Position of the Various Countries in the
Near Future
n In Germany, there are old contracts concluded at a time when DSD had a very weak negotiating position. They were to a
certain degree overpriced and entail higher costs than the likely underlying “real” costs of companies charged with the collection/sorting/recycling of the material. The re-negotiation of these contracts and the development of automatic sorting could permit to lower costs in the future.
n In France, the extension of the separate collection to the whole national territory in the near future (in 1997, 1/3 of the population
was involved in separate collection) and the works undertaken to optimise collection and sorting systems will probably increase the recycling rates significantly. This may also bring down unit costs, especially for paper/board.
n In the United Kingdom, the injection of funds through the PRN system should permit to extend recycling beyond purely market
T A Y L O R N E L S O N S O F R E S -Consulting _____________________________________________________________________________________________27 COST-EFFICIENCY OF PACKAGING RECOVERY SYSTEMS: THE CASE OF FRANCE, GERMANY, THE NETHERLANDS AND THE UNITED KINGDOM
(FEBRUARY 2000)
EFFICIEN CY of the packaging waste management system in each country 1 Recovery rate Recycling rate Total Household
COST-EFFICIENCY of HOUSEH O LD packaging waste
RECYCLING • per material • total 3
COST-EFFICIEN CY of N O N H O U SEH O LD packaging waste RECYCLI N G
5
COST-EFFICIEN CY of TO TAL packaging waste RECYCLING
7
COST-EFFICIEN CY of TO TAL M A N A GEM EN T (household and non household )
9
CO STS-BEN EFITS relation of the systems implemented in the
countries for the RECYCLI N G of HO U SEH O LD packaging waste
•energy / solid waste
•per material household / t otal
•recycling 11
COST of HOUSEH O LD pack aging waste RECYCLI N G
• per material • total 2
COST of N O N H O U SEH O LD packaging waste RECYCLING • per material
• total 4
COST of TOTAL packaging waste RECYCLI N G
6
COST of TOTAL M A N A GEM ENT ( household and non household ) • recycling
• incineration with energy recovery • disposal
8
EN V I R O N M ENTAL BEN EFITS • energy / solid waste
• per material / household-non household / t otal • recycling / incineration / landfill
1 0
Assessment of the performances of the systems Intermediary calculations
Description of the Methodology Followed in the Study
N on household
Financing of GLASS household packaging recycling Who paid for what in 1998? per tonne sorted
105F/t (2) 285F/t (1) (9) 30F/t(6) 9F/t (8) (4) 150F/t(10) overhead 65F/t(4) (10) 64F/t(3) 25F/t(4) 100F/t (4) 20F/t(4) FF/t Euros/t Expenses sorted sorted
Collection Glass household packaging sorted in 1998 (4)
Transport 1 1 550kt(7)
Processing, transport 2 120 18
26kg/capita/yr
Overhead Eco-Emballages9 1 48%
Total expenses 479 73 financial flows glass flows
Market revenues waste ownership
Glass companies 310 47 (1) 90% of glass collected through a bring back system=250 F/t;
Total financing need 169 26
10% of glass through a kerbside system=600 F/t (source for cost data: TN SOFRES Consulting)
350 53
Transporters 1
Processors
Transporters 2
transport of cullet to glass companies
Glass companies Fillers &
importers crushing into cullet -containers purchase and kerbside collection minim um guaran teed take back price
transport of collected glass to processors f e e s Eco-Emballages partici pation totransp ort 1 Tax payers (household) France Local authorities subsid y ( soutie n à la tonne triée départ ) Collectors / sorters (5) -bottle bank purchase and emptying waste management tax
Glass 0 20 40 60 80 100 0 20 40 60 80 100 Recycling rate (%) France Germany The Netherlands The United Kingdom
F G UK NL Total 0 50 100 150 200 250 300 350 0 20 40 60 80 100 Recycling rate (%) France Germany The Netherlands The United Kingdom
F G UK NL C O S T - EFF IC IE N CY EFF IC IE NCY CO S T S -BENEFIT S RELATION CO S T E NVIRONMENTAL BE N EF ITS
T A Y L O R N E L S O N S O F R E S -Consulting _____________________________________________________________________________________________29 COST-EFFICIENCY OF PACKAGING RECOVERY SYSTEMS: THE CASE OF FRANCE, GERMANY, THE NETHERLANDS AND THE UNITED KINGDOM
(FEBRUARY 2000)
2.1 Objective and Scope of the Study
n Directive 94/62/EC on packaging and packaging waste has been implemented in national law for every Member State except
Greece. These implementations have led to different types of national packaging waste recycling organisations (recycling targets, collection systems, financing rules… ).
The objective of this study is to carry out a cost-efficiency analysis of recycling in four countries, including the comparison with alternative treatment routes (incineration with energy recovery, disposal). Packaging waste from both household and non-household sources is covered. The analysis is carried out on a per material basis (glass, plastics, paper-board, tinplate, aluminium).
The study aims at assessing the situation of packaging recycling in a country at a point in time without separating the effect of the implementation of the Directive on recycling. Therefore, it also includes recycling which was carried out before the Directive was implemented.
n The term “packaging recovery systems” has been interpreted in a wider sense (i.e. not focusing only on particular compliance
schemes such as DSD, Eco-Emballages, SVM-Pact, Valpak or Biffpack and the PRN system) but on the way both recycling and recovery are organised and financed in the four countries.
n The national schemes chosen in collaboration with the European Commission are those of France, Germany, the Netherlands
and the UK.
n These four national schemes are very different for the following reasons:
• the contrasted waste management contexts before the implementation of the directive and country specificities: density of
population, importance of reuse, recycling habits, proportion of population already involved in separate collection programs, importance of incineration, landfill limitations…
• the different philosophies of implementation:
– an approach based on agreements with industry and municipalities focussing on low-cost sources of packaging materials in
the Netherlands,
– an administrative approach in France and Germany based on setting a relatively detailed legal framework differentiating
between household/sales and non-household/non-sales packaging,
• the different forms of financial organisation, in particular for household packaging waste:
– “green dot” systems in Germany and France,
– PRN system in the UK,
– financing via municipalities and industry in the Netherlands.
n Each national scheme has been analysed according to three criteria: performance, costs and benefits.
• Performances of the systems (chapter 3): recycling and recovery rates split between household and non household packaging
waste and per material.
• Costs:
– cost of household packaging waste recycling per material (chapter 4),
– cost of non household packaging waste recycling per material (chapter 5),
– cost of packaging waste management as a whole, including all types of packaging and all types of treatment routes such as
recycling, incineration with energy recovery, incineration without energy recovery, landfill (chapter 6).
• Benefits: energy consumption and solid waste arising (chapter 7).
n Scope of the study:
• Total packaging waste: household and non household.
• Total current recycling in the country, whether it has been developed after the Directive or was pre-existing.
• Benefits: environmental benefits are assessed in terms of energy consumption.
• Costs: the system studied stops at the gate of the companies7 which use the sorted or processed materials to make a final
product.
The cost analysis performed is close to the methodology of value-chain analysis: the various financial flows (costs and revenues) have been shown for each single step from collection to recycling.
T A Y L O R N E L S O N S O F R E S -Consulting _____________________________________________________________________________________________31 COST-EFFICIENCY OF PACKAGING RECOVERY SYSTEMS: THE CASE OF FRANCE, GERMANY, THE NETHERLANDS AND THE UNITED KINGDOM
(FEBRUARY 2000)
Three types of costs were considered:
• The total cost: all costs from collection until the gate of a factory producing a final product.
• The “financing need”: total costs minus revenues from the sale of sorted materials.
This is the amount of financial injections necessary to render recycling profitable from a recycler’s point of view. Since the
“financing need” essentially corresponds to the amount covered by packaging recovery systems (in the wider sense, i.e. including contributions by the tax payer), this study mainly focuses on this type of costs and the way it is shared between the various actors.
• The net costs comparing the “financing need” with alternative waste management options.
Obviously, waste that is not recycled must be treated in alternative waste management options (incineration with energy
recovery or disposal8). Therefore, from the point of view of the waste holder as well as consumer/tax payer, spending funds for
recycling is cheaper if the avoided waste treatment costs are higher than the “financing need” for recycling. Within the framework of this study, no such net costs were calculated due to difficulties to distinguish between fixed and variable costs for alternative waste treatment methods. Fixed costs occur independently from waste quantities. For example, local authorities cannot always optimise the organisation of residual waste collection (adjustment of containers, of the collection circuit, of manpower) in parallel with the development of separate collection due to management constraints (characteristics of existing equipment… ). In the case of incineration, the decrease in the total amount of waste incinerated can push up unit costs as a consequence of an under-utilisation of the incinerator if the recycled waste is not replaced by other sources. Additionally, it is difficult to allocate waste treatment costs per material due to different specific weights and other characteristics.
8
2.2 Methodological Issues
n The study initially focused on checking available literature but it soon turned out that additional enquiries at both national and
European levels were necessary to complete and cross check data.
The purpose of the cost analysis is to show the various financial flows in a transparent way. By analysing the costs and revenues of each single step from collection to recycling and recovery, it becomes possible to define particular services (e.g. recycling of 1 kg of glass including collection, transport, grinding, minus revenue from sales to glass plant). The costs of these services can then be compared between the various countries independently from the different financing structures. This type of analysis is very close to the methodology of value-chain analysis.
It has, however, not always been possible to identify the real cost of the services. For Germany, we have taken into account the prices paid by DSD without assessing the real costs of operations. In the case of the UK, we only considered the absolute PRN amount irrespective of the real cost of the operations they are supposed to cover. In France, the costs are not real prices paid to the operators, but calculated costs with a theoretical approach (based on studies with local authorities).
The same methodology also was applied to non-household packaging waste recycling. However, the degree of uncertainty of available data is far higher than for household packaging. Therefore, the presented figures need to be seen as giving an order of magnitude rather than concrete numbers.
The costs quoted include the margin of operators.
n The evaluation of the situation in the UK is difficult given:
• the newness of the system: the packaging waste scheme has been running fully for the first year in 1998,
• the originality of the system, with a decentralised approach and the use of PRNs (Packaging Recovery Note) to inject extra
financing in the system.
As a consequence, the situation in the UK varied a lot over the year 1998 (PRN prices, sorted materials prices, organisation of collection… ) and it is difficult to give a representative picture of the system. In addition, the system still needs to be fine tuned and it is hard to judge the effectiveness of the economic tools put in place (PRNs) towards an increase of recycling. In particular, the way PRN financing is used by reprocessors remains uncertain and there is no evidence today that recycling capacity increased in the UK in 1998.
n Given the lack of reliable data, cost assessments rely on several hypotheses. As a consequence, the accuracy of the cost
values can be considered to be within a range of 10% to 15% for household packaging. For non-household packaging, the accuracy may be much lower.
T A Y L O R N E L S O N S O F R E S -Consulting _____________________________________________________________________________________________33 COST-EFFICIENCY OF PACKAGING RECOVERY SYSTEMS: THE CASE OF FRANCE, GERMANY, THE NETHERLANDS AND THE UNITED KINGDOM
(FEBRUARY 2000)
3. C
URRENT
S
ITUATION OF THE
4 C
OUNTRIES COMPARED WITH
Directive 2001
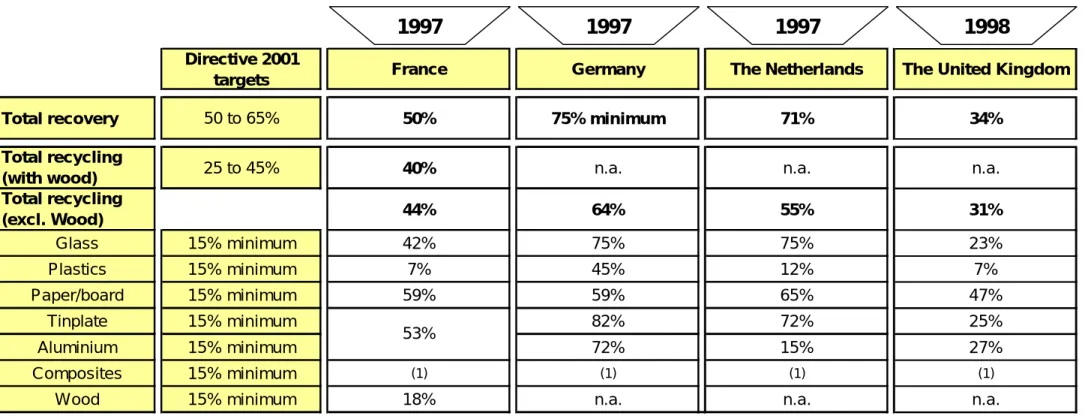
targets France Germany The Netherlands The United Kingdom
Total recovery 50 to 65% 50% 75% minimum 71% 34%
Total recycling
(with wood) 25 to 45% 40% n.a. n.a. n.a.
Total recycling (excl. Wood) 44% 64% 55% 31% Glass 15% minimum 42% 75% 75% 23% Plastics 15% minimum 7% 45% 12% 7% Paper/board 15% minimum 59% 59% 65% 47% Tinplate 15% minimum 82% 72% 25% Aluminium 15% minimum 72% 15% 27% Composites 15% minimum (1) (1) (1) (1)
Wood 15% minimum 18% n.a. n.a. n.a.
(1) Included in paper/board and metals n.a. non available
Source of data: official data transmitted to the European Commission for France, Germany and the Netherlands; several sources for the United Kingdom (see tables A1, A2, A3 and A4 in appendix 1)
Table 1: Current situation - Total packaging waste recycling and recovery
53%
T A Y L O R N E L S O N S O F R E S -Consulting _____________________________________________________________________________________________35 COST-EFFICIENCY OF PACKAGING RECOVERY SYSTEMS: THE CASE OF FRANCE, GERMANY, THE NETHERLANDS AND THE UNITED KINGDOM
(FEBRUARY 2000)
3.1 Current Situation for Total Packaging
(table 1)
n 2001 directive targets for recycling:
• Total packaging (25 to 45%): reached by all 4 countries,
• Per material (15% minimum): main problem for plastics (except Germany).
n 2001 directive targets for recovery (50 to 65%):
• Reached by the 3 countries where waste incineration is well developed,
• Problems for the UK where there are very few incineration plants.
n Remarks concerning the reliability of the figures:
• Different sources of information:
– Official national data transmitted to the European Commission for 1997 (for total household and non household packaging),
– Several national reports regarding the split between household and non household packaging waste (see tables 2 and 3in
the next pages),
– Annual reports,
– Hypotheses regarding non sales packaging recycling rates for Germany (e.g. non sales packaging consumption are
calculated by difference between total and sales packaging consumption coming from different information sources),
– …
• Monitoring systems not yet fully operational in the countries:
– New system in the Netherlands since 1998,
– Data coming from all the packaging chain in the UK, which multiply the difficulties to assess exports which have not to be
taken into account,
– Difficulties to split collected papers between packaging and non packaging, particularly in the Netherlands,
– Difficulties to assess the quantities of household packaging put on the market and the quantities collected outside of the
compliance schemes in France and Germany.
• Different calculation rate (out of packaging consumption, out of packaging waste).
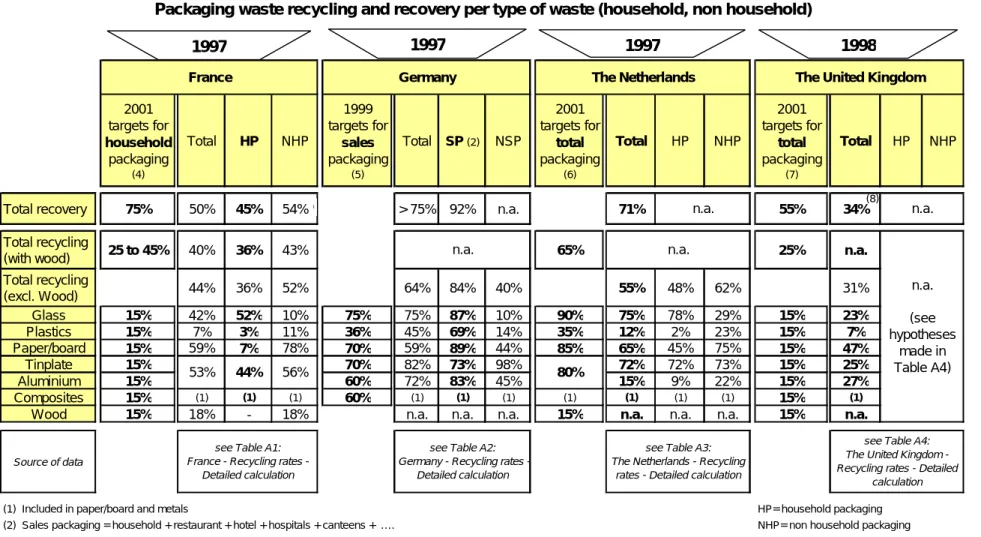
Total Household packaging Non household packaging Total Sales packaging (2) Non sales packaging Total Household packaging Non household packaging Total Household packaging Non household packaging Total recycling
(excl. Wood) n.a. 44% 19% 25% 64% 46% 18% 55% 23% 32% 31%
Glass 15% mini 42% 40% 2% 75% 73% 2% 75% 74% 1% 23%
Plastics 15% mini 7% 2% 5% 45% 39% 6% 12% 1% 12% 7%
Paper/board 15% mini 59% 2% 57% 59% 29% 29% 65% 15% 50% 47%
Tinplate 15% mini 82% 46% 36% 72% 33% 40% 25%
Aluminium 15% mini 72% 71% n.a. 15% 5% 10% 27%
Composites 15% mini (1) (1) (1) (1) (1) (1) (1) (1) (1) (1)
Wood 15% mini 18% - 18% n.a. n.a. n.a. n.a. n.a. n.a. n.a.
(1) Including in paper/board and metals
(2) Sales packaging = household + hotel + hospitals + … . n.a. non available
53% Directive
2001 targets
The United Kingdom
n.a.
(see hypotheses made in table A4)
The Netherlands
n.a.
Table 2: Current situation
Split of the total packaging recycling rate between household and non household packaging
France Germany
see Table A4:
The United Kingdom - Recycling rates - Detailed calculation
Source of data
see Table A2:
Germany - Recycling rates - Detailed calculation
see Table A3:
TheNetherlands - Recycling rates - Detailed calculation see Table A1:
France - Recycling rates - Detailed calculation
T A Y L O R N E L S O N S O F R E S -Consulting _____________________________________________________________________________________________37 COST-EFFICIENCY OF PACKAGING RECOVERY SYSTEMS: THE CASE OF FRANCE, GERMANY, THE NETHERLANDS AND THE UNITED KINGDOM
(FEBRUARY 2000)
3.2 Current Situation per Type of Packaging: Household / Non Household
(table 2)
n As a consequence of the different philosophies adopted in the countries (see §4.2), the contribution of household and non
household packaging waste to the recycling rate is different in the 4 countries:
• UK: more non household than household packaging waste recycled (except for glass and aluminium),
• The Netherlands: more non household than household packaging waste recycled (except for glass due to the fact that non
household glass packaging is mostly multi-way packaging),
• Germany: more sales9 packaging waste (household + hotel + hospitals… ) is recycled than non sales (except for paper/board10),
• France: balanced situation (due to household glass and non household paper/board).
9
The term sales packaging as used in Germany (household + hotel + hospitals etc.) differs from the Community definition of sales packaging (packaging conceived so as to constitute a sales unit to the final user or consumer at the point of purchase)
10
The low figures for non sales packaging are somewhat astonishing compared to the otherwise high figures for Germany and should be verified. However, for the purpose of this study, no other data were available