www.afm-journal.de
Prof. F. von Stetten, Dr. S. M. Früh Hahn-Schickard
Freiburg 79110, Germany Prof. G. A. Urban
FMF - Freiburg Materials Research Centre University of Freiburg
Freiburg 79104, Germany Dr. F. Güder
Department of Bioengineering Imperial College London London SW7 2AZ, UK Prof. A. Merkoçi
Catalan Institute of Nanoscience and Nanotechnology (ICN2) CSIC and The Barcelona Institute of Science and Technology Barcelona 08193, Spain
Prof. A. Merkoçi ICREA
Barcelona 08010, Spain
Integrated Devices for Non-Invasive Diagnostics
Hatice Ceren Ates, Anna Brunauer, Felix von Stetten, Gerald A. Urban, Firat Güder,
Arben Merkoçi, Susanna Maria Früh, and Can Dincer*
“Sample-in-answer-out” type integrated diagnostic devices have been widely recognized as the ultimate solution to simplify testing across healthcare sys-tems. Such systems are equipped with advanced fluidic, mechanical, chemical, biological, and electronic components to handle patient samples without any manual steps therefore have the potential to accelerate intervention and improve patient outcomes. In this regard, the combination of integrated devices and non-invasive sampling has gained a substantial interest to further improve the comfort and safety of patients. In this Review, the pioneering developments in integrated diagnostics are covered and their potential in non-invasive sam-pling is discussed. The key properties of possible sample types are highlighted by addressing their relevance for the clinical practice. Last, the factors affecting the transition of integrated devices from academia to the market are identified by analyzing the technology readiness levels of selected examples and alterna-tive remedies are explored to increase the rate of survival during this transition.
DOI: 10.1002/adfm.202010388 H. C. Ates, Dr. C. Dincer
FIT – Freiburg Centre for Interactive Materials and Bioinspired Technology
University of Freiburg Freiburg 79110, Germany E-mail: dincer@imtek.de
H. C. Ates, Prof. G. A. Urban, Dr. C. Dincer Laboratory for Sensors
IMTEK – Department of Microsystems Engineering University of Freiburg
Freiburg 79110, Germany
A. Brunauer, Prof. F. von Stetten, Dr. S. M. Früh Laboratory for MEMS Applications
IMTEK – Department of Microsystems Engineering University of Freiburg
Freiburg 79110, Germany
to access the dynamic physiological state of the body and thus, improve patient’s outcome.
These contemporary instruments deployed in specialized central laboratories are not always accessible for continuous preventive monitoring; their utilization is generally limited to reactive healthcare. Integrated devices aim to miniaturize the analytical processes followed in the central laboratories in a cost-effective manner by incorporating fluidic, electronic, mechan-ical, and chemical components within a single unit. The philosophy of the inte-grated design aims to unify the sample collection, preparation, analysis and post-processing to enable the “sample in– answer out” testing required for distributed proactive healthcare. In this regard, non-invasive sampling offers an easy access to the physiologically relevant biomarkers with minimum discom-fort and supervision. In the clinical practice, however, there are many uncertainties regarding the diagnostic correspondence of the measured concentrations in non-invasive samples and how these concentrations are correlated to the more familiar
blood-based counterparts.[2,3]
In this review, we will assess the potential of eight different sample types (sweat, tear fluid, saliva, urine, breath, stool, seminal fluid, and swab specimen) that could be collected
1. Introduction
An ancient physician had to rely on perceptible observations while examining a patient. This process might occasionally be accompanied by some ingenious tests such as the diagnosis of diabetes mellitus from the attraction of black ants to the “honey
urine”.[1] Since then, the diagnostic tools in the clinical practice
have extended well beyond the five human senses with the addi-tion of advanced imaging techniques and chemical analysis of bodily fluids. These new methods have strengthened the ability
The ORCID identification number(s) for the author(s) of this article can be found under https://doi.org/10.1002/adfm.202010388. © 2020 The Authors. Advanced Functional Materials published by Wiley-VCH GmbH. This is an open access article under the terms of the Creative Commons Attribution License, which permits use, distribution and reproduction in any medium, provided the original work is properly cited.
www.afm-journal.de www.advancedsciencenews.com
non-invasively and analyzed within the scope of integrated diagnostic devices. We will describe the composition (also known as “matrix”) and secretion/production mechanisms of each sample type to explore their compatibilities with sample-to-answer diagnostic methods. We will examine a series of diag-nostic technologies at different technological maturities from the fundamental research phase to commercialization stage. We will further discuss the factors influencing the translational success of “sample-to-answer” diagnostic devices by utilizing the technology readiness level (TRL) concept and highlight the common pitfalls and possible remedies.
2. Assembling an Integrated Device
An integrated device is a platform that combines the funda-mental building blocks of a process to convert the input variables into a desired outcome within a self-confined environment. In the case of point-of-care (POC) testing, an integrated diagnostic device may include different combinations of components for sample handling, recognition elements, signal processing and transmission units, power supplier, and decision-making unit (DMU). The extent of complexity of each unit as well their assembly depends on the analyte of interest and the goal of the measurement (qualitative/quantitative and single-shot/con-tinuous), which in turn dictates the possible sample types to be used for the desired task (blood, tear, saliva, urine, etc.). In the following, we will provide a holistic view on how this assembly may be configured for different diagnostic purposes.
2.1. Material of Construction
There is no ultimate “all-in-one” material that can meet the fundamental requirements of various applications being developed under the integrated device concept, hence each specific task still requires a tailored material. In accordance, the decision-making process starts with the selection of the “right”
construction material.[4]
The first input here is related to the selected sample type (tear, urine, etc.) for the analyte (i.e., glucose) and its measurement strategy. The primary concerns differ significantly for a single-use, disposable device, and a platform for continuous moni-toring. For example, while biocompatibility is a serious concern for a contact lens (CL) integrated glucose sensor, it is not a pri-ority for a disposable, paper-based urinalysis for the same the analyte. In the latter, choosing a biodegradable material is more likely to become a design goal due to the environmental
con-cerns.[5] In general, the physical requirements of a continuous
monitoring platform are much more extended compared to disposable alternatives and must provide certain levels of flex-ibility and durability to be successfully integrated into the daily life of the users. Therefore, in addition to the analyte selection, measurement strategy must be set priorly. The second step is to identify the possible techniques for the signal detection. Physical requirements of different methods would necessitate different/ additional properties from the sensing platform such as optical access, stretchable electronics, and microfluidics. Based on these concerns and limitations, possible materials and the cor-responding manufacturing technologies should be outlined.
2.2. Measurement Unit
The core of the integrated sensing platform is the measurement unit, where the analytes interact with the recognition element. These interactions are mainly converted into an electrochem-ical or optelectrochem-ical signal by the transducer, which is then traced by a detector unit. If necessary, transducer signals may be enhanced by an amplifier before passing to the detector.
Recognition elements could be selected from a variety of options with two distinct origins. Natural recognition ele-ments are isolated directly from living organisms or bio-synthesized. The most frequently used bioreceptors include nucleic acids, enzymes, antibodies, membranes, bacterio-phage, organelles, and cells. Although they are highly specific and easy to produce at small scales, their mass production could be difficult and expensive at industrial scale. Further-more, they exhibit batch-to-batch variations, low stability, and poor performance under non-physiological conditions. The other alternative is the artificial bioreceptors such as aptamers, molecularly imprinted polymers, supramolecular
receptors, synthetic peptides and macrocycles.[4,6,7] Unlike
their natural alternatives, they are more compatible with mass production, offer high affinity, and improved stability. Nevertheless, the development of a particular product is resource intensive requiring high capital investment and spe-cialized personnel.
The next issue is the implementation of the selected recog-nition elements and all related reagents into the measurement unit. If the integrated platform is developed for multiple and/or continuous measurements, the supply of the key compounds must be ensured for the successful operation. For stationary integrated platforms, auxiliary units for reagent storage, release,
and manipulation can be included.[8–10] In this context,
imple-mentation of microfluidics and automated flow control can help the realization of self-contained devices. However, such an approach is not practical for mobile or wearable configurations. In this case, label-free, wash-free strategies can be followed to bypass the need for delivery of reagents and buffers. As an alternative, disposable measurement units may be utilized to
circumvent the regeneration issue.[7]
The functionality of the measurement unit may also be extended to multimodal/multiplexed sensing to improve the overall reliability of the system by i) reducing the false positives, ii) providing multiple outputs to assess the physiological state, and iii) providing the data for active calibration and correction. This can be achieved by mounting different transducer types and/or measuring multiple analytes on the same platform simultaneously.
2.3. Decision-Making Unit
The signal generated by the transducer(s) is converted into information in the DMU. Depending on the desired level of details (single/multi-measurements, single-shot/continuous, qualitative/quantitative), DMU may consist of optical modules, color charts and rulers, potentiostats, thermometric sensing devices, data storage and transmission units, integrated pro-cessors, and external auxiliary devices such as smartphones. If continuous monitoring is desired, the following questions
must be answered before finalizing the sheaves of sub-compo-nents: i) Should the platform perform on-device-evaluation or raw/intermediate data is to be transferred out? ii) What should be the data acquisition and reporting frequency? iii) Is there a need for data storage? and iv) How is the power management handled?
In the case of on-device-evaluation, transmitted signal(s) must be processed, corrected, converted into meaningful infor-mation, displayed, and/or transmitted to the end-user. This policy would require an integrated decision unit (i.e., processor) while the burden on the data storage and transmission unit may be reduced. For external evaluation (smartwatch/phone, PC, cloud-based systems), the integrated device may follow a smart data transmission scheme where the data is filtered, corrected (cross-correlation) and converted. This approach would reduce the volume data to be transferred yet also necessitates an inte-grated decision unit. Alternatively, the raw (for example, current, voltage, light intensity) or intermediate (pH, concentration, tem-perature) data can be transmitted without any diagnostic tags.
Data acquisition and reporting frequency strongly depend on the diagnostic role of the integrated platform. If the collected data is interpreted via benchmarking with the already existing databases and clinical models (such as diabetes, vitamin defi-ciency), volume of the transferred data may be reduced, as the decision-making process is fundamentally an “interpola-tion” problem (i.e., where the individual measurement stands with respect to the population). If the integrated platform is designed with the scope of an individualized scheme, data collection frequency must be sufficient enough to perform data-driven regression analysis (i.e., how the analyte concentration is changing with respect to the individual metabolism). A prac-tical example for the latter is the therapeutic drug management, where the measured drug concentrations are processed to gen-erate an individualized pharmacokinetic/pharmacodynamics
models for the patient.[11] Utilization of artificial intelligence (AI)
and cloud-based data storage in this frame is becoming a virtual component of the integrated platforms in order to process large
amount of data for pattern recognition and model abstraction.[12]
Another important component of the integrated platform is the power unit, the size of which is typically determined by the DMU. Depending on the previous answers to the above-raised questions, the power demand of the integrated platform can be estimated and a power supply strategy (simple storage,
flex-ible batteries, solar or biofuel cells, hybrid systems[5,13,14]) must
be chosen.
3. Potential of Non-Invasive Sampling
in Integrated Devices
Considering the opportunities offered by non-invasive sam-pling to access the physiologically relevant biomarkers with minimum discomfort and supervision, in this section, we will elaborate on the usage of eight potential sample types within the frame of integrated diagnostic platforms. We will i) examine the analyte types and their transport mechanism in different samples, ii) discuss the operational challenges to process these analytes, ii) assess the current state-of-the-art by going through the recent literature.
3.1. Sweat
Sweat-based diagnostics have become a part of clinicians’ toolbox since the 1950s, which have recently gained a significant momentum, particularly in the field of fitness monitoring. The main driving force behind this attention is its rather convenient accessibility through widely distributed sweat glands across the body, which makes it a suitable medium for integrated non-invasive sensing. Nevertheless, its unique secretion mechanism still hinders the successful transition of sweat-based sensors into practice. The only noticeable clinical achievement is the
cystic fibrosis (CF) screening.[15]
The sweat secreted by the eccrine glands carries the physi-ologically relevant biomarkers from blood to the accessible skin surface for continuous monitoring via electroosmosis, which induces a pulsatile advective flow within the sweat duct. This discrete transport mechanism leads to a time lag and temporal discontinuity for sweat-based analysis compared to blood/ interstitial fluid, hampering the possibility of instantaneous monitoring. Another issue related to the analyte transport is the presence of tight protein junctions along its path. These proteins act like a transport barrier as they filter the large bio-markers and selectively reduce their concentrations along the paracellular route. In other words, a correlation factor must be identified for each analyte to link the measured values with the sweat gland concentrations in the dermis. In addition to this passive filtering, analyte transport is also influenced by the lipo-philicity/hydrophobicity of the compounds as well as the pos-sibility of tight junction remodeling allowing the advection of
large analytes.[16,17] This dynamic nature of sweat secretion is
not fully understood for most analytes and needs to be tackled before realizing the full potential of the sweat-based sensors. This difficulty is reflected in the available studies and commer-cial platforms (Figure 1), where the focus is usually on some fit-ness indicators such as ion concentrations (sodium, potassium, chloride) and rate of sweat loss, rather than the quantitative analysis of specific biomarkers for diagnostics.
Fitness monitoring avails of the wearable concept, which enables the continuous monitoring of various analytes in sweat via exercise-induced sampling. The underlying technology usu-ally relies on electrochemical sensing where a printed circuit board (sensing element) is integrated with a microfluidic patch. In this ecole, multiplexed sensing is not uncommon and cur-rent platforms are now offering quantitative and simultaneous analysis of sweat ions, glucose, lactate, sweat rate, and physi-ological parameters such as pH, body temperature, and heart
rate.[15,18–29] The alternative approach utilizes the optical sensing
that can be deployed in the form of patches, integrable textiles,
and tattoos.[2,16,17] Colorimetric analysis is also compatible
with multiplexing and has been successfully implemented for
the detection of similar analytes.[30–33] Despite their
quantita-tive nature, the overall focus of either approach is to provide information on the general state of the body, energy metabo-lism, and the hydration state. For instance, quantitative glucose monitoring in this context refers to the analysis of diet and exercise-induced changes and does not aim for a smart, non-invasive diabetes management.
Nevertheless, some important steps have been taken towards the utilization of sweat-based sensors (Figure 1) for the diagnostic
www.afm-journal.de www.advancedsciencenews.com
applications.[23,27,30–42] In glucose monitoring, recent
achieve-ments include the increased capability of detecting small
variations in glucose concentrations after fasting/oral uptake,[43]
preliminary investigation of the blood-sweat correlation[27] and its
comparative analysis between the healthy and diabetic subjects.[39]
Another important progress is the development of integrated
sen-sors for the CF diagnosis,[15,26,27,34] where the concept has been
shown to be in agreement with the conventional laboratory
bio-assays.[15] Gout monitoring is experiencing a similar evolutionary
pattern: gaining the ability to distinguish healthy individuals from the patients and correlating the sweat analyte
concentra-tions with those in serum.[36] Benchmarking with a gold standard
method is another important milestone demonstrating the reli-ability of an integrated platform, which has been, for instance,
recently achieved for continuous cortisol screening from sweat.[37]
Sweat-based sensing platforms have made a significant progress in device miniaturization, integration, multiplexing,
signal processing, data transmission, and post-processing.[4,46]
In addition to the developments in the hardware design, there are also important lessons learned through this experience, which reveals the challenges originate from the inherent prop-erties of sweat. One important observation is that the concen-tration of any analyte in sweat is influenced by internal and external factors such as sweat rate, body temperature, pH, and the presence of other compounds. Therefore, accurate and sensitive measurement of the analyte necessitates precise (and additional) information about the instantaneous meas-urement landscape. As a result, multiplexed sensing becomes inevitable to represent these interdependencies accurately and to capture the true physiological state of the body. Another
Figure 1. Integrated diagnostic devices for sweat analysis. A) Battery-free hybrid microfluidic device for electrochemical, colorimetric, and volumetric sweat analysis. Reproduced with permission.[26] Copyright 2019, American Association for the Advancement of Science. B) Laser engraved wearable device for
uric acid and tyrosine detection for gout and metabolic disorders monitoring. Reproduced with permission.[36] Copyright 2020, Nature. C) Self-powered
smartwatch for semi-quantitative continuous glucose monitoring. Reproduced with permission.[40] Copyright 2019, American Chemical Society. D)
Skin-interfaced microfluidic system that can captures sweat rate and electrolyte concentration to provide personal sweat profile. Reproduced with permis-sion.[44] Copyright 2020, American Association for the Advancement of Science. E) Waterproof sweat patch for sweat collection, biomarker analysis, and
thermography in aquatic settings. Reproduced with permission.[32] Copyright 2019, American Association for the Advancement of Science. F) Iontophoretic
tattoo-based sensing for alcohol monitoring. Reproduced with permission.[45] Copyright 2019, American Chemical Society. G) Multifunctional microfluidic
system for colorimetric measurement of sweat parameters and temperature. Reproduced with permission.[30] Copyright 2019, American Chemical Society.
H) Smart ring can track the key signals from the body like heart rate, heart rate variability, temperature which has been recently offered by NBA to the players for “early illness detection monitoring” during coronavirus pandemic. Reproduced with permission.[21] Copyright 2020, OuraRing.
important deduction is related to the low secretion rates of eccrine sweat, which usually dictates a need for sweat stimu-lation. Fitness monitoring bypasses this challenge inherently while other diagnostic applications have to rely on chemical or physical stimulation. Nevertheless, such attempts may interfere with the secretion mechanism complicating the cor-relation problem or may simply create discomfort hindering the success of application, which was the case for GlucoWatch, an FDA-approved glucose monitoring device withdrawn from
the market in 2007.[47] Above all, the nonlinear dependency
between the sweat and blood concentration has to be estab-lished and clinically validated for any analyte of interest, before its appearance on the market as an end-use product.
3.2. Tear Fluid
A wide range of ions, big and small molecules can diffuse into tear through the blood-tear barrier including proteins, lipids, glycoproteins, hormones, electrolytes, nucleic acids, and glucose. This diffusion process, in principle, underpins the correlation between the blood and tear compositions. It also acts like a transport barrier which eases the analysis of the sample by filtering the blood cells and reducing the matrix effect. This transport resistance, however, also decreases the
concentrations of analytes compared to their blood levels.[48,49]
The other major intricacy is related to the dynamic secretion mechanism of tears, which affects both the tear constituents and their concentrations. Basal tear fluid, which forms the per-ennial protecting film covering the eye, is the most probable candidate for analyte monitoring as it is continuously in contact with the blood through the diffusion barrier. Nevertheless, the conventional approach (Schirmer strips) stimulates the reflex tears during the sampling and inevitably change the analyte concentrations due to the differences between the compositions and the secretion rates of basal and reflex tears. This difference further complicates the already unknown blood-tear correlation by introducing another variable into the equation (reflex tear
flow rate and its composition).[11] The alternative is to collect the
basal tears directly by using microcapillary tubes. In this case, however, trained personnel are required to mitigate any cor-neal damage and the collectible sample volume is quite limited
(less than 5 µL).[1] Furthermore, neither of these approaches can
be used for continuous, long-term disease monitoring such as diabetes since they only allow discrete sampling.
Integrated sensing can answer the need for the long-term, continuous, on-site monitoring of basal tears, bypassing the difficulties of self-sampling and low-volume constraint. In this regard, utilization of CL is the “Columbus’ egg” of integrated sen-sors, which are already adapted for daily life. CLs are easy-to-use, disposable, and wearable for extended durations (due to the high
oxygen permeability).[50] The early examples of CL-based sensors
were primarily focused on quantifying glucose in tear,[51,52] which
is still a hot topic after two decades of fundamental research. The most recent developments include the possibility of multiplexed
sensing,[53] utilization of advanced transparent soft materials and
wireless, real-time data transmission without an external power
source,[54] and integration of photonic nanostructures with
com-mercial CLs for smartphone-assisted optical sensing.[55] One
conspicuous initiative on the integration of miniaturized elec-tronics with CLs for glucose sensing is the Google-Novartis part-nership initiated in 2014. Nevertheless, the project was halted after 4 years due to the challenges experienced in accurate and reliable tear glucose measurements and insufficient consistency
between the blood-tear glucose concentrations.[49] Another focus
of CL applications is the measurement of ocular pressure for the diagnosis of the glaucoma (Figure 2C), which has been recently
commercialized.[56] The device (SENSIMED Triggerfish) consists
of a telemetric CL sensor and an adhesive antenna wired to a recorder, which operates similar to the Holter monitor. There are also other platforms in addition to CLs at various technological maturities including paper-based sensors for qualitative
diag-nosis of dry eye disease,[57,58] microfluidic integrated eyeglasses
(Figure 2D) for electrochemical detection of alcohol[59] and
wear-able spring-like electrochemical sensor for glucose monitoring (Figure 2B).[60]
The difficulty in tear-based analysis is the scarcity of the basal tear, through which, in principle, a blood-tear correlation can be established. This constraint dictates the measurements to be per-formed over the eye. Hence, both the sensing element and the data transmission unit must be kept in a delicate environment for extended periods of time. From an application point of view, it implies that all elements must be biocompatible, stable, energy-efficient, stretchable, and miniaturized without compromising the sensitivity. Even this technical barrier is overcome, a greater quest is waiting to be challenged, that is, the in-vivo evaluation of the developed platform on human subjects, ideally including the validation studies for the tear-blood correlation. Finally, all these efforts should evolve into an affordable end-product.
3.3. Saliva
Saliva offers a direct but complex non-invasive path to measure the blood concentrations of many analytes that can be utilized to trace the immunological state of a patient. Its complexity is a result of its origin; a mixture of protein-rich secretions from various glands (salivary, bronchial, and nasal), entrained epi-thelial cells and microfauna, blood-derivatives due to gingival bleeding and exogenous biological, non-biological, organic,
and inorganic impurities.[61] This intricate nature and the low
concentrations of biomarkers are the Achilles’ heel of salivary diagnostics in a quantitative scheme.
Presence of a biomarker, as well as its concentration, is strongly influenced by both the sample collection strategy (whether it is stimulated or not) and the sampling method (passive drooling, spitting, swabs, dried saliva spots, or micro-extraction). Furthermore, inherent properties of biomarkers alter the stability of the compound in its native medium and pre-treatment of the sample may be required, such as the addition of protease inhibitors to reduce protein degradation. Therefore, possible interferences and undesired side reactions should be taken into account for each analyte during the pre-treatment, storage, and transportation steps. Integrated sensors, on the other hand, alleviate these challenges by introducing a single-step, sample-in-answer-out approach, which has found its way into practice as either on-the-spot sensing platforms or portable devices.
www.afm-journal.de www.advancedsciencenews.com
On-the-spot approach implies the utilization of wearables, which made their first appearance with mouth guards inte-grated with electrochemical sensors. One of the early examples is the real-time monitoring of uric acid in saliva (Figure 3E),
which can be used as a biomarker for the renal disorders.[62]
Recently mouth guard applications for the measurement of saliva glucose via well-established glucose oxidase reaction ena-bling sensitive detection in the clinically relevant range have
been reported.[63,64] A very similar design has also been utilized
for the diagnosis of degenerative cell changes such as
Alzhei-mer’s disease.[65] One recent study has followed an alternative
path by deploying a different sensing approach, which relies on the colorimetric measurement using a disposable microfluidic
paper-based sensor.[66] Functionalized paper is placed into the
mouth guard, where the color change in glucose and nitride zones indicates the concentration of each analyte, respectively.
In addition to the mouth guards, there are also other on-the-spot sensing applications (Figure 3), where the integration notion is interpreted differently. Recent examples include i) glucose detection via toothbrush integrated non-enzymatic
sensor,[67] or ii) via printable organic thin-film transistors,[68]
ii) tooth-mounted multiplexed sensor capable of measuring
alcohol content, pH, temperature, salinity, and sugar level,[69]
iv) pacifier-integrated enzyme-based electrochemical sensor
for real-time health monitoring in infants[70] v)
smartphone-assisted cortisol monitoring,[71] and vi) the dental retainer
on which sodium intake is continuously measured by hybrid electronics.[72]
Portable integrated platforms are another alternative to the commonly used mouth guard approach, where the extrac-tion, delivery, and measurement of the collected analyte are
handled via an external all-in-one platform.[74] There are some
commercially available test kits following this philosophy that
are used for HIV,[75] drug abuse, and alcohol screening.[76] The
other extreme is the use of natural sensors in mouth; that is the taste buds for chemical sensing. In this novel approach, the chemical response of the taste buds to a particular analyte is exploited to create a qualitative analysis; for example, the
expe-rience of bitterness after chewing peptide sensor-loaded gum.[77]
This approach may be holding the key in its design to estab-lish new saliva-based diagnostic tools, which can evolve towards “augmented sensing.”
Despite all the promising advances, there are still a number
of issues that are needed to be addressed.[11,61] The biggest
chal-lenge is to accurately identify the transport mechanisms. Ana-lyte transfer is influenced by i) their unique physicochemical characteristics (lipophilicity, molecular weight, dissociation constant, lipophilicity, pH, ionizability, and protein binding affinity), ii) transport mechanism (active or passive), ii) sample collection method (degree of stimulation), iv) inter- and intra-individual variabilities, v) contamination (oral wounds, gingival crevicular fluid, food/drink/smoking), vi) bias due to the oral medications and proteolytic enzymes, and vii) degradation during the transport from blood to saliva.
3.4. Urine
Utilization of urine as a diagnostic tool is as old as the recorded history and it is still regarded as a versatile symptomatic tool for diabetes, bacterial infections, renal diseases, dehydration, preg-nancy even genitourinary cancer. The urine formation process provides sufficient residence time for the diffusion of metabo-lites, salts, proteins, and other valuable analytes from nearby
Figure 2. Integrated diagnostic devices for tear analysis. A) CL-based biosensor for continuous glucose monitoring. Reproduced with permission.[55]
Copyright 2019, American Chemical Society. B) Spring-like device for electrochemical tear glucose monitoring. Reproduced with permission.[60]
Copyright 2018, American Chemical Society. C) CL-assisted continuous ocular monitoring system for glaucoma guidance. Reproduced with permis-sion.[56] Copyright 2017, Dove Medical Press. D) Quantification of tear alcohol via electrochemical sensor mounted eyeglasses. Reproduced with
permis-sion.[59] Copyright 2020, Elsevier. E) Multiplexed detection of tear biomarker via smartphone-assisted CL. Reproduced with permission.[52] Copyright
2020, Royal Society of Chemistry. F) Lateral flow cassette for dry eye disease diagnostics through elevated levels of inflammation marker (Matrix metal-loproteinase-9) in basal tear. Reproduced with permission.[58] Copyright 2020, Springer Nature.
blood capillaries, which in turn creates a practical means to measure biomarker concentrations reflective of the patient status. As in the case of other non-invasive mediums, this diffusion process leads to much lower analyte concentrations, hence only those having high plasma levels become detectable in urine samples unless highly sensitive detection methods are employed.
Majority of the integrated devices developed for urinalysis utilizes paper-based sensors (Figure 4), which in turn rely on optical sensing where the signal readout is performed via color reference charts, optical readers, or handheld devices. In this regard, integration of the smartphones to sensors has brought new possibilities thanks to their enhanced imaging and computing capabilities, prevalent existence in the market, and familiarity for the end-users as well as the technology
developers.[78] Recent examples of this perspective are a hybrid
device for the quantification of urine analytes,[79] the detection
of bacterial infection via “fidget spinner” like lab-on-a-disk
platform,[80] and a fluorescence microarray for the detection
of breast cancer-specific biomarkers.[81] An alternative route to
eliminate the need for an external readout for the quantitative analysis is the utilization of an integrated scale (for example, a ruler), as illustrated for the simultaneous detection of glucose
and bovine serum albumin.[82] Another interesting paper-based
sensor study is the integration of an already available urinalysis
test strip into a smart toilet design,[83] which makes real-time,
cloud-based urine analysis possible. The toilet is also equipped with a uroflowmetry, capable of identifying the abnormal urine flow rates associated with diseases.
Commercially available integrated sensors cover a broad range of applications from immunochromatographic test strips with reference color charts to sophisticated reader-integrated devices, which are now being utilized to monitor infectious dis-eases, cancer, diabetes, and kidney diseases. Dipstick assays are the most popular and well recognized paper-based commercial urine analysis strategy, where the pregnancy tests can be
exem-plified as the most established ones.[84] They are also utilized
for the analysis of urine chemistry via measuring several key parameters including glucose, bilirubin, ketones, specific
gravity, and pH.[1,85] Several companies (Abbot, Polymedco, SD
Biosensor, NephroCheck, Quidel) have introduced a variety of immunochromatography-based lateral flow assays (LFAs) to the market for qualitative and rapid analysis of urine for the diagnosis of infectious diseases, tuberculosis, sexually trans-mitted diseases (STDs), bladder cancer, acute kidney injury,
and sepsis.[1] These products, however, may lead to the
misjudg-ment of test results due to the variations in color interpretation by the end-users. In order to alleviate this problem, companies have launched various kinds of optical readers like Roche Urisys
or NephroCheck Astute140 Meter.[1] Another problem related
Figure 3. Integrated diagnostic devices for oral fluid analysis. A) Portable diagnostic device for electrochemical salivary cotinine detection. Reproduced with permission.[73] Copyright 2019, Wiley. B) Mouth guard biosensor for in vivo glucose measurement. Reproduced with permission.[64] Copyright
2020, American Chemical Society. C) Wearable “in-mouth” platform for electrochemical sodium intake monitoring toward hypertension management. Reproduced with permission.[72] Copyright 2018, PNAS. D) Continuous uric acid detection via mount guard biosensor with integrated wireless
elec-tronics. Reproduced with permission.[62] Copyright 2015, Elsevier. E) Pacifier biosensor for continuous measurement of salivary biomarkers in infants.
Reproduced with permission.[70] Copyright 2019, American Chemical Society. F) Smart toothbrush for glucose monitoring via electrocatalytic oxidation.
Reproduced with permission.[67] Copyright 2019, Elsevier. G) Smartphone-assisted LFA for chemiluminescence-based cortisol detection. Reproduced
www.afm-journal.de www.advancedsciencenews.com
with the immunochromatographic assays is their low sensi-tivity. Commercial fluorescent-based products, in this respect, have gained popularity as a solution to the sensitivity problem,
especially for acute kidney injury detection.[1,86]
3.5. Stool
Stool is commonly tested in medical practice particularly for the disorders of the digestive system. Its significant potential for integrated sensors is associated with its rich constituents including many biomarkers, cells, bacteria, viruses, fungi, and other parasites. Stool cultures are used for the diagnosis of pathogenic diseases such as dysentery as well as various cancer types. Besides, gut microbiota is considered to be correlated
with neurodegenerative diseases like Alzheimer’s disease.[90]
Compared to other non-invasive methods, conventional stool analysis requires complex sample processing, sophisti-cated equipment, and well-trained personnel. Its labor-inten-sive and time-consuming nature also reduces its availability in
the healthcare system. This limited access to the laboratories creates another issue with respect to the stool handling. The sample itself is biohazardous, which necessitates special care during the sampling and its transportation. Furthermore, the time delay between the sample collection and analysis may influ-ence the test outcomes depending on the analyte. For instance, the viability of the intestinal bacteria within the sample is prone
to changes depending on the sample handling[91] while the
durability of a simpler analyte such as hemoglobin is found to be
fairly stable.[92] Therefore, development of integrated devices is of
significant importance for the realization of POC stool analysis. The use of microfluidics, which is one of the fundamental building blocks of integrated sensor designs, has the poten-tial to overcome these challenges. Previous examples of microfluidic devices in this context include on-chip detection
of antigens, bacteria, and nucleic acids.[93–95] Nevertheless,
most of these achievements rely on off-chip sample preparation steps such as vortexing, filtration, and centrifugation, hence hampering the evolution of conventional methods to portable “sample-in-answer-out” devices.
Figure 4. Integrated diagnostic devices for urine and stool analysis. A) Screen-printed electrodes for simultaneous detection of electroactive bio-molecules (ascorbic acid, dopamine, and uric acid) in urine. Reproduced with permission.[87] Copyright 2018, Elsevier. B) POC testing of urinary
tract infections through analysis of bacterial culture via centrifugation-based fidget spinner. Reproduced with permission.[80] Copyright 2020, Nature.
C) Lateral flow pregnancy test strip. Reproduced with permission (https://en.wikipedia.org/wiki/Clearblue). Copyright 2013, SPD Swiss Precision Diag-nostics GmbH. D) Lateral flow cassette for diagnosis and monitoring of inflammatory bowel disease by the detection of calprotectin in stool samples. Reproduced with permission.[88] Copyright 2020, Nature. E) A “smart toilet” system for urinalysis via monitoring of urine analytes (proteins, glucose,
ketones, hemoglobin, bilirubin, urobilinogen, acetone, nitrite, and leucocytes) and urine flow patterns. Reproduced with permission.[83] Copyright
A promising step towards this goal is the developments in on-chip sample processing. One recent example is the direct processing of crude stool samples by using a microfluidic system for Helicobacter pylori detection. The sample is first mixed with magnetic beads, which extracts the DNA from the bacteria. In the next step, beads are transferred into an elution
chamber where the DNA is purified for further analysis.[96]
In another study, stool samples are homogenized by using acoustic streaming created in the microfluidic device. Its unique design enables a gentle, continuous flow keeping the cells intact, which is an important criterion for downstream applications such as flow cytometry, cell detection, and culture. A fully-automated integrated microfluidic device has also been recently presented for Salmonella detection in stool (Figure 4F). It deploys antibody-coated gold nanoparticles to identify
bacterial DNA by using electrochemical sensing.[89] The only
completely integrated paper-based device for stool analysis is an aptasensor, which uses two separated reaction zones connected by a diffusion bridge enabling the detection of different
bacte-rial markers in spiked stool samples.[97]
There is a limited number of low-cost commercial applications for integrated stool analysis, mainly due to the challenging sample preparation step. One particular example is the Calprotectin Home Testing system (Figure 4D) developed by Bühlmann Laboratories AG, which measures the fecal calpro-tectin concentration via smartphone application for the
diag-nosis of inflammatory bowel disease.[88] A completely different
perspective is the smart toilet concept, which has been around since the mid-1980s. One recent study has presented a
proof-of-concept toilet technology for continuous health monitoring.[83]
In this system, stool images are automatically taken and graded according to Bristol stool scale with a machine learning algo-rithm, which can correlate the data with the user via biometric identifiers. Total seating and stool dropping times are also processed for monitoring the constipation and hemorrhoids. In its current state, it is not capable of biochemical analysis of stool, yet claimed to be implemented in the near future.
3.6. Breath
Exhaled breath, with more than 3000 volatile organic com-pounds (VOCs) identified in its content, holds potential for POC diagnostics. In particular, endogenous VOCs are of significant importance from a clinical point of view as they are the by-products of metabolic activity. These trace molecules are carried by the blood circulation and diffused into the exhaled breath through respiratory fluid within the lungs, which creates the possibility to correlate the blood and breath concentra-tion levels for a given compound. Exogenous VOCs, on the other hand, are originated from the external sources hence their concentrations in breath provide valuable information about the environmental exposures, drug intake, and patient’s habits. Nevertheless, presence of these external substances may hinder the measurement of the metabolically relevant compounds, which are typically at very low concentrations
(1–5000 parts-per-billion).[98]
Utilization of sensors for diagnostics can be interpreted as a two-step design process: deciding on which analyte is to
be measured for a given disease and establishing the method of detection for the selected analyte. As the first step, exten-sive effort has been put into the analysis of the biomarkers in breath, which reveals some key VOCs that are strongly cor-related to certain metabolic activities. In this regard, breath analysis has been performed particularly for the diagnosis of diabetes and lung cancer. For diabetes, acetone concentration in breath is monitored, which is typically found to be at least two times higher than that of a healthy person. Lung cancer
monitoring relies on the ratio of certain VOCs[98] rather than
their concentrations due to the fact that changes in metabolic activities lead to detectable variations in these defined ratios. With respect to its design philosophy, the preferred method of detection in breath sensors has been inspired by nature; that is mimicking the sense of smell. The basic principle behind the smelling is the detection of trace amount of VOCs entrained within the air via neuron cell receptors and the interpretation of the generated signal in the brain. Similar to the receptor cells present in the nose, breath sensors also deploy a variety of chemical receptors, which is combined with a data acquisition system and a database for the decision-making process. Such systems are also referred to as the electronic nose (e-nose)
tech-nology in the literature.[99,100]
One well-recognized commercially available e-nose example is Cyranose 320, which deploys an array of nanocomposite sen-sors for the “smell print” detection. It has been successfully tested for obstructive airway diseases such as asthma, CF, lung
cancer, infectious and inflammatory diseases.[101] The Aeonose,
another commercially available e-nose application, processes exhaled breath directly without using any temporary storage
unit for the analysis of lung cancer-related VOCs.[98] One
study worth noting here is the recently developed
UV-irradi-ated e-nose application,[102] which can distinguish between the
breath patterns of lung cancer patients from the healthy sub-jects. Furthermore, it can also discriminate the type of cancer as well as its major subtypes (squamous cell carcinoma and adenocarcinoma).
In addition to these e-nose applications, there are also studies utilizing different detection mechanisms for breath analysis (Figure 5). One interesting example is the miniaturization of the gas chromatography for the detection of lung
cancer-associated VOCs in breath.[103] The proposed system integrates
microelectromechanical systems with metal oxide semicon-ductor technology, which includes a separation column, on-chip detector, and signal processing unit. Recently, a multiplexed, nanomaterial-based sensor array has been demonstrated for the detection of COVID-19-related VOCs. Initial results dem-onstrate that proposed device can successfully differentiate patients from control groups, as well as COVID-19 from other
lung-related diseases.[104]
Another recent example utilizing a different design phi-losophy is the paper-based wearable humidity sensor for
breath analysis.[105] The working principle of the device relies
on the change in the ionic conductivity with the water content absorbed in the paper, which makes it possible to deploy the device as a portable humidity sensor to track the real-time res-piration. A similar approach has also been demonstrated as a proof-of-concept technology for monitoring lung and infectious
www.afm-journal.de www.advancedsciencenews.com
peroxide from exhaled breath.[107] The paper-based device
com-prises two geometrically identical electrodes (Figure 5D). The first electrode measures the background signals caused by interfering substances or environmental conditions (like tem-perature and humidity), while the sensing electrode is specially sensitized to detect the target molecule. Breath sampling is performed on pre-treated cellulose paper, which acts like both a substrate (i.e., a carrier for electrodes and/or biomolecules like enzymes or antibodies) and a solid electrolyte for the electrochemical detection. These two examples indicate that the paper-based approaches can offer a promising solution for accessible, simple, and wearable breath testing by integrating sampling, collection, and analysis steps into a single device.
The challenges in breath analysis are all stemmed from the low biomarker concentrations. Instantaneous concentration of those trace molecules strongly depends on the subject (age, sex, diet, medicine, fasting, smoking) as well as the expiratory flow rate. Furthermore, breath sample can be contaminated by the presence of exogenous VOCs. The composition can be also influenced by the sample collection method, for instance, the possible contamination due to the interactions with saliva.
More importantly, there is still no consensus in the community on how to interpret the measured biomarker levels in breath quantitatively, as reliable correlations between breath-blood concentrations are still not well-established.
3.7. Seminal Fluid
Semen contains male gametes (sperm) in a cocktail of various proteins, enzymes, vitamins, and other substances such as sugar, which provides a nutrient media for the cells. Its analysis forms the base of male fertility tests and relies on the quanti-fication of its physical properties (pH, color, viscosity) as well as the sperm deficiencies including its number density, vitality, movement ability (motility), DNA integrity, and morphology. Semen testing is also important for the diagnosis of STDs. Conventional clinical methods include counting chambers, computer-assisted sperm analysis (CASA), viability, and integ-rity assays. Nevertheless, these methods involve complex and time-consuming procedures requiring expensive equipment and skilled personnel. In this regard, integrated devices offer
Figure 5. Integrated diagnostic devices for breath analysis. A) Wearable paper-based sensor for continuous respiration activity monitoring. Reproduced with permission.[105] Copyright 2016, Wiley. B) Nano-material based multiplexed sensor array for the detection of COVID-19-related VOCs. Reproduced
with permission.[104] Copyright 2020, American Chemical Society. C) Internet-of-things-enabled e-nose for breath analysis. Reproduced with
permis-sion.[99] Copyright 2020, MDPI. D) Wearable paper-based sensor for electrochemical analysis of different analytes (such as hydrogen peroxide) in
exhaled breath. Reproduced with permission.[107] Copyright 2019, American Chemical Society. E) UV-irradiated e-nose for prediction of lung cancer
histological types through exhaled breath. Reproduced with permission.[102] Copyright 2020, Elsevier. F) Wearable e-nose for real-time health status
a remedy to overcome these drawbacks as they offer simple, rapid, and disposable solutions, which also enhances the pos-sibility of on-site diagnostics. Home testing, in particular, has the potential to encourage compliance among male patients by reducing the anxiety and discomfort during the sampling.
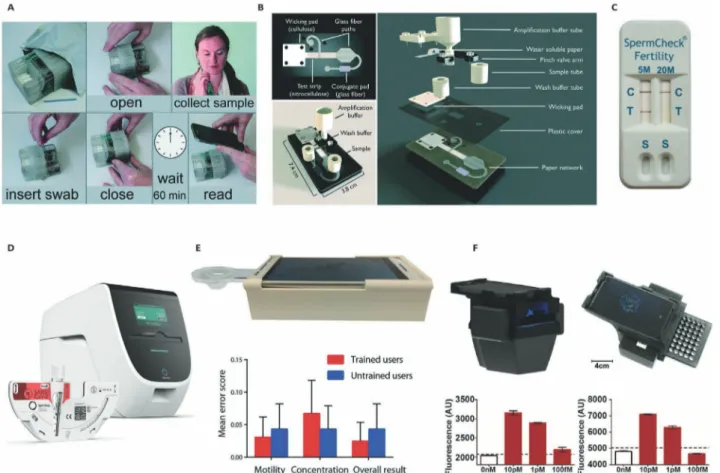
There are successful implementations of integrated sensors for the semen analysis, which incorporates already available smartphone capabilities for optical sensing and data analysis. One example utilizes a capillary-based negative pressure feeding system to analyze unprocessed, crude semen samples to quantify sperm concentration, and motility (Figure 6E). The platform has been tested by benchmarking its prediction with
those of CASA and showed a good agreement.[108] Very recently,
this smartphone-based semen analyzer has been further improved with new capabilities for measuring sperm viability,
binding, and DNA fragmentation.[109]
Most of the current commercial home-based male infer-tility assays, on the other hand, only measure the sperm con-centration. Chemical staining of the proteins on the sperm head is one of the commonly used methods for that purpose, which demonstrates qualitatively whether the sample has higher or lower sperm concentration than a threshold value.
FertilMARQ, SpermCheck, and SwimCount can be listed as the
commercially available examples of this approach. Another qualitative analysis method uses centrifugal forces for the sperm count, available in the market under the brand Trak. Similar to the staining-based methods, it only indicates the sperm concentration within wide ranges, and further testing is still required to determine the abnormalities in sperm
mor-phology and motility.[110]
Irrespective of the method deployed for the semen anal-ysis, collection, and delivery of the samples might play a sig-nificant role in the results. Accordingly, best practice guide prepared by WHO should be followed for the sample collec-tion: i) The sample should be collected where the test will be performed to minimize the temperature fluctuations and to standardize the sample-to-result time, ii) sample should be collected after a minimum 2 days and a maximum of 7 days of sexual abstinence, ii) Semen sample needs to be complete any loss of the semen sample fraction must be reported, iv) sample container should be clean, wide-mouthed, made of glass or plastic which is confirmed to be non-toxic for sper-matozoa, v) specimen should be kept at the temperature range of 20–37 °C.[111]
Figure 6. Integrated diagnostic devices for swab sample and seminal fluid analysis. A) Disposable nucleic acid amplification platform for the detec-tion of MRSA bacteria genes from nasal swabs. Reproduced with permission.[112] Copyright 2016, Royal Society of Chemistry. B) 2D paper network for
the detection of the influenza from nasal swab samples. Reproduced with permission.[113] Copyright 2019, Royal Society of Chemistry. C) Lateral flow
home sperm count test. Reproduced with permission.[114] Copyright 2010, Oxford Journals. D) Centrifugal PCR-based microfluidic device for detection
of infectious diseases. Reproduced with permission.[115] Copyright 2020, Spindiag. E) An automated smartphone-assisted device for semen analysis.
Reproduced with permission.[108] Copyright 2017, American Association for the Advancement of Science. F) Nucleic acid amplification assay integrated
www.afm-journal.de www.advancedsciencenews.com
3.8. Swab Specimen
Swab sampling is a common non-invasive and economic diag-nostic method for various kinds of diseases including cervical
cancer, influenza, and lung infections.[112,113,116–121] It can be
col-lected from the nose, pharynx, throat, urethra, cervix, vagina, wounds, and rectum. Proper specimen collection is the most critical step in swab analysis, which consists of sterilization, site preparation, swabbing, and transportation. Depending on the site of application, the swab itself must ensure the right flexibility, shape, and size while the tip material must have the appropriate properties enabling efficient sample capture and target release. This type of an approach, when combined with an integrated sensor, has the potential to improve the management of epidemic outbreaks (such as COVID-19) as it offers the possibility of early diagnosis owing to its on-site, fast, affordable, and disposable nature.
One of the earliest examples of integrated paper-based devices for swab samples was developed for the early diag
-nosis of influenza from nasal samples[121] where results were
compared with those obtained with a gold standard method. The first disposable nucleic acid amplification platform is also developed for the detection of bacterial gene targets from nasal
swab samples.[112] In this paper-based design, two
methicillin-resistant Staphylococcus aureus (MRSA) related genes are monitored for the diagnosis of infectious diseases (Figure 6A). Design objective of this particular system is to develop an affordable disposable sensor to be used in resource-limited areas. A centrifugal microfluidic LabDisk device has recently been introduced for the on-site and rapid detection of MRSA, which improves the disease screening and timely
decision-making process.[122] The proposed design also increases
the antibiotic therapy efficiency via clear differentiation of methicillin-sensitive and resistive bacteria.
Another paper-based nucleic acid amplification system is reported for the early diagnosis of influenza from clinical
naso-pharyngeal specimens.[123] The extraction, amplification, and
detection of viral RNA are handled on the same chip, within the clinically-relevant detection limit. The same group also introduced a solution for the early diagnosis of sexually transmitted
infec-tions from vaginal and urethral swab samples.[124] An internal
control system is added to the design enabling the differentiation of negative test results from invalid measurements, which further increases the reliability for POC applications.
A recently emerging trend is to combine LFA with CRISPR
technology for various infectious diseases,[117–120] as it provides
low-cost, simple, and easily programmable tools for sensi-tive and selecsensi-tive detection of nucleic acids. The versatility of CRISPR-associated (Cas) enzymes enables i) to target a variety of nucleic acids (i.e., double-stranded DNAs or single-stranded RNAs or DNAs), ii) to work under different cleavage conditions (temperature or buffer), and ii) to combine analytical proce-dures such as sample extraction, amplification, and analysis
in a single step.[117] In accordance, CRISPR/Cas technology
can enhance the evolution of the existing biosensing devices towards “sample in-answer out” solutions.
There are also commercially available kits for the analysis
of throat, nasal or nasopharyngeal swab samples.[1,115,125] These
sensors are capable of detecting bacterial antigens or viral
nucleoproteins for the diagnosis of infectious diseases, by using either fluorescent immunoassays or immunochromatographic tests. However, they only provide qualitative results unless an external readout unit is deployed and the sample preparation has to be handled by the end-user.
4. Translation to the Market
Transition of an idea to an end-product is an evolutionary pro-cess. Each technology must survive through various phases with its own success criteria and risks until it reaches the last stage, commercialization. Technology readiness assessment is a formal evaluation method developed to navigate through this landscape while minimizing the associated risks at each level. This is commonly achieved by tracking the developing idea via TRLs tailored for different fields such as biomedical applications.
TRL concept was first introduced by NASA as a means to assess the maturity of new technologies for risk manage-ment and technology transition, particularly for the defense
industry.[126] The current scale consists of nine levels spanning
from the observation of basic principles to the production and distribution stage. The purpose of the assessment is to reflect the scale of the application (component, subsystem, system) and the applied environment (laboratory, mathematical and physical simulations, field tests, and operational use) hence does not indicate the difficulty in achieving the next level or the associated risks. Nevertheless, the method has proved itself as a convenient tool for navigating the technology landscape and further adopted for biomedical systems.
The TRLs for pharmaceuticals and medical devices follow the same main frame of the original classification which is tailored by the FDA regulations and previous experience of the medical
industry (Figure 7).[126] These modifications reflect the three
char-acteristics observed in medical technologies: i) risk assessment, ii) technological evolution, and ii) flexibility. In product develop-ment, the risk associated with the new technology is normally expected to decrease with increasing TRL. For medical applica-tions, however, the risk reduction does not change linearly across the levels and the risks remain high until the very late stages. A medical device does not necessarily follow a sequential path during its technological evolution either and it is not uncommon to see the change to be greater than a single TRL (for instance, from TRL 4 to TRL 8). Therefore, the formal classification should be interpreted as a general guideline for the routine sequential developments. In accordance, the line passing through the grey area between the successive TRL decisions becomes inherently flexible and should be drawn by considering the maturation and risk characteristics of a particular technology.
When we applied the TRL scale to the recent non-invasive integrated platforms (Table S1, Supporting Information), three features were frequently observed: i) current studies are une-venly distributed among four major categories: research phase, integration phase, near-commercialization, and commercializa-tion (Table 1); ii) there exists a vast pool of fundamental research (TRL 1–2) which is intrinsically reflected as high number of avail-able laboratory models (TRL 3); ii) the success rate of reaching TRL 7 and beyond is quite low. Here the critical question is what
inherent characteristics of a particular application increase the rate of survival during the integration phase. TRL distributions in terms of sample type indicate that there is no apparent cor-relation between the matrix type and the success rate. However, there exists a significant segregation with respect to the ana-lyte of interest, its complexity, and the sensing technology. The majority of the commercialized platforms focus on biomarkers whose presence or absence is sufficient enough to describe the medical status, rather than the case where its precise concentra-tion is needed to be monitored continuously in a dynamically changing environment (for example, glucose in sweat). Another important observation is related to the sensing strategy. Com-mercialized examples aim to answer “yes/no questions” with qualitative results, which is usually achieved via LFAs. There-fore, individual challenges of each matrix type for the quanti-tative analysis such as stability, cross-contamination, transient nature of analyte concentrations, data transmission, and energy supply have not been addressed and rather bypassed.
Market expectations and the selection of a target group are expected to play a significant role in the successful transition of
developing technology. An integrated device could be designed as a supportive tool easing the decision-making process for the physician. The other extreme is to build the device with an integrated decision unit so that unsupervised testing is possible for all end-users. This distinction results in different priorities regarding various components, where the survival of the tech-nology depends on investing in the right subsystems. Incorpo-rating the environmental concerns into the design philosophy may also affect the long-term survival of a device in the market. Utilization of single-use products such as pregnancy, ovulation, or infertility tests has been raising environmental concerns; therefore, a clear distinction between reusable and disposable parts of an integrated device should be made during the product development. A successful example of responding to such con-cerns is a recently developed biodegradable, flushable pregnancy test which eliminates the plastic waste created by the disposable
counterparts.[127] Another factor improving the success rate of an
integrated device is its familiarity and comfort for the end-users. In this regard, the current trends combine sensors with smart-phones, CLs, and wristwatches, which will ease their integration
www.afm-journal.de www.advancedsciencenews.com
to our daily life. One striking example concerning the signifi-cance of comfort for the end-user is the short commercial life of GlucoWatch, which is partly due to the complaints about long warm-up times, painful rashes, and skin irritation.
5. Outlook
The essence of the integrated sensing platforms is the “sample in-answer out” approach which has the potential to provide real-time physiological data via miniaturizing the complex laboratory procedures into one small device. The phrase “sample in” implies that the sample should be easily accessible and collectible without any expertise or external devices, making the non-invasive sampling a suitable choice. Neverthe-less, this approach has still not reached its anticipated potential and has not paved its way into practice.
Our analysis reveals that the variations in the technological maturity of non-invasive integrated devices are independent of the matrix type and rather depends on the sensing strategy. Applications survived the basic research step and successfully gained their places in the market usually rely on qualitative
analysis answering some basic “yes/no” questions while the success rate of quantitative continuous monitoring is notice-ably low. The first major obstacle hampering this transition is the low concentrations of physiologically relevant analytes in non-invasive matrices, that is, the concentration of the analyte of interest compared to the native components constituting the matrix is extremely small. Detection in such challenging ratios is analogous to counting the footsteps of a bug behind a railway
track while a train is passing.[130] Accordingly, the success of the
developed device is essentially tied to the sensitivity and accu-racy of the selected method. Therefore, this design bottleneck should be alleviated by either improving the currently available alternatives or introducing a new approach, while ensuring compatibility with the rest of the components of the integrated platform such as data transmission and power supply units. Even this technical barrier is overcome, the data interpretation step still awaits as a greater challenge. The link between the instantaneous blood analyte concentrations and those meas-ured in the non-invasive matrices is still missing. This physio-logical correlation gets further complicated due to the inherent dependence between the sample collection method and the
analyte concentrations.[11] Our progress in understanding this
Table 1. TRL assessment of selected integrated devices for non-invasive diagnostics.
TRL Matrix Analyte Target Technology Ref.
3 Stool DNA Salmonellosis Electrochemical [89]
Urine Ascorbic acid, dopamine, uric acid Urinary tract function Smartphone-assisted electrochemical [87]
Swab Hemagglutinin Influenza LFA [113]
4 Oral fluid Sodium Hypertension Electrochemical [72]
Oral fluid Glucose and nitride Diabetes mellitus Colorimetric µPAD [66]
Sweat Glucose Wellness monitoring Electrochemical [40]
Sweat Glucose, lactate, choline Wellness monitoring Electrochemical [42]
5 Semen Concentration & motility Infertility Smartphone-assisted optical [108]
Breath Humidity Sleep apnea Electrochemical µPAD [105]
Swab DNA Bacterial infection LFA [112]
Oral fluid Cotinine Tobacco exposure Electrochemical [74]
6 Breath VOCs Lung cancer Electronic nose [102]
Oral fluid Glucose Diabetes mellitus Electrochemical [68]
Urine Urine biochemistry Urinary tract function LFA [83]
Sweat Uric acid, tyrosine Gout disease Electrochemical [36]
7 Urine Bacteria Urinary tract infection Colorimetric [80]
Sweat Sweat rate, analyte concentration Sweat profile Hybrid [32]
8 Breath VOCs Obstructive lung disease, cancer Electronic nose [128]
Breath VOCs Infectious diseases Hybrid [104]
Tears Glucose Diabetes Electrochemical [60]
9 Tears MMP-9 Dry eye disease LFA [58]
Swab Antigen or protein Infectious disease LFA [125]
Sweat Sweat rate, analyte concentration Sweat profile Colorimetric [44]
Urine Urine biochemistry Urinary tract function LFA [129]
Urine hCG Ovulation/pregnancy LFA [84]
Stool Calprotectin IBD LFA [88]