Unlicensed
to Kill
Prepared for
AAA Foundation for Traffic Safety 1440 New York Avenue, NW, Suite 201 Washington, DC 20005 Tel: 202 -638-5944 Fax: 202 -638-5943 www.aaafoundation.org Prepared by Robert A. Scopatz Clayton E. Hatch Barbara Hilger DeLucia Kelley A. Tays Data Nexus, Inc.
The
Sequel
This study was funded by the AAA Foundation for Traffic Safety in Washington, DC. Founded in 1947, the AAA Foundation is a not-for-profit, publicly supported charitable research and education organization dedicated to saving lives and reducing injuries by preventing traffic crashes. Funding for this study was provided by voluntary contributions from the American Automobile Association and its affiliated motor clubs, from individual AAA members, and from AAA-affiliated insurance companies.
This publication is distributed by the AAA Foundation for Traffic Safety at no charge, as a public service. It may not be resold or used for commercial purposes without the explicit permission of the Foundation. It may, however, be copied in whole or in part and distributed for free via any medium, provided the AAA Foundation is given appropriate credit as the source of the material. The opinions, findings, and conclusions expressed in this publication are those of the authors and are not necessarily those of the AAA Foundation for Traffic Safety or of any individual who peer-reviewed this report. The AAA Foundation for Traffic Safety assumes no liability for the use or misuse of any information, opinions, findings, or conclusions contained in this report.
If trade or manufacturers’ names or products are mentioned, it is only because they are considered essential to the object of this report and their mention should not be construed as an endorsement. The AAA Foundation for Traffic Safety does not endorse products or manufacturers.
Table of Contents
List of Tables ... 4 List of Figures ... 4 Acknowledgments ... 5Executive Summary
7
The Issues ... 7 Research Methods ... 9Practices in Six States ... 10
Recommendations ... 11
1. Introduction to the Issues
13
Definitions ... 14Characterizing the Problem ... 16
The Paradox of Reinstatement ... 17
Evidence that Suspension and Other Sanctions Work ... 18
Summary ... 20
2. Research Methods
23
Review of State Laws ... 24State Site Visits and Interviews ... 24
State Comparisons ... 25
Standard Questionnaires ... 26
3. Practices in Six States
27
California Highlights ... 27 Florida Highlights ... 31 Iowa Highlights ... 34 Michigan Highlights ... 37 Minnesota Highlights ... 40 Oregon Highlights ... 434. Recommendations
47
Laws to Combat Driving without a Valid License ... 47Procedures to Encourage Compliance with the Laws ... 50
Systems and Procedures for Effectively Sanctioning Violators ... 52
Appendix A.
55
Fatal Traffic Crashes in the United States, 1993-99 Analysis of the Data ... 55Trend Analysis ... 81
Appendix B.
82
License Status of Drivers in Fatal Crashes by the State in Which the Crash OccurredAppendix C.
86
Age, Gender, and License Status of Drivers Involved in Fatal CrashesAppendix D.
89
Suspensions and Revocations Recorded for Drivers Involved in Fatal Crashes in the Three Years Preceding Their Fatal Crash, 1993-99Appendix E.
109
Standardized Site Visit Questionnaires Site Visit Questionnaire ... 109Analytic Questions ... 111
AAAFTS Unlicensed Driver Study Program: Graduated Driver Licensing ... 112
AAAFTS Unlicensed Driver Study Program: Ignition Interlock ... 113
AAAFTS Unlicensed Driver Study Program: Administrative License Revocation ... 113
Appendix F.
115
List of Study Participants California ... 115 Florida ... 115 Iowa ... 115 Michigan ... 115 Minnesota ... 116 Oregon ... 116References
117
Abbreviations
119
Table Pg
2.1 24 Earlier License Suspensions or
Revoca-tions for Drivers from Participating States Involved in Fatal Crashes with a Revoked License, 1993-99
3.1 28 Impaired Driving Laws for the Six
Partici-pating States
3.2 28 Impaired Driving Laws for Other States
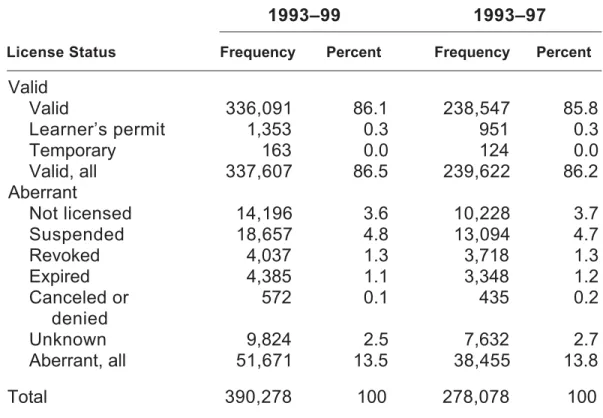
A.1 55 License Status of Drivers Involved in Fatal
Crashes in the United States, 1993-99, and Comparison with Data Reported in Unlicensed to Kill for 1993-97
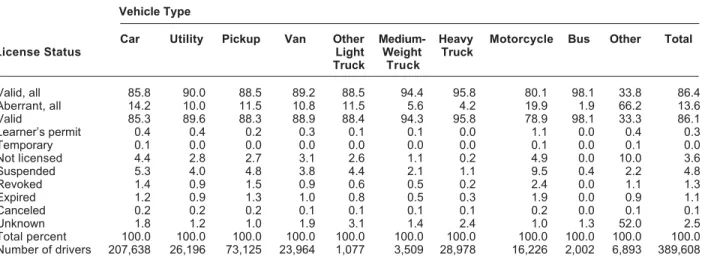
A.2 58 Driver’s License Status by Vehicle Type for
Drivers Involved in Fatal Crashes, 1993-99
A.3 59 Fatal Crashes and Fatalities by Driver’s
License Status of Drivers Involved in Fatal Crashes, 1993-99
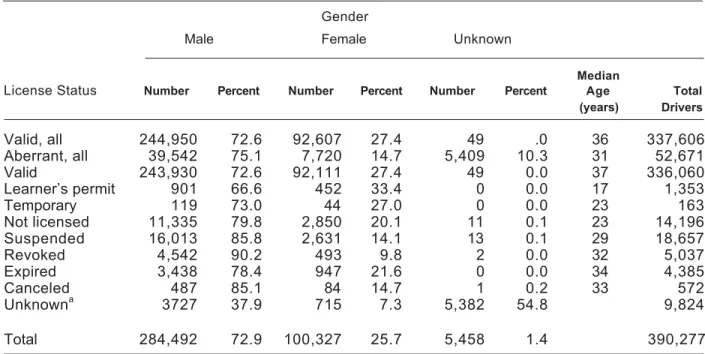
A.4 60 Driver’s License Status by Gender and
Median Age, 1993-99
A.5 65 Driver’s License Status by Presence of
Alcohol, 1993-99
A.6 66 Previous Driving While Intoxicated
Convic-tions for Drivers Involved in Fatal Crashes by License Status, 1993-99
A.7 66 Previous Suspensions and Revocations
for Drivers Involved in Fatal Crashes by License Status, 1993-99
A.8 69 Drivers with Unknown License Status by
Hit-and-Run Status and Jurisdiction of License Origin, 1993-99
A.9 69 Vehicle Type Driven by Young Unlicensed
Drivers Involved in Fatal Crashes, 1993-99
A.10 70 Driver Outcome by Driver’s License
Status and Crash Mode, 1993-99
A.11 71 Annual Driver’s License Status
Percent-ages for Each State, 1993-99
B.1 82 License Status of Drivers in Fatal Crashes
by the State in Which the Crash Occurred
C.1 86 Age, Gender, and License Status of
Drivers Involved in Fatal Crashes
D.1 89 Previous Suspensions or Revocations for
Drivers with Valid Licenses by State or Jurisdiction
D.2 94 Prior Suspensions or Revocations for
Drivers with Suspended Licenses by State or Jurisdiction
D.3 99 Prior Suspensions or Revocations for
Drivers in Fatal Crashes with a Revoked License by State
List of Tables
Fi g Pg
A.1 57 Percentage of Drivers Involved in Fatal
Crashes Who Were Driving with an Aber-rant License Status, Ranked by the State Where the Accident Occurred, 1993-99
A.2 61 Percentage of Fatal Crashes that Involved
Drivers with Suspended or Valid Licenses by Age, 1993-99
A.3 61 Percentage of Fatal Crashes that Involved
Drivers with Revoked or Valid Licenses by Age, 1993-99
A.4 62 Percentage of Fatal Crashes that Involved
Drivers with Expired or Valid Licenses, 1993-99
A.5 62 Percentage of Fatal Crashes that Involved
Drivers without Licenses or with Valid Licenses, 1993-99
A.6 63 Percentage of Fatal Crashes that Involved
Drivers with Suspended or Valid Licenses by Hour when Crash Occurred, 1993-99
A.7 63 Percentage of Fatal Crashes that Involved
Drivers with Revoked or Valid Licenses by Hour when Crash Occurred, 1993-99
A.8 64 Percentage of Fatal Crashes that Involved
Drivers with Expired or Valid Licenses by Hour when Crash Occurred, 1993-99
A.9 64 Percentage of Fatal Crashes that Involved
Drivers without Licenses or with Valid Licenses by Hour when Crash Occurred, 1993-99
A.10 65 Percentage of Fatal Crashes that Involved
Drivers with Unknown License Status or Valid Licenses by Hour when Crash Occurred, 1993-99
A.11 68 Percentage of Drivers with Suspended or
Revoked Licenses Involved in Fatal Crashes Who Had Three or More Suspensions or Revocations in the Three Years before the Crash, Ranked by Licensing State, 1993-99
A.12 81 Trend in Aberrant License Status
Percent-ages over Years for Drivers Involved in Fatal Crashes, 1993-99
List of Figures
Table Pg
D.4 104 Prior Suspensions or Revocations for
Drivers with Expired Licenses by State or Jurisdiction
Acknowledgments
This work would not have been possible without the participation of numerous state agency staff members who were interviewed and who provided extensive documentation on the state procedures for unlicensed drivers. A list of the study participants is provided in appendix F.
Robert A. Scopatz, Ph.D. Clayton E. Hatch
Barbara Hilger DeLucia Kelley A. Tays
Executive Summary
In 2000, the AAA Foundation for Traffic Safety published the report Unlicensed to Kill, which was based on a study that examined the license status of drivers involved in fatal crashes during the period 1993-97. The results showed that 20% of all fatal crashes in the United States involved at least one driver who did not have a valid license at the time of the crash.
This report gives the results of a new study of state practices regarding drivers involved in fatal crashes that also has updated and extended the findings of the original Unlicensed to Kill report. The new study’s reanalysis of the data in the first report (using data on fatal crashes from 1993 to 1999) confirmed its results: Approximately 20% of fatal crashes involve at least one driver who did not have a valid license at the time of the crash. These data also show a wide variation across states in the proportion of drivers involved in fatal crashes who lacked a valid license—from a low of 6.1% in Maine to a high of 23.1% in New Mexico.
Furthermore, trend analyses show that the proportion of drivers involved in fatal crashes who lack a valid license showed small but steady declines during the 7-year study period. The proportion of suspended drivers (those whose licenses were suspended at the time of the crash) involved in fatal crashes increased slightly, from 4.5% in 1993 to 5% in 1999. But the proportion of drivers who were unlicensed; whose licenses had been revoked, expired, or canceled; or who had an unknown license status all declined by a small amount during the 7 years.
The Issues
The original Unlicensed to Kill report raised serious issues about states’ ability to control the unlicensed driving situation. First, to find out if unlicensed drivers are over-represented in the fatal crash statistics, it would be good to have a reliable estimate of the population of drivers who are unlicensed or driving under an invalid license. Sec-ond, to help states better understand and address the problem of drivers who operate a motor vehicle without a valid license, it is important to explain the reasons why states differ so much in their overall experience on this issue, and why they differ in particular types of license status violations among drivers involved in fatal crashes. The questions to be answered include:
• Why are some states’ proportion of drivers involved in fatal crashes who have an aberrant license status so much lower than the national average?
• Why do even states with very good records appear to have problems with particu-lar classes of license violations?
• For offenders driving under the influence of alcohol, how do the state’s laws affect a motorist’s willingness to drive without a valid license?
• What effect is there, if any, of recent laws suspending the licenses of people who fail to pay child support or commit other offenses not related to driving?
• How do state procedures for notification of changes in license status affect the way courts and drivers behave?
• How do the enforcement of penalties for serious traffic violations and the prosecu-tion of repeat offenders affect the state’s proporprosecu-tion of drivers without a valid li-cense?
• Are there other factors to consider, such as residency or citizenship status and insurance costs?
This report seeks to answer each of these questions by presenting the results of research in the context of the available literature, data, and expertise of practitioners at the state and national levels. Chapter 1 introduces the issues and reviews the literature. Chapter 2 presents the methods followed in conducting the research. Chapter 3 pre-sents information on the laws, driver-control practices, and procedures of six states that seek to reduce a person’s ability to drive without a valid license. Chapter 4 presents recommendations gleaned from successful state practices that could be emulated by other states and promoted by AAA clubs.
To introduce the research problem, chapter 1 defines terms, reviews the literature, highlights findings of various researchers, and explains limitations on data and meth-ods. For instance, by setting the involvement rate of validly licensed drivers as the norm, one group of researchers calculated that drivers whose license has been suspended or revoked are 3.7 times more likely to be involved in a fatal crash than are validly licensed drivers and that unlicensed drivers are 4.9 times more likely to be involved in a fatal crash. Their methodology has limitations, however, most notably the need to establish the identity of the driver at fault in a fatal crash. Another problem is that it is hard to arrive at reliable findings for unlicensed drivers simply because so little is known about them.
Another aspect of the problem examined is the “paradox of reinstatement”: Driv-ers who have lost their license and have not had it reinstated may behave in a safer fashion than those who have had it reinstated or those who are granted a hardship license. Still another aspect is the evidence that suspensions and other sanctions can help bring drivers back into compliance. For instance, researchers found that Florida drivers who were convicted of operating their vehicles while under the influence of alcohol and fail to “resolve” their behavioral issues before license reinstatement had 75% higher violation rates and 97% higher crash rates than drivers who were reinstated after resolving their behavioral issues.
Overall, studies thus far of drivers whose licenses have been suspended or revoked or who are unlicensed have been linked to recidivism of drivers suspended for driving under the influence of alcohol. More recent work has begun to look more closely at drivers who were suspended for other reasons, but data on these drivers are lacking.
It is clear that well-crafted, aggressively enforced laws can have an effect on the behavior of drivers suspended for driving under the influence of alcohol. It also seems probable that suspension of driving privileges is generally interpreted (by the drivers) to mean something short of a total ban. The majority of them still drive at least some of the time.
It is important to note that there are sizable gaps in the data available on drivers’ behavior in general and that these gaps cause a corresponding lack of completeness in the literature on traffic safety. Moreover, though it makes good logical sense that license sanctions do work, the lack of complete data makes it impossible to be certain just how much of a deterrent is possible with license sanctioning programs. Because people con-tinue to drive while their license is suspended or revoked (and while they are completely unlicensed), the general deterrent effect of license sanctions is not as strong as it could be. This report therefore seeks to answer the question of how best to develop programs to keep these drivers from behind the wheel—because if they do not drive, they do not contribute to traffic safety problems.
Research Methods
In developing a list of sample states for the research, an attempt was made to identify states that have enacted and studied the effects of laws such as administrative license suspension and vehicle actions such as impoundment. In particular, those states that were lower than the national average in the proportion of crashes involving drivers with any type of aberrant license status were considered candidates. The selection pro-cess was biased toward states with a large population so that any changes in the mea-sures reported in the earlier Unlicensed to Kill report and updated in this report could be viewed as real and not as an artifact of relatively small shifts in the population. There was no attempt to select states perceived as representative. Instead, a deliberate decision was made to focus on the states that appeared to have had some success at reducing the fatal crash involvement of drivers with an aberrant license status.
Once candidate states were identified, officials of each state were informed of the level of effort required to participate and were asked to provide written documentation of their problem of drivers operating vehicles with suspended or revoked licenses or while unlicensed and of their laws and procedures for dealing with problem drivers. Each state also identified key personnel that could be interviewed as the project pro-gressed. Six states ultimately agreed to participate: California, Florida, Iowa, Michigan, Minnesota, and Oregon.
The laws of the six participating states were thoroughly reviewed. Then members of the project research team visited the states to gain a thorough understanding of the state’s laws and practices regarding licensure, loss of license, reinstatement, and penal-ties for violating the licensure provisions of the law. Standard practices in the enforce-ment and adjudication arenas were also explored through interviews with key personnel in each state’s driver-control and -licensing branch of the department of motor vehicles.
Practices in Six States
The interviews with experts in the six states yielded useful information on their varying practices. These states represent medium-sized to large populations, and they have better than national average performance in the proportion of drivers in fatal crashes who lacked a valid license. In addition, several of these states are recognized leaders in laws, procedures, data systems, and analyses related to drivers with an aber-rant license status; the report highlights each state’s activities in these areas.
The six states all have open container and ignition interlock laws. Three have spe-cial repeat offender laws on the books. Four allow vehicle impoundment. Two have special plates or markings for repeat offenders. Four allow vehicle confiscation. And two can also block vehicle registrations by offenders who were driving under the influ-ence of alcohol.
The most notable comparison between all other states and the six participating states involves vehicle impoundment. The majority of other nonparticipating states (78%) do not have laws regarding vehicle impoundment; however, five of the six par-ticipating states do have such laws.
For each of the six states, the report offers brief descriptions of the range of both approaches that work and also barriers to addressing the problem. In California, for instance, the vehicle impoundment program results in eventual forfeiture in approxi-mately half the cases. One principal barrier is that few of the drivers who are eligible for a restricted license ever apply for one.
In Florida, a citation-tracking system that supports analysis of the sequence of events related to each traffic citation has been put to good use analytically, especially in evaluating the program for motorists under the influence of alcohol. One barrier, how-ever, is that law enforcement officers do not always run a driver history check at traffic stops.
In Iowa, an information center assists those drivers seeking help in getting their licenses reinstated and to avoid getting a suspension for unpaid fines. One main barrier is that county attorneys are reluctant to prosecute for driving under suspension or revo-cation if the driver is also charged with operating while impaired.
In Michigan, the immobilization program effectively blocks registration of ve-hicles by drivers with suspended or revoked licenses. One main barrier is that check-points have been ruled illegal, making it harder for law enforcement officers to catch violators.
In Minnesota, an early intervention program identifies drivers who are in danger of having their license canceled and enables the state to influence those drivers’ behav-ior before they cross the line. A main barrier is that conviction records are not always
coded properly, and thus drivers may legitimately claim that they did not know that their license had been canceled.
In Oregon, local lists of scofflaws are useful in targeting recidivist or problem drivers. One main barrier is that local agencies are reluctant to implement a vehicle seizure program, partly because the law now requires a conviction before a vehicle can be seized.
Recommendations
The report’s recommendations, which are based on the interviews with experts in the six participating states, fall into three broad categories. The first includes laws that are effective in combating driving without a valid license:
• Implement and enforce administrative license revocation and suspension laws • Establish vehicle impoundment, seizure, and immobilization programs • Implement plate removal at the scene
• Implement special plates or stickers as an automatic probable cause for a traffic stop
• Establish mandatory jail time for multiple offenders
• Establish strictly circumscribed ignition interlock programs • Establish a separate law enabling license status checkpoints • Block registration of vehicles by drivers lacking a valid license
The second category of recommendations pertains to procedures that encourage compliance with the laws:
• Establish strong administrative control of license actions
• Establish driver assistance programs and informational campaigns
• Reduce the possibility and use of plea bargaining through additional information and education
• Create links between driver and vehicle registration files
The third category of recommendations concerns systems and procedures that help law enforcement officers, prosecutors, and courts effectively sanction violators:
• Create citation-tracking systems
• Convert to easy-to-use driver history records for police, prosecutors, and courts • Provide timely and accurate information in driver history records
1. Introduction to the Issues
A reanalysis of the data in the original Unlicensed to Kill report (which used data on fatal crashes from 1993 to 1999) confirmed the results of that study: Approximately 20% of fatal crashes involve at least one driver who did not have a valid license at the time of the crash (see appendix A). These data also show a wide variation among the 50 states plus Washington, D.C., in the proportion of drivers involved in fatal crashes who lacked a valid license—from a low of 6.1% in Maine to a high of 23.1% in New Mexico.
Trend analyses (discussed in appendix A) show that the proportion of drivers in-volved in fatal crashes who lack a valid license (which will be referred to as having an “aberrant license status”) showed small but steady declines during the 7-year study pe-riod. The proportion of suspended drivers (those whose licenses were suspended at the time of the crash) involved in fatal crashes increased slightly from 4.5% in 1993 to 5% in 1999. But the proportion of drivers who were unlicensed and those whose licenses were revoked, expired, canceled, or who had unknown license status all declined by a small amount during the 7 years (see figure A.12). (The terms used in this paragraph and other terms used throughout the report are further defined in the next section.)
The original Unlicensed to Kill report raised some serious issues about states’ ability to control the unlicensed driving situation. First, to find out if unlicensed drivers are overrepresented in the fatal crash statistics, it would be good to have a reliable estimate of the population of drivers who are unlicensed or driving under an invalid license. Second, to help states better understand and address the problem of drivers who oper-ate a motor vehicle without a valid license, it is important to explain the reasons why states differ so much in their overall experience on this issue, and why they differ in particular types of license status violations among drivers involved in fatal crashes. The questions to be answered include:
• Why are some states’ proportion of drivers with an aberrant license status who are involved in fatal crashes so much lower than the national average? Do they have effective programs in place that might work well in other states?
• Why do even states with very good records appear to have problems with particu-lar classes of license violations?
• For offenders driving under the influence of alcohol, how do the state’s alcohol laws and administrative procedures affect a person’s behavior with respect to the willingness to drive without a valid license?
• What effect is there, if any, of recent laws suspending the licenses of people who fail to pay child support, library fines, or commit other offenses that are not re-lated to driving?
• How do state procedures for notification of changes in license status affect the way courts and drivers behave?
viola-tions and the prosecution of repeat offenders affect the state’s proportion of drivers without a valid license?
• Are there other factors to consider, such as societal norms, residency or citizenship status, and insurance costs? If so, how can these best be addressed, and by which government entities?
This report seeks to answer each of these questions by presenting the results of our research in the context of the available literature, data, and expertise at the state and national levels. This chapter introduces the issues in the context of a survey of the relevant literature spanning the past three decades. Chapter 2 presents the methods followed in conducting the research. Chapter 3 presents information on the laws, driver-control practices, and procedures of six states that seek to reduce drivers’ ability to drive without a valid license. Chapter 4 presents recommendations gleaned from successful state practices that could be emulated by other states and promoted by AAA clubs and the AAA Foundation for Traffic Safety.
There is a growing body of literature related to state driver-control practices, in particular the behavior of drivers with an aberrant license. All states face similar prob-lems in identifying these drivers, stopping them from operating a motor vehicle with-out a valid license, and ultimately bringing them back into compliance with state laws regarding obtaining or reinstating a license. As will become clear from the following literature review, many of these issues center on controlling repeat offenders, especially with respect to state laws for driving under the influence (DUI) of alcohol. A second and inextricably related set of issues centers not on DUI but on multiple offenders against state laws regarding the payment of fines, attendance at mandatory court ap-pearances, and repeatedly driving without a valid license. Thus, a habitual drunk driver may also be a scofflaw with respect to driving while suspended (DWS), and a habitual DWS driver may be one who earned that suspension not by drunk driving but by failing to appear in court or pay a fine (related terms include driving while revoked, or DWR, and driving while unlicensed, or DWU). These issues are dealt with in detail in chapter 3.
Definitions
Throughout this report, the term “aberrant license status” is used to refer to drivers who lack a valid license. This term includes the following types of license status:
• Suspended: These are drivers who have temporarily lost their driving privileges for a period defined by law. Typically, they must also meet state- or court-imposed prereq-uisites for reinstatement, but they are eligible for reinstatement as soon as the suspen-sion period has elapsed.
• Revoked: These are drivers who have completely lost their driving privileges for an indefinite period. Like suspended drivers, before they can ever obtain a new license, they must satisfy all court- and state-imposed requirements. Typically, a driver whose
license is revoked is not eligible for a new license until a minimum period of time has elapsed. Typically, revoked drivers also cannot regain their driving privilege unless they go through the full license application process.
• Unlicensed: These are drivers who, to the best of the state’s knowledge, have never held a valid driver’s license.
• Expired: These are drivers who, when their license was due for renewal, failed to complete the renewal process.
• Canceled: These are drivers whose driving privileges have been removed but typi-cally not because of a pattern of violations in the state. Cancellations may be imposed for medical reasons (i.e., on a doctor’s advice or because of a failed eye exam at the department of motor vehicles) or because, after issuance, the state identified problems in the driver’s history when that driver transferred his or her license from another state. • Denied: These are drivers who were denied driving privileges by the state for what-ever reason. Many states keep track of license denials using “dummy records” tied to the individual so that individuals cannot easily attempt to obtain a valid license by going to a different licensing location in the same state.
• Unknown: This category is only meaningful as a notation in a data file (such as crashes) and was included in the analyses presented in appendix A. It is not relevant for discussions of license sanctions with state experts as discussed in the main body of the report.
Several terms having to do with state laws, licensing practices, and driver-control programs are used in the report. These are defined as follows:
• Administrative per se: This term describes the laws establishing an administrative process for dealing with violations of the maximum allowable blood alcohol content (BAC) for drivers in a state. States with administrative per se laws also have a set of procedures in place for suspending the driving privileges of a person who violates the BAC limit without the need for a court trial—that is, the responsible state agency can suspend a driver for a BAC violation even if the court does not convict him or her on the corresponding DUI offense.
• Administrative license sanctions: This term refers to any sanctions legally imposed by state agencies without first requiring court orders. The exact scope, procedures, and limitations of administrative license sanction programs vary among states. In general, they are used to provide rapid, consistent treatment of offenders against the state’s DUI laws or its DWS, DWR, and DWU laws. Typical administrative sanctions include li-cense suspension, mandatory evaluation or treatment, fees, and education.
a judge. In some states, for example, only a judge can revoke a license, but the state’s department of motor vehicles (DMV) can administratively suspend. In some states, judges also order suspensions.
• DUI or DWI: These acronyms refer to “driving under the influence (of alcohol or other drugs)” and “driving while intoxicated.” State laws define DUI or DWI differ-ently but always with reference to the state’s maximum allowable BAC. This is typically considered a serious moving violation and will often result in a mandatory court ap-pearance. In states with an administrative per se law, the fact that a driver was cited for DUI or DWI will also initiate the administrative penalties independent of the court case.
• DWS, DWR, or DWU: These acronyms refer to “driving while suspended,” “driv-ing while revoked,” and “driv“driv-ing while unlicensed.” The term is used to denote the DWS, DWR, or DWU citation (a moving violation) and/or the license status of the driver at the time of a crash or other event.
• Ignition interlock: This is a device that renders a car inoperative unless one or more preconditions are met. In DUI driver-control programs, the typical ignition in-terlock device requires the driver to give a breath sample which is then analyzed for the presence of alcohol. If there is alcohol present (above some minimum threshold value), the car will not start. Other variations are used to ensure that an individual does not operate the vehicle, or is the only operator of a vehicle.
• Implied consent: States’ implied consent laws typically define the rights and re-sponsibilities of drivers holding a state-issued drivers license. In particular, there is an implied consent to a blood, breath, or urine test for BAC. Violations of implied consent laws typically lead to automatic (administrative or court-ordered) suspension of driving privileges.
Characterizing the Problem
Drivers who operate a motor vehicle without a valid license are believed to be among the worst drivers on the road. This makes good logical sense from the point of view that to drive under suspension or revocation, one must first have done something to earn that suspension or revocation. The case is harder to make, paradoxically, for unlicensed drivers, simply because so little is known about them (how many there are, what proportion of them are cited or convicted, and what proportion are involved in crashes).
DeYoung, Peck, and Helander (1997) attempted to estimate the exposure and fatal crash rates of suspended, revoked, and unlicensed drivers in California. Using a quasi-induced exposure method with data from two-vehicle fatal crashes, they were able to estimate the relative overinvolvement in fatal crashes of drivers without a valid license. The method developed a ratio (the involvement rate) of the proportion of
driv-ers at fault divided by the proportion of drivdriv-ers not at fault for each of three license-status groups: valid, driving while suspended or revoked (DWS/DWR), and unlicensed. By setting the involvement rate of validly licensed drivers as the norm, they calculated that DWS/DWR drivers are 3.7 times more likely to be involved in a fatal crash than are validly licensed drivers. Unlicensed drivers are 4.9 times more likely to be involved in a fatal crash. This methodology has its limitations, most notably the need to establish the identity of the driver who is at fault in fatal crashes. However, it is perhaps the best method we have now for estimating overinvolvement that corrects for exposure, espe-cially for unlicensed drivers.
Other researchers have attempted to learn about the driving behavior of suspended and revoked drivers using the interview approach. For example, Ross and Gonzales (1988) interviewed 71 drivers whose licenses had been suspended or revoked because of a DUI offense in Tucson, Arizona, and Albuquerque, New Mexico. Of the 68 drivers from whom complete information was collected, 45 (66%) reported that they contin-ued to drive while under suspension. Age, gender, and repeat offender status make a difference in this proportion, with 77% of young men driving while suspended relative to 70% for all women, and 52% for older men. It is surprising that first offenders were more likely to drive (94%) under suspension than were repeat offenders (52%), but this result is likely due to the supervised probation program for repeat offenders in both communities included in the sample.
California has recently received a grant to develop a more precise profile of the characteristics of drivers whose licenses have been suspended and revoked in general (not just DUI-related suspensions or revocations). This research will be useful in fur-ther defining the relative risk of crash involvement by these drivers. The results were expected to be published by October 2002.
The Paradox of Reinstatement
Several studies have shown that drivers with suspended and revoked licenses fre-quently never reinstate their license (or fail to apply for a new one). Given the higher risk of fatal crash involvement associated with drivers who operate a motor vehicle without a valid license, the fact that as many as 50% of suspended and revoked licensees never reinstate their license gives cause for concern. Voas (2001) reported a study fol-lowing the driving records of 19,203 DWI first offenders and 6,927 DWI second of-fenders convicted in 1987 in Oregon. Three years later (in 1991), 50% of the first offenders and 71% of the second offenders had not reinstated their license, despite the fact that for both groups the original suspension period had expired in 1988 or 1989. Because only 28% of DUI suspended drivers are cited for a moving violation or DWS during their suspension, it is unlikely that the reason drivers fail to reinstate is that their suspensions have been extended for DWS or other violations. The failure to reinstate appears to be primarily a personal choice of the drivers, at least for DUI suspensions.
Paradoxically, there is evidence to suggest that these drivers, though they lack a valid license, may behave in a safer fashion than those who do reinstate or those who are granted a hardship license. Voas (2001) also presented data showing that for Ohio DUI offenders, those who reinstated had consistently higher rates of DUI arrests, moving violations, and crash involvement than those who failed to reinstate.
The key to explaining these results seems to be in an alteration of the driving behavior of drivers whose licenses have been suspended or revoked. They do still drive but probably drive less and take much more care when they do drive. Ross and Gonzales (1988) found that almost half (46%) of DUI-suspended drivers relied on another driver for transportation during their suspension period. Those who did drive frequently re-ported driving more carefully to avoid being pulled over.
Evidence that Suspension and Other Sanctions Work
The reinstatement paradox reviewed by Voas (2001) raises the question of whether it is safer to bring a driver back into compliance with state licensing laws or to let that driver continue to drive without a valid license. The obvious policy problem with adopt-ing a laissez-faire attitude toward reinstatement is that DWS drivers are generally not insured and, though they may behave more safely than they would if they reinstated, they are still not very good drivers to begin with and are still more likely than the average driver to cause a crash. They are “safer” only in comparison with their own earlier behavior.
Song and Jones (1991) described a similar problem when hardship permits are granted to suspended drivers. They compared 3,425 offenders who were granted hard-ship permits with a sample of 32,603 offenders who were eligible for a hardhard-ship permit but did not request one, and they found that those granted a hardship permit had a higher crash rate than the drivers who remained under suspension. The obvious expla-nation for this effect was the higher exposure assumed for drivers who were granted a hardship permit (and thus could drive legally) versus those who were still suspended. Both groups were probably still driving, but the still-suspended drivers were probably driving less, and perhaps, in addition, more cautiously.
Hagen (1978) provided evidence that suspensions have a positive effect on driver behavior, even after eligibility for license reinstatement. He followed the 6-year driving record of 1,501 matched pairs of multiple DUI offenders in California. One member of each pair was given the mandatory license suspension or revocation appropriate for their number of earlier convictions. The other member of each pair managed to avoid the mandatory suspension through successful defense against the earlier convictions in court. A survival analysis shows that the suspended drivers had lower recidivism of the DUI offense and a lower crash involvement rate than those who “beat” the suspension. These effects lasted longer than the suspension period.
Hagen did not report whether the suspended drivers actually did reinstate; how-ever, the duration of the effectiveness of the suspension action seems to coincide with the end of mandatory proof of financial responsibility imposed on suspended drivers at the time in California. Hagen supposed that the drivers had reinstated and that this requirement for 3-year mandatory proof of insurance served as a reminder to drive safely.
Jones (1989) found a general deterrent effect for the state’s implied consent law in that the proportion of alcohol-related fatalities and night-time crash-related serious injuries both dropped in close temporal proximity to the passage of the law in 1983. California (Rogers 1995, 1997) found both a general and specific deterrent effect of the state’s administrative per se law (which became effective January 1, 1990). The general effect was shown through overall reductions in the accident rate timed to the imple-mentation of the per se law. The specific effect was found through a similarly timed reduction in recidivism among DUI offenders.
Grosz, Zeller, and Klein (2001) reported compelling evidence of a specific deter-rent effect of “alcohol problem resolution” (defined by the researchers as completion of mandatory courses and payment of fines). Florida law allows DUI offenders to rein-state by showing proof of enrollment in an approved advanced driver improvement or DUI course. Some drivers reinstate at this point, whereas others reinstate once they have actually completed the course(s) and paid any fines. Florida DUI offenders who fail to “resolve” their behavioral issues before reinstatement had 75% higher violation rates and 97% higher crash rates than drivers who reinstated after resolving their behav-ioral issues.
Wells-Parker and others (1995) performed a meta-analysis on the effectiveness of remedial interventions with DUI offenders. They concluded—on the basis of the re-sults of 215 published research reports—that a combined approach of education, coun-seling, and “contact” probation was 7-9% effective in reducing later DUI recidivism and later crash involvement. They also concluded that a combination of license actions and remediation provided the most effective program for improving the traffic safety of drivers with prior DUI offenses. They did not look at the effects of more recent types of driver-control practices such as vehicle impoundment or ignition interlock.
Rodgers (1994) indicated that administrative plate impoundment reduced recidi-vism of multiple DUI offenders in Minnesota. Moreover, drivers whose plates were impounded at the time of arrest were less likely to be cited for another DUI offense than those whose plates were impounded at a later date, through a mailed notice from the Department of Public Safety, thus giving some credence to the notion that imme-diacy of the punishment may play a role in later behavior.
California studied the effectiveness of vehicle impoundment programs for first-time and multiple DWS, DWR, and DWU offenders (DeYoung 1997, 1998). The specific deterrent effect of vehicle impoundment was a 20-35% reduction in DWS
convictions, other traffic convictions, and crashes for drivers whose vehicles were im-pounded. This effect was strongest among recidivist offenders, who typically are con-sidered the most difficult group to affect with traffic safety programs. There was no strong evidence of a statewide general deterrent effect of the impoundment sanction in California.
Voas, Tippetts, and Taylor (1998) found a specific deterrent effect of vehicle im-poundment for multiple DUI offenders in Ohio, both during the vehicle impound-ment period and after the vehicle was returned to the driver or owner. During the impoundment period, DWS offenses were reduced by as much as 84% and DUI of-fenses were reduced by as much as 100%. Following the return of the vehicle, subse-quent DWS offenses were reduced by as much as 53% and subsesubse-quent DUI offenses were reduced by as much as 58%.
Voas and Tippetts (1995) evaluated the deterrent effect of “zebra sticker” laws in Oregon and Washington. These laws created an administrative procedure under which an officer making an arrest for DWS, DWR, or DWU could seize the registration of the vehicle being driven. The DMV would then issue a zebra tag, which is a distinctive, striped sticker that must be placed over the “year” portion of the vehicle’s license plate. The presence of a zebra sticker was ruled to provide probable cause for law enforcement officers to stop that vehicle any time it was seen moving on a public roadway. In prac-tice, the zebra stickers were given to DUI offenders who were later caught driving without a valid license. In Oregon, where the law was implemented much more aggres-sively, there was evidence for both general and specific deterrent effects.
Summary
The studies performed to date on DWS, DWR, and DWU are obviously closely linked to studies of DUI recidivism. More recent work has begun to look more closely at drivers who were suspended for reasons other than DUI violations, but details de-scribing these “other” subpopulations and statistically valid evaluations of programs designed to address their specific needs are lacking at this time. The National Highway Traffic Safety Administration (NHTSA) has funded a study in California that may shed light on some of these issues.
It is clear that well-crafted, aggressively enforced laws can have an effect on the behavior of suspended DUI offenders. It also seems probable that suspension of driving privileges is generally interpreted (by the drivers) to mean something short of a total ban. The majority of them still drive at least some of the time. They may drive less and drive with greater care while under suspension, but they still drive.
The reinstatement paradox remains unresolved. The NHTSA has funded a fol-low-up study to the work by Voas and his colleagues, and it is hoped that they will be able to offer some concrete suggestions to help states implement effective changes in their suspension and revocation practices.
It is important to note that there are sizable gaps in the data available on drivers’ behavior in general and that these gaps cause a corresponding lack of completeness in the literature on traffic safety. The reinstatement paradox makes it clear that suspended and revoked drivers who choose not to reinstate often drive more cautiously than the same individuals would have had they not reinstated.
It is logical to assume, however, that the same drivers were probably less safe in the months leading up to the point when the state took action. The Fatality Analysis Re-porting System data on fatal crashes indicate that drivers with past suspensions and who currently drive under suspension are more likely to be involved in fatal crashes than are drivers who are not suspended. But this is not to say that there may not be a large number of unsafe drivers who have yet to be caught. The use of only data on fatal crashes may also mean missing important clues to driver behavior that might become evident if data for crashes of all levels of severity were routinely available for analysis.
In addition, while it makes good logical sense that license sanctions do work, the lack of complete data makes it impossible to be certain just how much of a deterrent is possible with license sanctioning programs. The fact that people continue to drive while their license is suspended or revoked (and while they are completely unlicensed) means that the general deterrent effect of license sanctions is not as strong as it could (or should) be. The question addressed in the remainder of this report is how best to imple-ment and manage programs aimed at keeping these drivers from behind the wheel because if they do not drive, they are not contributing to traffic safety problems.
It is also possible to look at this issue by assuming that the sanctioned drivers will continue to operate a motor vehicle and then seek programs to make these scofflaws as safe as possible. The goal of the research reported here is not to improve sanctioned motorists’ driving behavior but to identify the most effective ways to keep them from driving at all. The following chapters fill in some of the gaps in the current literature by examining successful practices, including the experiences of safety practitioners in sev-eral states.
2. Research Methods
Choosing states for review in developing a list of sample states, an attempt was made to identify states that have enacted and studied the effects of laws such as admin-istrative license suspension and vehicle actions such as impoundment, plate seizure, or special markings. Primarily, however, the choice of states was based on the data analysis presented in appendix A. In particular, those states that were lower than the national average in the proportion of crashes involving drivers with any aberrant license status were considered candidates. In addition, the selection process was consciously biased toward states with a large population so that any changes in the measures used in the earlier Unlicensed to Kill report and updated in appendix A could be viewed as real and not as an artifact of relatively small shifts in the population. There was no attempt to select states perceived as representative at either the national or regional levels. Instead, a deliberate decision was made to focus on the states that appeared, from the data, to have had some success at reducing the involvement of drivers with an aberrant license status in fatal crashes.
Five out of the six states chosen for this study were lower than the national average in their percentage of motorists driving with an aberrant license status:
National average 13.5 California 21.1 Florida 12.0 Indiana 10.7 Michigan 12.2 Minnesota 7.2 Oregon 13.0
Although California has a higher percentage of motorists who are driving with an aberrant license status, table 2.1 reveals that California is lower than the national aver-age for drivers in fatal crashes who have a revoked license and have also had earlier license suspensions or revocations. Due to California’s large population, this steadily decreasing trend in drivers with an aberrant license status involved in fatal crashes from 1993 to 1999 can be viewed as a real change and not due to a shift in population.
Once a set of candidate states were identified, participation was solicited through telephone contact followed by a formal letter describing the project, the reasons they were selected, and again asking them to participate in the review. Each state was in-formed of the level of effort required to participate. They were asked to provide any written documentation (data tables, analytic reports) of their driving while suspended (DWS), driving while revoked (DWR), or driving while unlicensed (DWU) problem, along with any available descriptions of their laws and procedures for dealing with DWS, DWR, and DWU drivers. Each state also identified key personnel that could be interviewed as the project progressed.
Seven states were invited to participate, and six states ultimately agreed to do so: California, Florida, Iowa, Michigan, Minnesota, and Oregon. New York elected not to participate. Chapter 3 provides the data used in making these selections. Appendix A gives additional details for these and every other state.
Review of State Laws
As part of the process of selecting states, each state’s laws and regulations related to driver licensing and control were categorized and reviewed. Once the final six partici-pating states were selected, their laws were more thoroughly reviewed. The source for most of this material was via state web sites, supplemented by documents provided by the key contact personnel in each state. The review included the laws on obtaining a driver’s license, offenses for which license suspension or revocation are common, proce-dures for suspending or revoking licenses, and proceproce-dures for drivers to regain their license.
State Site Visits and Interviews
Members of the project team visited the participating states. The site visits were used to gain a thorough understanding of the state’s laws and practices regarding licen-sure, loss of license, reinstatement, and penalties for violating the licensure provisions
Table 2.1 Earlier License Suspensions or Revocations for Drivers from Participating States with Revoked Licenses Who Were Involved in Fatal Crashes, 1993–99
State Previous Suspensions or Revocations (first row is number of drivers;
second row is percent) 0 1 2 3+
California 97 91 57 59 36.7 19.3 21.6 22.3 Florida 11 17 6 5 28.2 43.6 15.4 12.8 Indiana 2 1 66.7 33.3 Michigan 20 22 20 44 18.9 20.8 18.9 41.5 Minnesota 22 38 18 40 18.6 32.2 15.3 33.9 Oregon 6 4 4 40 11.1 7.4 7.4 74.1 National average 1,172 1,214 891 1,754 23.3 24.1 17.7 34.8
of the law. Standard practices in the enforcement and adjudication arenas were also explored through interviews with representatives from those fields in each state.
The team interviewed key personnel in each state’s driver-control and -licensing branch of the department of motor vehicles (or the equivalent agency). A sampling of individuals from other agencies (enforcement, adjudication, and highway and traffic safety) was also interviewed, as needed. To set up interviews, the initial key contact personnel provided a list of the other people to be interviewed. In all six states, the interview schedule was set up by one of the state’s own employees.
A second goal of the interviews was to obtain state experts’ opinions on what measures should be implemented to improve their own state’s ability to identify licen-sure scofflaws and remove them from the roadways. This discussion was intended to go beyond the laws and practices of the state to explore issues such as:
• Notification process for suspension or revocation • Appeals processes
• Tracking systems in place
• Ideas for reducing the incentive to drive without a valid license • A profile of “typical” DWS, DWR, and DWU drivers
Because of travel cancellations in September 2001, two of the site visits were changed to conference calls. Participants in California and Oregon agreed to stick to the original interview schedule, but the interviews were conducted via speakerphone rather than face to face. The only potential drawback to this procedure was that the interview team did not have access to any handouts the participants might have brought with them during the interview. In both cases, however, the materials were delivered to the inter-view team soon after the interinter-views, and all participants agreed to be available for fol-low-up questions should the need arise. The other four states were visited for on-site interviews as planned.
State Comparisons
Each state was asked to provide data on the rate of suspension, suspension dura-tions, proportion of the driving population under revocation, reasons for suspension or revocation, and recidivism (i.e., rates of resuspension). The original reason for obtain-ing this information was to develop comparisons based on such measures as:
• Number of suspensions and revocations in the most recent complete calendar year (i.e., in 2000)
• A year-end “snapshot” of the proportion of drivers under suspension or revoca-tion, and the reasons for those actions
• Duration of all suspensions that ended in the most recent complete calendar year • Number of persons receiving a second (or greater) suspension beginning during
the most recent complete calendar year (i.e., a count of those suspensions which were not the driver’s first ever)
As it turned out, not all states can answer all of these questions on the basis of the data available to them through the driver history file. This, of course, led to an obvious set of recommendations for system upgrades and corresponding analyses.
Standard Questionnaires
Before the interview sessions, states were provided with a set of standardized ques-tionnaires (see appendix E) that addressed the following issues:
• Suspension and revocation tracking • Punishment of recidivists
• Vehicle and plate impoundment
• Programs and strategies for removing these drivers from the road • Court and judicial outreach
• Notification procedures • Appeal procedures
• Hardship exemptions and restrictions • Enforcement powers
3. Practices in Six States
Tables 3.1 and 3.2 summarize state laws on driving under the influence (DUI) of alcohol and laws on driving without a valid license. The laws of the six participating states are presented in table 3.1. The columns give the illegal per se alcohol limit, whether the state has an open container law and a repeat or habitual offender law, whether the state’s laws allow various vehicle-based sanctions (ignition interlock, impoundment, special plates or stickers, vehicle forfeiture, and blocking of registrations), and the dura-tion of administrative license suspension or revocadura-tion for the first DUI offense. Table 3.2 gives the averages for all other states (besides the six participating states) with regard to their DUI laws and laws on driving without a valid license.
As can be seen in table 3.1, the six participating states have a mix of 0.08 and 0.10 blood alcohol content (BAC) per se laws. They all have open container and ignition interlock laws. Three of the six have special repeat offender laws on the books. Five allow vehicle impoundment. Two have special plates or markings for repeat offenders. Four allow vehicle confiscation. Two also block vehicle registrations by DUI offenders. The most notable comparison between all other states and the six participating states involves vehicle impoundment. The majority of other states (78%) do not have laws regarding vehicle impoundment; however, five of the six participating states do have such laws.
The sources for the information are listed in the notes at the bottoms of tables 3.1 and 3.2. Readers interested in the particulars of any state’s laws are encouraged to con-tact that state directly or visit the official state web site. State laws covering the same topic differ markedly in the exact language used, in the possible penalties that can be imposed, and in the limits of both judicial and administrative processes regarding licen-sure and license sanctions. The rest of this chapter presents the highlights from each of the six state interviews.
California Highlights
CHARACTERIZINGTHE DWS AND DWR EXPERIENCE
For 1993-99, 21% of drivers in fatal crashes in California had an aberrant license status at the time of the crash (see appendix A). However, across the 7 years, California showed a dramatic downward trend in the involvement of drivers with an aberrant license status in fatal crashes, from a high of 25% in 1993 to a low of just above 18% in 1999. Most of that decrease came from reductions in the percentage of drivers who were unlicensed or suspended at the time of the fatal crash. California was chosen for inclusion in this study because of this downward trend and because a large portion of the research on suspended and revoked drivers has come out of the state’s Department of Motor Vehicles (DMV).
Ta
ble 3.1
Impaired Driving Laws of the Six Participating States
State Illegal Open Repeat V ehicle V ehicle V ehicle Special Plate Allow V ehicle Suspend A verage Days of Per Se Container Of fender Interlock Impoundment Immobilization or Markings Confiscation V ehicle ALR/ALS for ( BAC a) Registration First Of fense b California 0.08 Y es No Y es Y es No No Y es No 120 Florida 0.08 Y es Y es Y es Y es No No No No 180 Iowa 0.10 Y es Y es Y es Y es No Y es No No 180 Michigan 0.10 Y es Y es Y es Y es Y es No Y es Y es Minnesota 0.10 Y es No Y es No No Y es Y es Y es 90 Oregon 0.08 Y es No Y es Y es No No Y es Y es 90
a“BAC” is blood alcohol content. b“ALR/ALS” is administrative
license suspension or revocation
.
The cell is empty for Michigan because the state does not
use this legal category
. Sources: National Highway T raf fic Safety Administration,
State Legislative Fact Sheets
, current as of January 2001; National Highway
T raf fic Safety Administration, Digest of State Alcohol—Highway
Safety Related Legislation
, 19th edition, current through January 2001; Insurance Institute for Highway Safety data, current as of March 2001.
Ta
b
le 3.2
Impaired Driving Laws of
Other States Illegal Open Repeat V ehicle V ehicle V ehicle Special Plate Allow V ehicle Suspend A verage Days of Per Se Container Of fender Interlock Impoundment Immobilization or Markings Confiscation V ehicle ALR/ALS for ( BAC a) Registration First Of fense b 0.08 42% Y es 56% Y es 44% Y es 78% Y es 22% Y es 2% Y es 4% Y es 51% Y es 36% 102 0.10 53% No 44% No 56% No 22% No 78% No 98% No 96% No 49% No 64%
a“BAC” is blood alcohol content. b“ALR/ALS” is administrative
license suspension or revocation
. Sources: National Highway T raf fic Safety
Administration, State Legislative Fact Sheets, current as of January 2001; National Highway
T raf fic Safety Administration, Digest of State Alcohol—Highway
Safety Related Legislation
LAWS AND PROCEDURES
Suspension and revocation. California’s motor vehicle code allows for three sources of license suspension:
1. Court suspension, in which the judge actually takes the driver’s license and holds it.
2. Court ordered suspension, in which the judge orders the DMV to suspend the license.
3. Administrative suspension, in which the DMV automatically suspends the li-cense on the basis of the driver history (i.e., the driver qualifies as a “negligent operator”), or because of an administrative per se law violation, a financial responsibility law violation, or a mental or physical disability.
California uses certified mail to notify drivers of a suspension. The state has found that this process works well to provide proof of notification required if the case goes to court. Proof of notification is a major issue in California. Gebers, DeYoung, and Peck (1997) studied the “proof rate” of four suspension notification methods (certified mail, personal contact, prepaid reply envelope, and masking the DMV’s return address). They found that the best proof rate (60-70%) was achieved using certified mail with a return receipt. This also increased the percentage of convictions for later citations for driving while suspended (DWS) or driving while revoked (DWR), while reducing the number of convictions and crashes.
Drivers whose licenses are suspended administratively have 10 days after notifica-tion to apply for an administrative hearing. The hearings are generally held within 30 days, and before the hearing the person is allowed to drive under a stay-of-suspension notice. The hearing officers are DMV employees. They are charged with confirming that there was probable cause for the original traffic stop, that the person was lawfully arrested, and that the person was actually in violation of the law. Approximately 87% of hearings result in the suspension being sustained.
Restricted licenses. Restricted licenses are generally granted to first- or second-time suspendees, as long as they meet the requirements of having paid their fines, complet-ing any mandatory treatment programs and complycomplet-ing with the state’s insurance re-quirements. Restricted licenses generally allow the person to drive to, from, and during work. For first-time DUI offenders, only those drivers who agreed to a BAC test are eligible for a restricted license.
Vehicle impoundment and seizure. California law provides for both vehicle im-poundment (for first and subsequent offenses) and seizure (for multiple offenders). In practice, the vehicle impoundment law is much more frequently applied and results, ultimately, in a forfeiture because most of the impounded cars are worth less money than the cost of their redemption from the impoundment yard. California’s impound-ment law allows local governimpound-ments to set the fees to meet the costs of running the program.
The vehicle impoundment law applies regardless of whether the offender is the owner of the vehicle. If the vehicle’s owner knowingly allows a suspended or revoked driver to use his or her car, that vehicle is eligible for impoundment or seizure. In the case of habitual offenders, only one in three was the owner of the vehicle impounded at the time of their DWS arrest. Approximately half of the impounded vehicles are sold under lien, so in effect the impoundment results in seizure and forfeiture about half the time.
Ignition interlock. California law requires mandatory imposition of an ignition interlock for DWS cases where the initial suspension was for a DUI offense. Courts are required to impose the installation of an interlock device upon conviction. The DMV administrative procedures also allow multiple DUI offenders (second or greater convic-tion) to apply for a restricted license with an ignition interlock once they have served the first half of their suspension.
STATE EXPERTS’ REVIEW: WHAT WORKSAND BARRIERS
What works. California’s vehicle impoundment program works (DeYoung 1997, 1998). It has been described as a method to get older, less safe, more polluting vehicles off of the roadway. In California’s experience, the law results in eventual forfeiture in approximately half the cases. In the vast majority of cases involving a DWS or DWR with a DUI arrest, the driver was not the owner of the vehicle. The administrative per se law has also been found to have a deterrent effect on drinking and driving in the state (Rogers 1995, 1997).
Barriers. Few of the drivers who are eligible for a restricted license ever apply for one. Among per se law violators, only 18,000 of 85,200 eligible drivers ever applied for the restricted license. The main reasons cited for this low application rate are a lack of knowledge on the part of drivers and the costs associated with meeting the precondi-tions.
Reinstatement of licenses is another big concern in California. The state’s studies show that fewer than 50% of those eligible for license reinstatement do so (within a 3-year window used for the analysis). A likely cause of this reluctance to reinstate is the costs involved, especially with respect to insurance. For 3 years following the end of a suspension, drivers must show proof of insurance to be reinstated. After the 3 years, the same driver can obtain a license without proof of insurance.
A problem in the field is that officers are presented with a confusing array of infor-mation when they call up a driver history. There are delays inherent in the system for calling up a driver history record, as well. These two factors combine to make it less likely that officers will check the driver history when making a traffic stop. The result is that many cases that would be eligible for a DWS or DWR arrest are not made until after the fact (if at all) and that many vehicles that could be impounded are not. Failure to check the license status means that the DMV would have to put resources toward a
comparison of charges with the license status after a person is charged (as was done in a pilot program in Ventura County; DeYoung 1990). If a person is eligible for enhanced charges, the DMV has the option of notifying the district attorney’s office to flag spe-cific cases. This practice is apparently not routine.
Prosecutors use DWS and DWR charges as a source of plea bargaining, especially when more serious charges (e.g., DUI) are under consideration. This leads to a higher rate of conviction in DUI cases but degrades the seriousness of DWS and DWR charges. Of the DWS and DWR cases that are not pled down, only about a fourth result in a sentence that meets the minimum standards in the law. This is especially true with respect to mandatory sentences requiring ignition interlocks. In many cases, judges are reluctant to impose such penalties.
California’s courts require proof of service for notifications of suspension. The state uses certified mail in most cases in an attempt to raise the “good service” rate. The exact proportion of “good service” notifications is not known.
The courts are allowed to suspend drivers’ licenses for a variety of nondriving offenses. The result is that many suspensions have little or nothing to do with driving safety. This adds to the confusion for officers in the field and for prosecutors and courts. California’s experts on DWS and DWR and unlicensed drivers believe that the system, as it exists now, has too many incentives for not obtaining a license or reinstat-ing one after a suspension. Unlicensed drivers are often doreinstat-ing so because they are un-documented aliens and/or because they cannot afford to meet the insurance requirements. Insurance costs are the reason most often cited for a driver’s failure to reinstate his or her license after a suspension.
Florida Highlights
CHARACTERIZINGTHE DWS AND DWR EXPERIENCE
For 1993-99, 12% of drivers in fatal crashes in Florida had an aberrant license status at the time of the crash. In 1999, Florida experienced its best performance in the 7-year study period, with just under 10% of drivers in fatal crashes having an aberrant license status, down from a high of 14% in 1994. Florida was selected for the study because these proportions compare favorably against the national average of 14% dur-ing the 7-year period.
Florida has approximately 14 million registered drivers (2000 data). In 2000, more than 1.1 million license sanctions were imposed, including 1.06 million suspensions, 85,000 revocations, and 15,000 cancellations.
LAWS AND PROCEDURES
Suspension and revocation. Administrative suspensions are based on the number and type of convictions via a point system. Accumulating 12 points in 12 months results in an automatic 30-day suspension. Accumulating 18 points in 18 months re-sults in a 90-day suspension. Accumulating 24 points in 36 months rere-sults in a 1-year suspension. In addition, the state has an administrative license revocation (ALR) law, under which the arresting officer takes the driver’s license and issues a citation that also serves as a 10-day temporary permit. ALR suspension durations are indicated on the citation as 6 months for a first DUI offense and 1 year for a subsequent DUI offense. Test refusals result in a 1-year (first offense) or 18-month (subsequent offense) suspen-sion. Florida also administratively suspends licenses when provided notice of a lapse in insurance coverage.
Florida’s DWS law allows the officer to charge a driver with DWS “with knowl-edge” or “without knowledge,” depending on whether they believe the person knew about the suspension. Florida’s notification of suspension program is such that it is possible for drivers to be unaware that their license has been suspended. A DWS-with-out-knowledge charge is treated as a civil infraction. A DWS-with-knowledge charge is treated as a criminal infraction and is also recorded on the driver history, even if the charges are ultimately dismissed. Many drivers cited for DWS claim that they did not know they had to pay a reinstatement fee; so even though their suspension period is over, they are still suspended because they have failed to follow directions. Enforcement officers in Florida indicated that drivers commonly report never having received the notice of suspension and that it is common for those cited for failure to produce a license to claim identity theft when they appear in court.
In the field, officers are allowed by law to seize the license of a driver who has failed to pay child support. In practice, they seize the license of anyone subject to an admin-istrative suspension because department policy requires that the license be attached to the citation.
Courts can order a license suspension for failure to pay, failure to appear, “check fraud,” failure to pay child support, and failure to pay for gasoline at a filling station. All conviction-related suspensions are separate from administrative actions. The courts re-port that most people cited for DWS or DWR in Florida were originally suspended for failure to pay fines. Once the charges are elevated to criminal DWS, people are more likely to pay because the alternative is jail time.
For ALR suspensions, drivers have 10 days after being cited to request an adminis-trative hearing. The hearings are held within 30 days of the original citation date. Driv-ers have two options: formal or informal review. If a driver requests a formal review, he or she will receive a temporary license while waiting for the administrative hearing. Temporary licenses are not extended beyond the initial 10 days in the case of informal reviews. In a formal review, the driver is allowed to subpoena witnesses (usually the