Basic Performance Tips
Purpose
This document is intended to be a “living” document, updated often, with thoughts, tips and tricks
related to getting maximum performance when using Tableau Desktop.
The reader should, also, refer to the “Performance” chapter in the Tableau Desktop Manual.
In this document, “performance” will be defined as getting the fastest time to completion for a given
task.
Environmental
First, we’ll look at some basics – all too often the things you cannot change easily!
The client machine
•
64 bit OS is faster than a 32 bit OS.
•
More memory is better.
•
Faster disk, backplane, memory etc. is better.
Network bandwidth
•
When large results sets are being returned to a client, from a server, more bandwidth is
better.
The Tableau Server
•
More memory is, usually, better.
•
Faster disks are, usually, better.
•
More/faster CPUs can be better.
The browser
A recent test, two side by side machines running the same pull from the Tableau server.
•
IE7 returned results in 11 seconds
Database
In the real world, you will, typically, “get what you pay for”. More expensive databases are, more often
than not, faster than the cheaper ones. The key is to get the optimal balance between cost and
performance.
Within your database, there are a few things to verify are properly tuned. Part of the ad hoc nature of
Tableau is to allow any dimension, optimized or not, to be used within a visualization or report. It is
especially important to look at tuning your database after you have published content to Tableau Server
as the views are essentially fixed to which dimensions the database will be grouping the data.
Application tuning
If running a relational database, a finely tuned database instance and application will yield better
performance results.
INDEXES
•
Make certain you have indexes on all columns that are part of table JOINs.
•
Make certain you have indexes on any column used, within Tableau, in a FILTER.
•
EXPLICITLY define PRIMARY KEYs, on all tables, if possible.
•
EXPLICITLY define all FOREIGN KEY relationships. This enables Tableau to bypass many of
its integrity checks, since it knows the database is doing that verification.
•
Many DMBS environments have management tools that will look at a query, and,
recommend indexes that would help.
For Large Data
consider table partitioning. In most situations, no query result is meaningful unless constrained
by time. Consider partitioning at the date/time level if this is your situation.
NULLS
Programmers and Tableau Desktop do not like NULL data. Define each column in your tables
with an explicit “NOT NULL.”, if possible.
Calculations
If complex calculations are needed, in Tableau, consider creating a DBMS VIEW that does the
calculation – the database server is usually more powerful than the desktop!
Summary Tables
Consider the use of pre computer aggregate (summary) tables when large dataset are, typically,
summarized when used. Note – you can use Tableau Desktop to automatically create
Technique
Turn off automatic updates
On the tool bar you will see a button with a Green Arrow on it. When you hover over it, the tool tip will say “Pause Automatic Queries”. With very large databases, I recommend clicking it until you’ve added a few measures and dimensions to your analysis. Then, click on it again and it will “Resume Automatic Queries” but now the selection will be more specific.
If automatic updates are on, feel free to select the skip button to progress the dialog.
Data Sources
When creating data sources, use the Multiple Tables options whenever possible and avoid using Custom SQL. Tableau will be able to optimize its queries when using Multiple Tables. A Custom SQL data source works fantastic when needed, but will use sub queries as follows:
Select sum([Sales]), customer from <insert custom sql here> Group by customer
Order by sum[(Sales)] desc Where [Region] = West
Use as few data sources as needed to achieve your analysis.
Remove any unused data sources.
When adding a table to a data source with joins, select the ‘tables’ option from the data. Tableau will skip several validation steps in this case.
Add a context filter for relevant data
This can be faster than an extract. This is because we still leverage the speed, power and optimization of the database instead of relying on the client machine. Plus, there is no need to re-extract to get current data. The context filter handles that automatically when the workbook is opened. Context filters will work best for you if you are filtering more than 90% of your data as a rule of thumb. Also, Context Filters work best on dimensions that either slowing change or do not change at all.
If you know that you are going to be filtering on a select subset of your data, say a specific time period, state or customer, place that dimension on your filters shelf. Then, click on it again within the filters shelf and select “Add
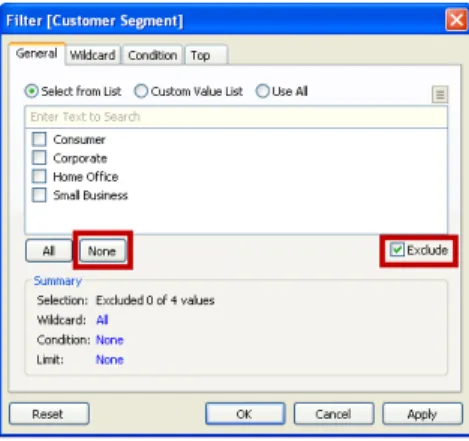
Add a context filter to materialize joins
Materializing means that we calculate all the joins ahead of time so that they don't need to be re-calculated on every query. This one is a bit tricky. Basically we set a context filter that includes all the data. I do this by setting the filter to exclude none of the member of a dimension. Tableau is smart enough to recognize this and do the right thing.
Amazingly, this can give huge performance increases when the data is joined. For example, our Sample - Coffee Chain data source contains two joins. When we apply this blank context filter, Tableau creates a temp table in the database that is denormalized. This means that all the data now sits in a single table instead of in 3 tables. This alone yields up to 10x performance improvement for subsequent queries. I've typically seen 2-5x improvements for production databases.
Note: These types of Context filters are particularly useful when using a 'Custom SQL' connection.
Extracts
Tableau can create extremely fast extracts using its architecture aware extract engine. When creating extracts there are a few techniques that can you can employ to make the most out of them.
Make sure that you hide any unnecessary fields from your data window. Tableau will only extract the fields that are unhidden. By hiding these fields, you will reduce the size of your extract from a columnar perspective.
If your data is at a smaller grain than needed for your analysis or content requires, Tableau can create an extract that is aggregated to the level of detail that is needed. This can be done with a few clicks by going to the Data>Extract data… menu item then selecting the Aggregate data for visible dimensions and pressing the Hide All Unused fields button. Now your data will be as small as it can possibly be while keeping the necessary level of detail.
You can also extract a subset of data – either a filtered subset (say one month of data) or a random sample of data. This will give you the opportunity to create your analytical content and when you are ready to bring the power of Tableau to bear on the complete data set, deselect the Use Extract menu item.
When using Filters
When filtering, try to avoid the “Exclude” option. When the Exclude option is used Tableau must scan all the selected data – there is no opportunity for Tableau to use any INDEX!
When filtering time dimensions, avoid using the “Individual dates and times” filter type. This filter type will explicitly query for each date and time available. If needed, use cascading quick filters for Years, Months and Days to show only the data that you are looking for. Also, the relative date filter is an easy way to show the current week or month of data without having to edit your workbook or republish to Tableau Server.
Content
When authoring content in Tableau Desktop, there are many different ways to achieve the same analysis. Some of the ways perform better than other methods. This section will explore some of the choices that can be made when creating calculations will a focus on the better performing options.
Use Boolean calculations whenever possible
A standard IF THEN statement that returns only two values would look like this:
IF [Date]= TODAY() then “Today” ELSE “Not Today”
END
A faster performing calculation would be:
[Date]=Today()
Then use Aliases to rename the TRUE and FALSE results to “Today” and “Not Today”.
Alternatives to Grouping
Instead of ad hoc grouping, you can use calculated fields to explicitly group members in a dimension.
Case left([Product 3 - Name], 5) When "Xerox" then "Xerox"
When "Avery" then "Avery" When "Canon" then "Canon" When "Eldon" then "Eldon" else [Product 3 - Name] end
A case statement like the one above will run faster than creating a group that would achieve the same grouping. Also, if a new product that matches the above criteria, it will automatically group it.
Use ELSEIF rather than ELSE IF in your logical statements
.
The nested IF computes a second IF statement, rather than being computed as part of the first one.
So this ugly beast:
IF [Region] = "East" and [Customer Segment] = "consumer" then "East-Consumer"
Else IF [Region] = "East" and Customer Segment] <>"consumer" then "East-All Others"
end end
Would run much faster as:
Using Date Functions
Use NOW() only if you need the time stamp level of detail . Use Today() for date level calculations.
Tableau only queries a row of data once in a calculation
Calculations such as the one below seem complete, but contain redundant calculations:
IF [Sales] < 10 Then "Bad"
Elseif [Sales]>= 10 and [Sales] < 30 Then "OK" Elseif [Sales] >= 30 then "Great"
end
Instead take advantage of the logic that has already been performed:
IF [Sales] < 10 Then "Bad"
Elseif [Sales] >= 30 then "Great" else "OK"
end
When using extracts and custom aggregations, divide the calculation into multiple parts. Place the row level calculations on one Calculated field, and the aggregated calculation in a second calculated field. Then extracts can optimize (pre compute) the row level calculations.
Dashboard recommendations
Use Filtering actions instead of Quick Filters. A Quick Filter needs a query in order to populate the list for the filter. Since an action leverages the view itself as the filtering agent, it will save a query from being issued.
When using a filtering action, select the Clearing the selection will: Exclude all values. This checkbox avoids the potentially expensive query of asking for all of the data that the dashboard is able to render.
When publishing dashboards and other content to Tableau Server, avoid creating large quick filters with many members on it in a multiple value list – use a compact list instead.
Also avoid creating large cross-tabs of data. This can easily be avoided by using Tableau’s actions to dynamically filter the data for you.
Miscellaneous recommendations
If you are using a dimension that has a Geographical Role like , consider setting the Geographical Role to None if you are NOT going to render your data in a map. This will save some time looking up the Tableau generated Latitudes and Longitudes.
Remove any unneeded dimensions or measures from your palette. Typically there may be extra items on the Level of Detail shelf.