Development of a Conversion Equation for Active Motor Threshold for the Magstim Bistim Transcranial Magnetic Stimulation Unit
Rebecca Kim
A thesis submitted to the faculty of the University of North Carolina at Chapel Hill in partial fulfillment of the requirements for graduation with honors in the Department of Exercise and Sport
Science.
Chapel Hill 2015
Approved by:
Brian Pietrosimone, Thesis Advisor Troy Blackburn, Reader
Abstract
Rebecca Kim: Development of a Conversion Equation for Active Motor Threshold for the Magstim Bistim Transcranial Magnetic Stimulation Unit
(Under the direction of Brian Pietrosimone)
Purpose. The purpose of this study is to establish whether or not there is a significant difference between the stimulus outputs of the top and bottom units of the Magstim Bistim2. A second objective is to develop a conversion equation for the Active Motor Thresholds (AMTs) collected by the two units.
Methods. Fourteen subjects (
8women ,6men , n=14, age=21.5±1.4years , height=168.5±9.767ce ntimeters , weight=72.5±13.4kilograms¿ were recruited for this study. For each subject, AMT was measured from both Unit 1 and Unit 2 of
the Magstim Bistim2. AMT was measured on the area of the motor cortex that showed the strongest response from the Vastus Medialis Oblique.
Results. A paired samples t-test and a Pearson-product moment analysis showed that there was a significant difference between Units 1 and 2 and that there was a strong, positive correlation between these two variables (t(13)=−6.69, P<0.001; r=0.81, P<0.001¿. Two conversion equations were developed: (1) y=0.65x+8.4, where y=AMT of top unit and x=AMT of bottom unit, and (2) y=1.01x+10.18, where y=AMT of bottom unit and x=AMT of top unit.
Conclusions. Although these equations are fairly reliable for the AMTs gathered in this study, there is concern that the equations are not as accurate for subjects who have higher thresholds.
Statistical analysis supports that Units 1 and 2 of the Magstim are measuring differing AMTs from the same subject, therefore, other studies that are using/have used TMS to measure AMT should take note of which unit was used in testing.
TABLE OF CONTENTS
ABSTRACT... iii
LIST OF TABLES... vi
LIST OF FIGURES... vii
CHAPTER 1: INTRODUCTION... 1
Purpose Statements... 2
Research Hypotheses... 2
Variables... 3
Operational Definitions... 3
Limitations... 3
Assumptions... 3
List of Abbreviations... 4
CHAPTER 2: REVIEW OF LITERATURE... 5
Introduction... 5
Fundamentals of Transcranial Magnetic Stimulation... 5
Active Motor Threshold... 7
CHAPTER 3: EXPERIMENTAL PROCEDURES... 8
Methods and Procedures... 9
Transcranial Magnetic Stimulation... 9
Statistical Analysis... 11
CHAPTER 4: RESULTS... 13
CHAPTER 5: DISCUSSION... 19
Limitations... 21
Conclusion... 21
REFERENCES... 22
LIST OF TABLES
LIST OF FIGURES
Figure 1. Image of components of Magstim Bistim2...7
Figure 2. Image of 1x1 grid on lycra swim cap...11
Figure 3. Actual vs. Predicted AMT for Unit 1...17
Figure 4. Actual vs. Predicted AMT for Unit 2...17
Figure 5. Average AMT collected from Unit 1 and Unit 2...18
Chapter 1:
Introduction
Advances in current medical technology have made measures of corticospinal excitability a reliable marker of the health of an individual's neural pathways. Past investigations have
interpreted decreases in corticospinal excitability as an impeded ability to fully activate a particular muscle1,2. Such information is valuable in comprehending the underlying causes of muscle
dysfunction after injury. While deficits in muscular strength may be due to atrophy and physical damage, much of it can also be attributed to impaired neural pathways1. Corticospinal excitability measures the effect that neural deficits have on muscular structures.
Transcranial Magnetic Stimulation (TMS) uses a rapidly changing magnetic field to cause stimulation of the cerebral cortex4. TMS is frequently used in conjunction with electromyography (EMG) in corticomotor studies that observe the latency of a stimulus that goes from the motor cortex to the muscle. EMG allows for visualization of the Motor Evoked Potential (MEP), the recorded electrical potential caused by electrical or magnetic stimulation of the motor cortex5. Unlike past modes of stimulation, such as electrical stimulation, TMS is non-invasive and delivers little to no pain to subjects. A number of measures can be obtained using this technology, including an individual’s Active Motor Threshold (AMT). AMT is defined as the lowest TMS intensity
necessary to evoke a measurable MEP (peak to peak amplitude >100μV) in the contralateral target muscle in at least 5 out of 10 trials2. AMT measures the excitability of the cortical neurons and
portions of the corticospinal tract innervating a muscle4.
The Magstim Bistim2 is a transcranial magnetic stimulator, and is comprised of a wire coil
have shown that although these units are programmed to deliver the same amount of stimulus, in
actuality they seem to deliver stimuli of different strength. Since corticospinal excitability is
measured using either Unit 1 or Unit 2, incongruent stimulus outputs from the two unit can change
estimations of excitability based on which stimulator was used. This affects both past and future
data collected using the Magstim in UNC's Neuromuscular Research lab, and can potentially affect
other labs that have used the same technology. Therefore, the purpose of this study is to quantify
the difference in AMT output between Unit 1 and Unit 2 of the Magstim Bistim2, and to develop a
regression equation to convert between the AMT of these two units.
Purpose Statements
Aim 1: Determine the difference in the AMT outcome when separately collected with the top TMS unit (Unit 1) compared to the bottom TMS unit (Unit 2), of which collectively make up the Magstim Bistim2.
Aim 2: Determine the association between AMT collected with Unit 1 and Unit 2 by developing a regression equation.
Research Hypotheses
RH1. There will be a significant difference in the stimulus intensity associated with AMT between Unit 1 and Unit 2 of the Magstim Bistim2. This hypothesis is based on observations of a difference in sound emitting from the Magstim when the stimulus is delivered, as well as a tangible decrease in strength of the stimulus.
RH2. There will be a significant amount of variance shared between the stimulus intensity
Variables:
A. Active Motor Threshold - Dependent Variable B. Stimulator Unit - Independent Variable
1. Unit 1 of Magstim Bistim 2. Unit 2 of Magstim Bistim
Operational Definitions
Transcranial Magnetic Stimulation: A constantly fluctuating magnetic field stimulates the motor cortex.
Motor Evoked Potential: The recorded electrical potential caused by electrical or magnetic stimulation of the motor cortex
Maximal Voluntary Isometric Contraction: The maximal torque an individual can produce through isometric contraction.
Active Motor Threshold: the lowest TMS intensity necessary to evoke a measurable MEP (peak to peak amplitude >100 V) in the contralateral target muscle in at least 5 out of 10 trials. μ
Limitations
1. The regression equation is limited to the Magstim Bistim2 System
2. The regression is limited to a double cone coil, other coils may produce different AMTs in subjects
Assumptions
1. All measures are reliable and valid 2. AMT represents corticomotor excitability
List of Abbreviations
TMS- Transcranial Magnetic Stimulation AMT- Active Motor Threshold
MEP- Motor Evoked Potential EMG- Electromyography
Chapter 2:
Review of Literature
Introduction
Transcranial Magnetic Stimulation (TMS) has become an effective tool for measuring the responsiveness of corticomotor pathways7,9. Its uses range from Multiple Sclerosis diagnostics to Parkinson's rehabilitation, and researchers are continually exploring how TMS can be applied in various health settings4. Since measures of AMT have been used in several previous as well as current studies that focus on neuromuscular control following musculoskeletal injury2,10, it is important to ensure that each unit of the Magstim Bistim2 provides the intended stimulus intensity. It is hypothesized that the two units of the Magstim Bistim2 measure different AMTs in the same subject, even in congruent TMS output settings. This difference is suspected because of a decrease in sound and physical strength of stimulus when changing from the top to the bottom unit of the Magstim. The purpose of this study is to determine whether there is a significant difference in the stimulus associated with AMT between Unit 1 and Unit 2 of the Magstim Bistim, and also to develop
a regression equation to convert between the two units.
Fundamentals of Transcranial Magnetic Stimulation
Before reviewing publications about TMS, it is important to understand the basic terminology and mechanics behind this technology. In Transcranial Magnetic Stimulation (TMS) Device and Foundational Techniques, TMS is explained through Faraday’s principle of
electromagnetic induction4; this is the idea that a magnetic field can be produced when an electric current is sent through a wire coil4. The rapidly changing field allows an induced electrical current
to run through the neural tissue6. Much of the research being conducted today is focused on stimulation of the motor cortex, which can activate corticomotor pathways and result in a muscle twitch called a motor-evoked potential (MEP)4,7. The signal sent through TMS travels along the corticospinal tract and peripheral motor nerve and can be graphically recorded. The amplitude of a MEP reflects the excitability of the motor cortex and of the corticospinal tract7. An abnormal MEP may appear dispersed, small, or even absent and could be suggestive of conditions such as MS, ALS, stroke, brain injury, etc.7.
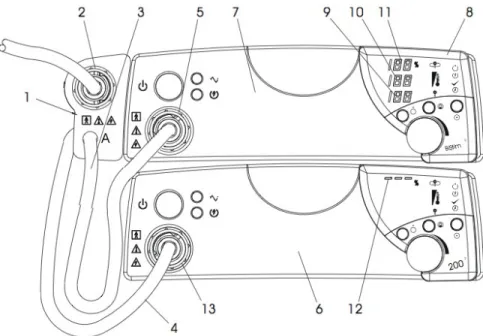
The Magstim Bistim itself is made of a charging system, energy storage capacitors, energy recovery circuitry, a thyristor, and pulse-shaped circuitry4 (Figure 1). The shape of the wire coil itself is important in determining the overall functionality of the electric field produced. The University of North Carolina's Neuromuscular Research lab contains a double cone coil (Magstim Company, Wales, UK), which produces a more focal current in comparison to the round coil or the H-coil. The specific TMS device to be studied is the Magstim Bistim2 & Upgrade, a combination of two single pulse stimulators. The connection between the two stimulators allows for paired pulses to be delivered through one coil3. Paired pulse is used to study inhibitory and facilitatory
Figure 1. Image of components of Magstim Bistim2
Active Motor Threshold
Active Motor Threshold (AMT) is typically defined as the minimum output of the stimulator that induces a reliable MEP (100 uV in amplitude during weak voluntary contraction) in at least 5 of 10 consecutive trials12. Measurement of AMT requires that subjects contract the limb of interest to a small percentage of their maximal voluntary isometric contraction (MVIC) before the magnetic stimulus is applied; this stimulus is concentrated over the motor cortex. Once AMT has been determined, the threshold can be used to quantify or assess changes in corticospinal excitability. AMT and corticomotor excitability have an indirect relationship, meaning that a higher AMT reflects lesser excitability2.
Chapter 3:
Experimental Procedures Subjects
Fourteen healthy, physically active subjects (
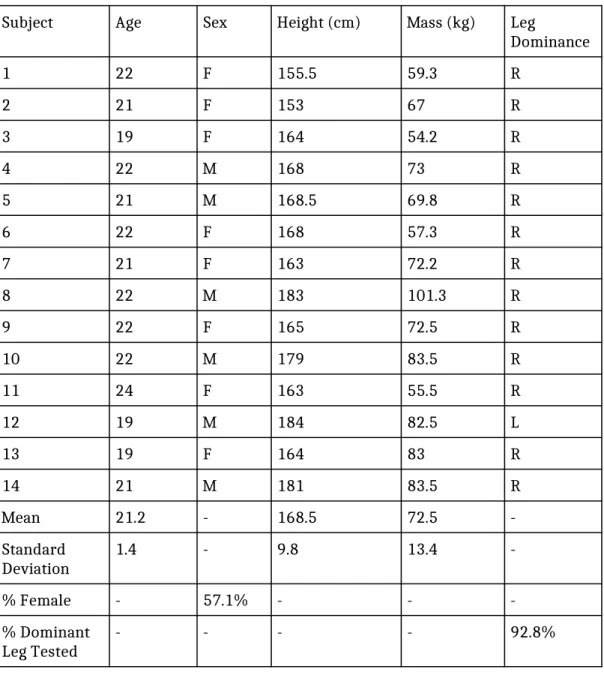
n=14, age=21.5±1.4 years, height=168.5±9.767centimeters , weight=72.5±13.4kilograms¿ were recruited for this study. Eight out of fourteen subjects were female and thirteen out of fourteen subjects were right leg dominant. Physically active was defined as participating in moderate activity for 20 minutes, 3 times a week. Subjects were excluded if they had conditions such as epilepsy, concussion or head injury in the past 6 months, stroke, migraine headaches, or cancer in the brain or thigh region. Although TMS is safe and there is little to no risk in
participating, individuals with these conditions are more susceptible to negative side effects such as headache, nausea, and seizure. Additionally, there was also concern that individuals with certain medical conditions would provide an inaccurate representation of a healthy population, therefore adding unnecessary outside variables to our experiment. Consequently, subjects who are pregnant, have Parkinson's disease, balance disorders, Multiple Sclerosis, stroke, a cardiac condition,
leg into a dynamometer. Because of their increased potential for further injury, they were not allowed to participate in the study.
Instrumentation
Measures of corticomotor excitability were obtained using the Magstim Bistim (Magstim Company, Wales, UK) and a double cone coil. A Humac dynamometer (Computer Sports Medicine Inc., Stoughton, MA) was used to measure torque and standardize patient positioning during MVIC and corticomotor excitability measures. Electromyographic signals from motor evoked potentials were converted with a 16-bit analog to digital convertor (MP150, BIOPAC Systems Inc., Goleta CA, USA). Acqknowledge BIOPAC Software (V 4.2.0-150, BIOPAC Systems Inc., Goleta CA, USA) was used to visualize and analyze MEP collected with electromyography and raw torque signal output
directly from the dynamometer.
Methods and procedures:
This study employed a descriptive laboratory research design. Fourteen healthy
participants were recruited from the University area and report to the Neuromuscular Research
Laboratory for testing. Prior to participation, each participant read and signed an informed consent
form. If the participant had any questions about the procedures or the study in general, he/she had
the option to ask the researcher. After consent was obtained, the investigator screened the
participants using various self-reported questionnaires to ensure that they met inclusion/exclusion
criteria. Participants who do not meet inclusion/exclusion criteria were excluded from the study. If
the participant met all criteria, the investigator obtained the participant’s demographics.
Transcranial Magnetic Stimulation
TMS was used to quantify corticospinal excitability by assessing active motor threshold
(AMT) and amplitudes of motor evoked potentials (MEPs). MEPs were elicited using the Magstim
Bistim (Magstim Company, Wales, UK) via a double cone coil (Magstim Company, Wales, UK). The
magnetic stimulation did not exceed 2 Tesla. All MEPs were measured in the vastus medialis
oblique using disposable, disk-shaped 10 mm pre-gelled Ag/AgCl electromyographic electrodes
(BIOPAC Systems, Inc). Acqknowledge BIOPAC Software (BIOPAC Version 4.3, BIOPAC Systems,
Inc.) was used to visualize the signals. The area of the skin over the collection site was shaved,
debrided, and cleaned with alcohol.
Participants sat in the dynamometer and were positioned in 85º of hip flexion and 90º of
knee flexion. Restrictive straps were secured at the lap and over the shoulder of each participant to
control accessory movement during the knee extension task. The tibia, just proximal to the ankle
joint, was secured to a pad on the arm of the dynamometer with a Velcro strap. Participants were
instructed to cross the arms over their chest during all contractions to avoid unwanted upper
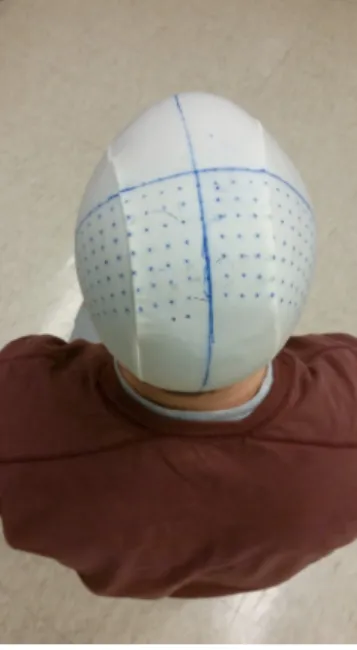
extremity involvement in the task. Participants wore a lycra swim cap which aided the investigator
in finding the optimally stimulating position of the magnetic coil over the motor cortex. By
measuring the length and width of each subject's head, the researcher was able to center the 1x1
cm grid that was pre-drawn on the swim cap (Figure 2). Additionally, formable disposable earplugs
were given to protect the participant’s ears, as an audible noise was produced during magnetic
stimulation.
Maximal voluntary isometric contraction was determined by instructing the participant to
extend his/her knee with as much force as possible into the dynamometer. Right leg was tested
regardless of subject's dominant limb. Five percent of the maximal voluntary isometric contraction
(MVIC) at 90° of knee flexion was used as a standardized volitional muscle contraction during TMS
contralateral limb, the double cone coil was positioned over the vertex of the cranium. The coil was
moved systematically in approximately 1cm increments in an anterior/posterior and medial/lateral
direction over the vertex until the largest MEP response was found and marked on the swim cap by
the investigator. AMT refers to the lowest TMS intensity necessary to evoke a measurable MEP
(peak to peak amplitude >100 V) in the contralateral target muscle in at least 5 out of 10 trials. μ
Both the top and bottom units of the Magstim Bistim2 were used to measure AMT in each
participant. To negate the effects of order, subjects were counterbalanced by alternating which unit
was first used to measure AMT. All odd numbered subjects were measured with Unit 1, followed by
Unit 2 and all even numbered subjects were measured with Unit 2, followed by Unit 1. The same
coil was used for both trials.
Figure 2. Image of 1x1 grid on a lycra swim cap
Statistical Analysis
First, we performed a Shapiro-Wilk test to check the normality of the AMT outcome measures. This was necessary to determine whether or not the data was eligible for analysis via t-test, which requires the data to be normally distributed. We conducted a paired samples t-test to
determine whether or not Unit 1 and Unit 2 were different from each other. A paired samples t-test was used because there are two measures (AMT from Unit 1, AMT from Unit 2) taken from a single subject. The null hypothesis (H0) was that there would be no difference between the AMT collected from the top and bottom units. If the null hypothesis were rejected, measures to further examine the relationship between the two conditions would have been taken. A two-tailed Pearson product-moment test determined the linear dependence of our two variables, AMT taken from the top unit and AMT taken from the bottom unit. A bivariate correlation was used to test the linearity of our data, where a more linear plot suggests a stronger association between the top and bottom units of the Magstim Bistim2. To further analyze the strength of the association between the AMT from both units, two measures of Intraclass Correlation (ICC) were conducted: absolute agreement and internal consistency. The test for absolute agreement served to determine how similar the AMT is between boxes, while the internal consistency determined if the difference between the two units had a constant slope between people. For absolute agreement and consistency measures, we set Unit 2 as the dependent variable and Unit 1 being the independent variable. This was done arbitrarily as it should not have affected our results whether one or the other was used as the dependent/independent variable.
The second objective of this study was to calculate a conversion equation that is able to translate between the top and bottom units of the Magstim. If the scatter plot appears consistently linear, a linear regression model would be the best fit for our data. A regression equation was calculated to convert AMT from Unit 1 to Unit 2 and also from Unit 2 to Unit 1.
Chapter 4:
Results
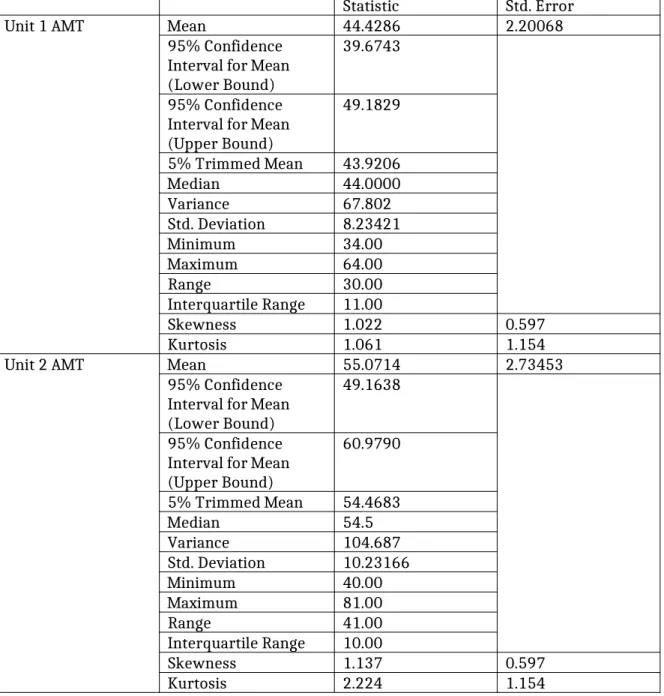
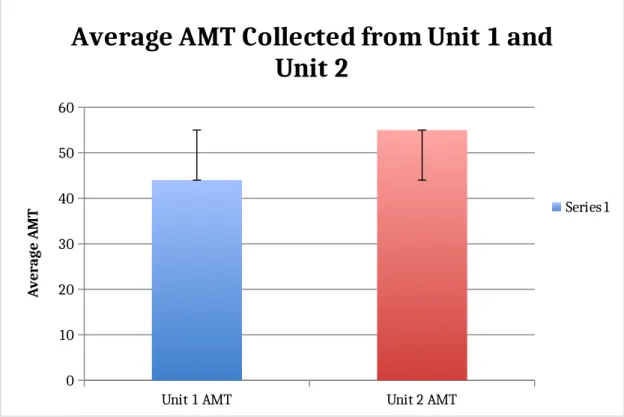
Means and standard deviations are presented in Table 1. The Shapiro-wilk test confirmed normality in the collected data (sig. of Unit 1=0.290, sig. of Unit 2=0.283). AMTs were significantly higher when collected with Unit 1 compared to the AMTs collected with Unit 2 (t(13)=-6.69, P<0.001). The two-tailed Pearson product moment test indicated a strong, positive correlation between the two variables, meaning that a higher AMT collected from the top unit associated with a higher AMT collected from the bottom unit (r=0.81, P<0.001). The linear fit line for the association was y=0.8x-2; r2=0.661. When analyzed with a quadratic fit, the Pearson correlation value was r2=0.703. A quadratic fit was chosen based on the pattern of the data. Our ICC value for absolute agreement was 0.48 and ICC for consistency was 0.79. Average AMT for Unit 1 was 44.4±2.2 and average AMT for Unit 2 was 49.2±2.7(Figure5).
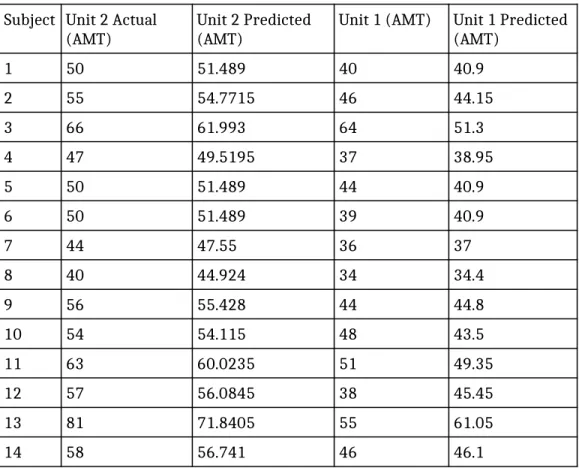
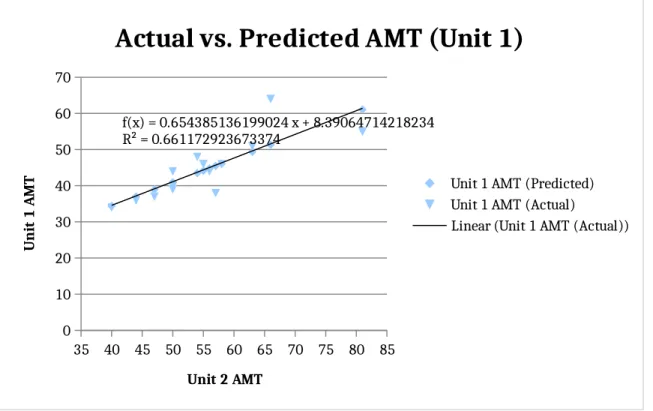
When the AMT collected from Unit 2 was set as the dependent variable and the AMT collected from Unit 1 was set as the independent variable, we found the linear regression equation to be y=0.65x+8.4 (Figure 3). When the axes were switched, the linear regression model was y=1.01x+10.18 (Figure 4). Figures 3 and 4 also show a comparison of the predicted AMTs calculated from the respective conversion equations. Additionally, Table 2 shows the exact numerical value of the predicted vs. actual AMTs collected in our experiment. Table 3 displays the demographics of the participants involved in this experiment.
Table 1. Descriptive Statistics for Unit 1 and Unit 2 Active Motor Thresholds
Statistic Std. Error
Unit 1 AMT Mean 44.4286 2.20068
95% Confidence Interval for Mean (Lower Bound)
39.6743
95% Confidence Interval for Mean (Upper Bound)
49.1829
5% Trimmed Mean 43.9206
Median 44.0000
Variance 67.802
Std. Deviation 8.23421
Minimum 34.00
Maximum 64.00
Range 30.00
Interquartile Range 11.00
Skewness 1.022 0.597
Kurtosis 1.061 1.154
Unit 2 AMT Mean 55.0714 2.73453
95% Confidence Interval for Mean (Lower Bound)
49.1638
95% Confidence Interval for Mean (Upper Bound)
60.9790
5% Trimmed Mean 54.4683
Median 54.5
Variance 104.687
Std. Deviation 10.23166
Minimum 40.00
Maximum 81.00
Range 41.00
Interquartile Range 10.00
Skewness 1.137 0.597
Table 2. Comparison of actual data collected vs. predicted AMT values. Subject Unit 2 Actual
(AMT) Unit 2 Predicted (AMT) Unit 1 (AMT) Unit 1 Predicted (AMT)
1 50 51.489 40 40.9
2 55 54.7715 46 44.15
3 66 61.993 64 51.3
4 47 49.5195 37 38.95
5 50 51.489 44 40.9
6 50 51.489 39 40.9
7 44 47.55 36 37
8 40 44.924 34 34.4
9 56 55.428 44 44.8
10 54 54.115 48 43.5
11 63 60.0235 51 49.35
12 57 56.0845 38 45.45
13 81 71.8405 55 61.05
14 58 56.741 46 46.1
Table 3. Demographics of participants
Subject Age Sex Height (cm) Mass (kg) Leg
Dominance
1 22 F 155.5 59.3 R
2 21 F 153 67 R
3 19 F 164 54.2 R
4 22 M 168 73 R
5 21 M 168.5 69.8 R
6 22 F 168 57.3 R
7 21 F 163 72.2 R
8 22 M 183 101.3 R
9 22 F 165 72.5 R
10 22 M 179 83.5 R
11 24 F 163 55.5 R
12 19 M 184 82.5 L
13 19 F 164 83 R
14 21 M 181 83.5 R
Mean 21.2 - 168.5 72.5
-Standard
Deviation 1.4 - 9.8 13.4
-% Female - 57.1% - -
-% Dominant
35 40 45 50 55 60 65 70 75 80 85 0 10 20 30 40 50 60 70
f(x) = 0.654385136199024 x + 8.39064714218234 R² = 0.661172923673374
Actual vs. Predicted AMT (Unit 1)
Unit 1 AMT (Predicted) Unit 1 AMT (Actual)
Linear (Unit 1 AMT (Actual))
Unit 2 AMT
U n it 1 A M T
Figure 3. Graph of actual data collected vs. predicted Unit 1 AMT values
30 35 40 45 50 55 60 65 70 0 10 20 30 40 50 60 70 80 90
f(x) = 1.01037277147488 x + 10.1820097244733 R² = 0.661172923673373
Actual vs. Predicted AMT (Unit 2)
Unit 2 AMT (Predicted) Unit 2 AMT (Actual)
Linear (Unit 2 AMT (Actual))
Unit 1 AMT
U n it 2 A M T
Figure 4. Graph of actual data collected vs. predicted Unit 2 AMT values
Unit 1 AMT Unit 2 AMT 0
10 20 30 40 50 60
Average AMT Collected from Unit 1 and
Unit 2
Series1
A
ve
ra
ge
A
M
T
Chapter 5:
Discussion
The two main objectives for this study were to (1) determine that there is a significant difference between the AMT measurements of the top and bottom units of the Magstim Bistim2, and (2) develop a conversion equation to translate between the two units.
A high t-value and a low p-value reflects that there was a statistically significant difference between the AMT in the top unit and bottom unit [t(13)=-6.69, P<0.001]. There was a strong, positive correlation between the two variables, with the bivariate correlation being r=0.81, p<0.001, meaning that an individual with a high AMT in Unit 2 is likely to also have a high AMT measured with Unit 1. The r2 value of 0.661 was calculated based on a linear fit; however, when a quadratic fit is applied, the r2 value increases to 0.703. This suggests that a quadratic fit may be more representative of the true pattern of the data, but greater diversity in participants is necessary before determining whether or not this increase was significant. The ICC for absolute agreement of 0.48 reflects that the measures from the top and bottom units do not agree with one another. The ICC value for consistency was 0.79, meaning that if an individual were to have a larger measured AMT than another individual in the first test, it is likely to also be larger in the second measurement of AMT.These data suggest that while the AMT gained from each unit are not similar (absolute agreement), the ability to predict what will be collected from Unit 1 may be possible knowing the AMT from Unit 2.
The equations developed to predict the AMTs from the top unit and bottom unit are fairly accurate in their estimates. Figures 3 and 4 show relative consistency in the comparisons between the predicted vs. the actual, as does Table 1. It appears that it is more likely that there is a
significant difference between predicted and actual AMT in individuals who have a higher threshold. A significant difference was considered as anything greater than a difference of 3 between the predicted and actual. Although this was not always the case, individuals with high thresholds seem to be more likely to have a smaller difference between the AMTs collected from the top and bottom units. Further testing needs to be conducted with individuals who have high
thresholds in order to understand the curve of the data. Our prediction is that the graph follows more of a quadratic pattern rather than a linear, which could account for the inaccuracies as the AMTs increase.
All of the individuals tested in this experiment had higher measured AMTs using the bottom unit in comparison to the top unit of the Magstim Bistim2. The differences in AMT suggests that the Magstim Bistim2 outputs different stimuli between the top and bottom units, even when set at the same stimulus percentages. This is a concern for any study that uses or has used TMS in the past as it implies that Unit 2 has not been delivering the programmed stimulus. Not only does this cause problems of measurement reliability, it also brings about issues with translation between studies. A Magstim set at 50% of 2 Tesla in laboratory A could be different from a Magstim set at 50% of 2 Tesla in laboratory B if lab A used the top unit and lab B used the bottom unit. Therefore future research should specify which unit was used and consistently use the same unit in all testing.
The study, Contributions of neural excitability and voluntary activation to quadriceps muscle strength following anterior cruciate ligament reconstruction, reported an average AMT of 43.9±16.3 in their healthy population2. This is significantly closer to the AMTs collected with Unit 1 (
average AMT=44.4±2.2¿ in comparison to those collected with Unit 2 (
average AMT=49.2±2.7¿. A second study titled Quadriceps Strength and Corticospinal Excitability as Predictors of Disability After Anterior Cruciate Ligament Reconstruction found their average AMT
likely outputs a lower stimulus than the other units. Both these studies measured from the quadriceps and used a double cone coil.
Limitations
This study’s main limitation was the range of participants. Ideally, there would have been a strong representation of individuals with high and low thresholds. In future studies, it would be helpful to recruit a greater number of participants in order to ensure greater diversity. Additionally, it should be noted that novice researchers conducted the majority of TMS delivery and analysis. Investigator error is also something to be considered, as our research team was small and there were limited expertise in collecting AMT. Lastly, the conversion equation may vary for different coils and different Magstim Units as those scenarios have not yet been explored.
Conclusion
Research has found that there was a significant difference in the AMT measurements of the top and bottom units of the Magstim Bistim2. These discrepancies are suggestive of a difference in stimulus output from the Magstim itself. Two conversion equations were made: (1) y=0.65x+8.4, where y=AMT of top unit and x=AMT of bottom unit, and (2) y=1.01x+10.18, where y=AMT of bottom unit and x=AMT of top unit. Though these equations worked consistently in individuals with lower AMTs, individuals with high AMTs were more likely to have inexact predictions. This may be indicative of a quadratic fit rather than a linear fit, however, further testing is needed to account for a more diverse range of thresholds.
References
1. Harkey, M., Gribble, P., & Pietrosimone, B. (2014). Disinhibitory Interventions and Voluntary Quadriceps Activation: A Systematic Review. Journal of Athletic Training, 49(1).
2. Lepley, A., Ericksen, H., Sohn, D., & Pietrosimone, B. (2014). Contributions of neural excitability and voluntary activation to quadriceps muscle strength following anterior cruciate ligament reconstruction. The Knee,21, 736-742.
3. Magstim Bistim System. (2004). In Magstim® Bistim System P/N 3234-23-01 Operating Manual (pp. 1-28). Carmarthenshire SA34 0HR, UK: The Magstim Company Limited.
4. Rotenberg, A., Horvath, J., & Pascual-Leone, A. (2014). Transcranial Magnetic Stimulation (TMS) Device and Foundational Techniques.Neuromethods, 89, 3-13.
5. Binder, M. (2009). Encyclopedia of neuroscience. Berlin: Springer.
6. Groppa, S., Oliviero, A., Eisen, A., Quartarone, A., Cohen, L., Mall, V., ... Siebner, H. (2012). A practical guide to diagnostic transcranial magnetic stimulation: Report of an IFCN
committee. Clinical Neurophysiology,858-882.
7. Kobayashi, M., & Pascual-Leone, A. (2003). Transcranial magnetic stimulation in neurology. The Lancet Neurology, 2, 145-156.
8. Khedr, E., Etraby, A., Hemeda, M., Nasef, A., & Razek, A. (2010). Long-term effect of repetitive transcranial magnetic stimulation on motor function recovery after acute ischemic
stroke. Acta Neurologica Scandinavica,121(1), 30-37.
9. Rittig Rasmussen, B., Kasch, H., Fuglsang Frederiksen, A., Svensson, P., & Jensen, T. S. ‐ ‐ (2014). Effect of training on corticomotor excitability in clinical neck pain. European Journal of Pain, 18(8), 1207-1216. doi:10.1002/j.1532-2149.2014.487.
10.Lepley, A. S., Bahhur, N. O., Murray, A. M., & Pietrosimone, B. G. (2015; 2013). Quadriceps corticomotor excitability following an experimental knee joint effusion. Knee Surgery, Sports Traumatology, Arthroscopy : Official Journal of the ESSKA, 23(4), 1010-8. doi:10.1007/s00167-013-2816-1
11.Osei-Lah, A., Turner, M., & Mills, K. (2007). Cortico-cortical inhibition and facilitation are altered in ALS: Evidence from paired pulse TMS. Clinical Neurophysiology, 118(5), E146-E146.
12.Pietrosimone, B. (2013). Quadriceps Strength and Corticospinal Excitability as Predictors of Disability After Anterior Cruciate Ligament Reconstruction. Journal of Sport