! !
!"#$%&'#()*+,*-+&(.*/0&+1#"0*0(*/.02%1*3#11* 4%20&(5%"(*+,*/#()*0"6*7%8#+"01*910""#"8!
:+$#"8*;%)+"6*
:0#"*<(&%%(*
*=.%*>520?(*+,*3#'(+&#?*9&%'%&$0(#+"*=0@*/&%6#('*+"*>""%&A7#"8*7%'#6%"(#01*<BCB&C'*
L!
1. Executive Summary ………...……… 5
2. Literature Review ………...… 7
2.1. The Basics
2.1.1. Historic Districts & Designation 2.1.2. Federal & State Tax Credits
2.2. Economic Impact of Historic Preservation 2.2.1. Comprehensive Benefits
2.2.2. Focus on Downtown 2.2.3. Tools for Neighborhoods
2.3. Historic Preservation and Residential Property Values 2.3.1. Quantifying the Impact
2.3.2. Limitations of Existing Studies 2.4. Further Considerations
3. Methodology ………...…. 14
3.1. Choosing & Defining Trinity Park
3.2. Gauging Neighborhood Change & Tax Credit Usage 3.2.1. Creating the Neighborhood Change Database
3.2.2. Assumptions & Limitations of the Neighborhood Change Database 3.2.3. Creating Geographic Information Systems Maps
3.3. Determining the Impact to the City of Durham 3.3.1.Data Acquisition & Manipulation
3.3.2.Assumption & Limitations of the Estimated Fair Market Value & Taxation 3.4. Evaluate the effectiveness of that tool to revitalize inner-ring city suburbs
4. Results ……….…… 19
4.1. Assessing Change in Trinity Park
4.1.1. Assessing the Use of Non-Incoming Producing Tax Credits in Trinity Park 4.1.2. Comparing Rehabilitations & Tax Credits
4.1.3. Interim Results: Neighborhood Change & Tax Credit Use 4.2. Changes in Estimated Fair Market Value & Tax Revenue
4.2.1. Comparing Estimated Fair Market Value, 2002 and 2010 4.2.2. Changes in Tax Revenue
4.2.3. Interim Results: Neighborhood & City Impact
5. Bibliography ………... 32
6. Appendices ……….. 35
A: Database of Alterations & Characteristics of Trinity Park Structures, 1987 - 2008 B: Estimated Fair Market Value Summary Statistics by Type and Year, 2001 - 2010 C: Approximate City Tax Revenue Summary Statistics, 2001 - 2010
M!
Figure 1. National & Local Historic Districts and their Relative Powers ……….…. 7
Figure 2. Federal & State Historic Tax Credits ……… 8
Figure 3. Housing Stock by Year Built1 ………...…… 15
Figure 4. Summary Table of Alterations to Trinity Park Structures by Type & Decade … 20 Figure 5. Alterations to Trinity Park Structures by Type and Year ………... 21
Figure 6. Non-Income Producing Properties using Tax Credits since 1998 …….……… 22
Figure 7. Rehabilitations and Tax Credits by Year ……….……….. 24
Figure 8. Estimated Fair Market Value Summary Statistics 2002 ……….………… 26
Figure 9. Estimated Fair Market Value Summary Statistics 2010 ……….……… 27
Figure 10. Mean Estimated Fair Market Values2 ……….……… 28
Figure 11. Percent Increase in Estimate Fair Market Values, 2007 – 2008 ……….…….. 28
Figure 12. Estimated Tax Revenue by Year ……… 29
Figure 13. Percent Change in Tax Revenue, 2007 – 2008 ……… 30
Figure 14. Comparison of Relative Contribution to Tax Revenue, 2002 and 2010 ……. 30
Map 1. Summary of States with Tax Incentives for Historic Properties …….…………. 11
Map 2. Relative Location of Trinity Park ……… 14
Map 3. Durham Historic Resources ………..………. 16
Map 4. Significant Alerations to the Trinity Park Neighborhood, 1987 – 2008 …..……. 19
Map 5. Trinity Park Homes Using Tax Credits, 1998 – 2008 ………....……….. 22
Map 6. Renovations & Tax Credits in Trinity Park Neighborhood, 1987 – 2008 …....… 23
Map 7. Estimated Fair Market Values, City of Durham 2002 ……….……….…… 26
Map 8. Estimated Fair Market Values, City of Durham 2010 ………. 27
!!!!!!!!!!!!!!!!!!!!!!!!!!!!!!!!!!!!!!!!!!!!!!!!!!!!!!!!
1 Data was obtained from Block Groups 1, 2, and 3 from Census Tract 3.02 in Durham County, North Carolina. Trinity Park does not
accurately overlaying census block group data, and these block groups include some area outside of the district. Every effort was made to assure the most accurate representation possible.
G! As a tangible link to the past, historic buildings represent the connectivity between then and now. Their continued service as residences, institutions, and businesses, often remade many times over, demonstrate the capacity for and celebration of architectural and functional evolution. Cobbled together into neighborhoods, these structures gain a contextual framework in which to fit and become a part of shared history. Alterations of these homes, specifically rehabilitation3, represent investment by individual homeowners to create a more livable space; taken together, they signify neighborhood vibrancy and the continued assurance their story will be told.
However, historic preservation has been long viewed as a cultural endeavor undertaken as a greater public good to preserve and display the heritage of a place. More recently, preservationists have advocated for a more progressive view; namely, that renovation and rehabilitation have significant economic impacts on historic areas. State and local initiatives followed with their focus directed squarely, and logically, on downtowns. However, historic structures are not limited to commercial storefronts along “Main Street,” and inner-ring residential suburbs often contain properties valuable to a city for a multitude of reasons beyond heritage conservation and tourism. Rehabilitating old homes provides economic, cultural, and social benefits that can significantly and positively benefit a city.
Therefore, this paper will examine the impact of one of the main tools available to residents of historic neighborhoods, state historic preservation tax credits for non-incoming producing properties offered by the state of North Carolina, analyze their effectiveness to induce neighborhood invigorating reinvestment in National Register historic districts, and determine the impact to the neighborhood and city through a case study of Trinity Park in Durham, North Carolina. First, the evolution of the neighborhood’s historic structures over the past twenty-two years, including additions, renovations, demolitions, damage from natural hazards, and new construction, was compiled into a database and analyzed to determine if state tax credits, offered only in that past ten years, could be attributed to increased renovations. Further, this paper will also determine the impact of this reinvestment to the immediate and larger community to evaluate the utility of state historic tax credits to encourage transformative change. Using estimated fair market values provided by the City of Durham over the nine-year span from 2001 to 2010, including one revaluation in 2008, basic summary statistics were calculated and examined to assess and compare change over time in Trinity Park and in the City of Durham as a whole. In addition, approximated city tax revenues were computed using the marginal tax rate in order to illustrate one possible impact that state tax credits have on the city as a whole. Taken together, a picture of overall effectiveness began to emerge.
Overall, two hundred and ten separate significant alterations to historic structures were observed since 1987, of which one hundred thirty two were substantial renovations. Representing approximately half of the housing stock, reinvestment in Trinity Park is clear. In addition, comparisons of the decades from 1987 to 1997 and 1998 to 2008 show an increase in each type of alteration; most significantly, state tax credits were taken for fifty of the eighty six renovations over the past ten years. This translates to a full sixty percent of
!!!!!!!!!!!!!!!!!!!!!!!!!!!!!!!!!!!!!!!!!!!!!!!!!!!!!!!!
3 For the purposes of this paper, “rehabilitate” and “renovate” will be used interchangeably to indicate substantial reinvestment in a
property that maintains its historic character (from http://www.nps.gov/history/ hps/tps/standards_guidelines.htm).
N! rehabilitations for tax credits in a district lacking local guidelines; however, the presence of an active and informed neighborhood association may act as a mitigating factor.
O! 2.1 The Basics
A variety of types of historic designation exist, and each carries a unique, but often interrelated, set of guidelines and rules. The federalist nature of both historic districts and tax credits coupled with restrictions dependent on type can lead to considerable confusion. Therefore, the following discussion will serve as a basic primer to national, state, and local designation as well as national and state tax credits.
2.1.1 Historic Districts & Designation
The National Historic Preservation Act of 1966 initiated the research, documentation, and listing of historic buildings and districts with national, state, or local significance to the National Register (National Register, n.d.). Administered by the Department of the Interior via a contract with the state’s Historic Preservation Office, North Carolina contributes more than 2,600 entries to the 1.4 million resources nationally (North Carolina Listings, n.d.; National Register Research, n.d.). Without local police power to enforce design guidelines or stay demolition, income producing buildings within a National Register Historic District are incentivized to ensure historic integrity through federal tax credits that ameliorate a percentage of the cost of rehabilitation. There is no such federal provision for non-incoming producing properties.
In North Carolina, state legislation (General Statutes 160A-400.1-400.14) allows for the establishment of local historic preservation commissions whose duties include the identification, documentation, and designation of local landmarks and districts (Local Historic Property Designation, n.d.). Completely separate from the National Register of Historic Places, local historic landmarks and districts are subject to a locally mandated set of guildelines and regulations governing exterior modifications, similar to zoning, which vary by municipality and sometimes by district. Buildings located within a local historic district are also subject to a 365-day demolition delay which is not available to properties within National Register districts. Further, while a particular property may be in both a national and local districts, these districts need not overlap or even occur together. Please see the figure below for further clarification.
Figure 1. National & Local Historic Districts and their Relative Powers
!
National Register Historic District
Local Register Historic District
Administered by State Historic Preservation Office Local commission created via State enabling legislation
Power Tax Credits & other Federal Legislation Zoning (police power)
Main Benefits Tax Credits Design review, Demolition Delay
From:: Federal and State Historic Preservation Tax Credits. (n.d.). Retrieved February 18, 2009, from North Carolina State Historic Preservation Office: http://www.hpo.ncdcr.gov/tchome.htm
2.1.2 Federal & State Tax Credits
1976 marks the inaugural year of fiscal feasibility to rehabilitate an old building instead of razing it (Federal and State, n.d.). Since 1986, income producing historic structures have been eligible for a twenty percent federal tax credit, in that one fifth of the cost of the
P! rehabilitation (qualified rehabilitation expenses) is simply deducted from tax liability (Federal and State, n.d.). Several standards qualify the aformentioned statement: a historic structure is defined as one listed on the National Register of Historic Places by the time all work is complete, the renovation costs must exceed either five thousand dollars or the basis, and all improvements must adhere to the Secretary of the Interior’s Standards for Rehabilitation. Additionally, any cost incurred not directly related to the historic structure, including additions and landscaping, is not entitled to be applied towards the tax credit. Finally, the tax credit cannot be claimed until substantial work has been completed, indicating that the building is fit for occupancy (Historic Preservation Tax Incentives, n.d.).
However, redevelopers of income-producing properties usually do not take this credit themselves and instead sell it via a third party, called a syndicator, to an entity with an even larger tax liability. The credits are not exchanged dollar for dollar, but are instead priced in the market anywhere from forty to ninety five cents on the dollar4. In return for the credit, the redeveloper receives much-needed equity in their rehabilitation project; however, because there is a gap between when equity is needed and when credit is available, the syndicator may also serve to bridge the funding.
Federal statute does not provide for non-income producing structures (i.e. owner-occupied homes); however, North Carolina enacted a thirty percent tax credit for these properties as well as compounding the twenty percent federal tax credit for income producing properties with an additional twenty percent in 1998 (Federal and State, n.d.). North Carolina’s regulations governing historic status, standards for rehabilitation, qualifying expenses, and claiming the tax credit align with the federal government for both types of properties. The major difference lies in the minimum cost of the rehabilitation; whereas income producing properties follow federal guidelines, non-income producing properties must accrue twenty five thousand dollars in rehabilitation expenses (Federal and State, n.d.). Please see the figure below for a summary of federal and state tax credits.
Figure 2. Federal & State Historic Tax Credits
Federal Tax Credit State Tax Credit
Income Producing: 20% Incoming Producing: 20% Amount
Non-Income Producing: 0% Non-Income Producing: 30%
Income Producing: same as federal Rehabilitation
Expenses Income Producing: the eligible basis of the building Either $5,000 or Non-income Producing: must exceed $25,000 over 24 months
Listing National Register National Register
Certification Secretary of Interior’s Standards for Rehabilitation Secretary of the Interior’s Standards for Rehabilitation Claiming
Credit Upon project completion Upon project completion
From:: Federal and State Historic Preservation Tax Credits. (n.d.). Retrieved February 18, 2009, from North Carolina State Historic Preservation Office: http://www.hpo.ncdcr.gov/tchome.htm
!!!!!!!!!!!!!!!!!!!!!!!!!!!!!!!!!!!!!!!!!!!!!!!!!!!!!!!!
"!These numbers are purely fictional and are meant to represent the wide variety of actual prices for which tax
Q! 2.2 The Economic Impact of Historic Preservation
For over thirty years, proponents have cited positive economic impacts of historic preservation as they continue to portray the renovation and maintenance of historic structures as economically desirable for the continued prosperity of cities. Traditionally, preservation and maintenance of historic structures was seen as a cultural endeavor; as such, the North Carolina State Historic Preservation Office is housed within the Department of Cultural Resources (Main Navigation Page, 2009). However, preservation as economic development have been steadily gaining popular acceptance.
2.2.1 Comprehensive Benefits
Rypkema, in The Economics of Historic Preservation (1994), describes this benefit as “one of the highest job-generating economic development options available” (pg. 11). To support this claim, Rypkema gives the example that almost three quarters of the cost of rehabilitation is labor expenses, and that in the vast majority of cases, that labor is hired locally (Rypkema, 1994, pg. 12). The First Annual Report on the Economic Impact of the Federal Historic Tax Credit
(2010) agrees by stating that the “lion’s share of the economic benefits from the construction activity aided by the federal tax credits stays within a given state’s boundaries” (pg. 44). The ripple effect throughout the economy is therefore incremental and as such, lacks the sparkle of other larger economic development initiatives, but still remains as one of the most effective.
When taken together over time, the incremental impact of historic preservation both at the federal and state level becomes comprehensive. Over the past thirty years, approximately $85 billion dollars has been spent on historic rehabilitations utilizing federal historic tax credits (National Trust, 2010). Using an input-output analysis called the Preservation Economic Impact Model in order to capture the direct, indirect, and induced effects, the
First Annual Report on the Economic Impact of the Federal Historic Tax Credit (2010) estimated that 1,815,208 job were created (pg. 41). This translates to $197.6 billion in output, $71.7 in income, $97.6 billion in gross domestic product, and $28.7 billion in taxes ($21.0 billion federal government taxes, $3.9 billion state government taxes, and $3.8 billion local government taxes) (National Trust, 2010, pg. 41). Though these numbers do represent the impact of the federal credit nationwide, they are included so as to showcase the widespread economic benefits that historic preservation has created over the past three decades.
KJ! Further, historic rehabilitations can be analyzed with respect to investment quality and the resulting economic impact to the community. Each dollar spent on a historic renovation has been shown to have a greater economic effect with respect to job creation, income gains, and tax generation than that of new construction or infrastructure (National Trust, 2010, pg. 44-45). Therefore, ignoring or downplaying the link between historic preservation and economic development becomes virtually impossible.
2.2.2 Focus on Downtown
In many communities across the country, core urban areas and the historic buildings located there have been deteriorating for many years. Cities searched for ways to create value in these forgotten areas, and turned to urban commercial centers as a way to showcase their unique heritages. Historic preservation provides a unique opportunity for the regeneration and revitalization of older neighborhoods in an economically viable way. Therefore, much of the emphasis on historic preservation has been focused on downtowns in the form of the Main Street program, established in 1980 by the National Trust for Historic Preservation (Robertson, 2003). A natural connection exists between furthering the idea of historic preservation as economic development and revitalizing commercial centers, especially those in smaller communities. As a result, the National Main Street program is a considerable success. In 2008, $48.8 billion was reinvested in 206,600 buildings, which created 391,050 jobs and a net gain of 87,850 businesses in over 2,200 communities (Reinvestment Statistics, 2009).
The Main Street program is centered around four points: organization, promotion, design, and economic restructuring (The Main Street Four Point Approach, 2009). The goal is to implement an organizational framework that promotes and celebrates the unique assets of that city’s commercial core. People will then become encouraged to live, work, play, and invest in these well-designed, economically thriving places (The Main Street Four Point Approach, 2009). Since its inception in North Carolina, Main Street communities have seen $1.4 billion in new investment, a net gain of 13,700 jobs, the renovation of 3,300 buildings, and the addition of 3,300 businesses (North Carolina Main Street Center, 2010). The trend to couple urban design initiatives, specifically those that use historic preservation as a way to establish a sense of place, with financial incentives are commonly accepted ways to create stable and sustainable cities (Hipler, 2007).
However, the thrust for urban revitalization in any sort of comprehensive and concerted manner stops with Main Street, leaving the maintenance of urban neighborhoods to local governments and concerned citizen groups. Federal tax credits are unavailable to non-income producing properties, so their impact on residential neighborhoods is absent. While the Main Street program has found considerable success in revitalizing the commercial centers of downtown, the fragmented nature of the tools available for urban neighborhoods could limit the ability of towns and cities to realize sweeping benefits for both their commercial and residential centers.
2.2.3 Tools for Neighborhoods
KK! homeowners to rehabilitate their historic properties and, as previously described, has been able to realize significant economic benefit to the state. However, this is not a viable option for states that do not tax income; further, much variation exists with respect to individual state benefits (Preservation, 2007). Map 1, below, graphically represents those states that have some type of state income tax incentive for the rehabilitation of historic properties as well as those that do not tax income at all.
Map 1. Summary of States with Tax Incentives for Historic Properties
From: National Trust for Historic Preservation. State Tax Credits for Historic Preservation: A State by State Summary. (2007, July).
With thirty states offering some type of historic rehabilitation tax incentive and even more with proposed legislation, the desire to preserve historic structures is clear (Preservation, 2007). In fact, legislation proposed in Pennsylvania and Kentucky is directly related to economic development goals (Ruiz, 2005). In Pennsylvania, the state representative introducing the bill spoke specifically to the need for incentives to reverse the “hollowing out” trend in urban commercial and residential centers, and in Kentucky, a historic preservation tax credit is part of a larger “JOBS for Kentucky” initiative (Ruiz, 2005). Despite the fact that any type of uniform, country-wide policy dealing with non-income producing properties does not exist, a majority of states have recognized the economic benefits of historic preservation and have taken it upon themselves to create legislation that reflects these facts.
At the local level, individual towns and cities use zoning in order to regulate the appearance or stay a demolition of a historic building. Please see section 2.1.1 (Historic Districts & Designation) for a discussion of the specifics of local historic districts. In Durham, as in most cities with Historic Preservation Commissions, the quasi-judicial body’s main concern is the continued historic integrity of the district through design review and demolition delay (Historic Preservation Commission Process Overview, 2006). Preservation commissions routinely use their power to create historic districts “in order to act as a bulwark against unchecked demolition…and rampant construction” (Jacobs, 2003). As such, there is no
State Tax Credits for
Historic Preservation
A State-by-State Summary
www.nationaltrust.org ! policy@nthp.org ! 202-588-6167Chart last updated: July 2007
States with income tax incentives
States that do not tax income
State Tax Credits for Historic Preservation
A State-by-State Summary www.nationaltrust.org ! policy@nthp.org ! 202-588-6167
Chart last updated: July 2007
KI! explicit mechanism to encourage rehabilitations, but instead utilize rules and regulations to ensure continued neighborhood vitality.
Over the past thirty years, the connection between historic preservation and economic development has been growing stronger as more and more research emerges to substantiate the benefits of preservation through historically responsible redevelopment. Tax credits and other tax incentives offered at the federal and state level have led to increases in jobs and businesses, which are realized not only when the renovation is complete but also during the rehabilitation process. Yet the tools available for inner-ring residential suburbs remain fractured by state and limited in scope. The example set by North Carolina to create tax incentives for homeowners seems to be a step in the right direction; however, further examination of the effectiveness of this policy to incentivize rehabilitations is needed.
2.3 Historic Preservation and Residential Property Values
The purpose of this study is to discern the impact that state tax credits have had on the incidence of renovations in a National Register Historic District and to examine the impacts of those renovations on the neighborhood and city. When beginning to research this topic, the majority of existing literature focuses on the impact that designation has on home value, not on how designation can be used to create policies that influence behavior and what impact that may have on the neighborhood, which is the focus of this study. The following section will review the literature that analyzes the relationship between historic designation and property values using a variety of statistical methods but also highlights a couple studies that deviate from this trend. This discussion becomes important as the impact to the neighborhood and city is considered later on in this paper.
2.3.1 Quantifying the Impact
A substantial number of studies have concluded that historic designation does improve the property value of residential properties. The majority of the more recent studies use hedonic regression models instead of difference-on-difference to more accurately discern the specific impact of historic designation by isolating and then analyzing the components of home value to determine its marginal benefit. Asabere and Huffman (1994) found a twenty six percent premium on historic homes located in a National Register district in Philadelphia, Pennsylvania. Leichenko, Coulson, and Listokin (2001) analyzed all types of historic districts in nine Texas cities and concluded that historic designation positively impacts property values. Noonan (2007) found that historic homes in Chicago sell for a small premium of about three to five percent. While informative, important to remember is that the purpose of these studies was to isolate the value of designation as an amenity, much like the number of bathrooms or the presence of a pool.
KL! A natural association can be found between home refurbishment and an increase in property value. A study conducted by Lynch (2004) quantified the relative impact of renovation on housing prices within historic districts. Using actual sales data from three historically designated neighborhoods in Jacksonville, Florida, Lynch divided the homes into two categories: those in need of renovation and those that had already been rehabilitated. He concluded that restored homes sold for four times as much as those needing significant work, or $20,000 for un-renovated homes and $100,000 for renovated ones (Lynch, 2004). While beginning the conversation about rehabilitation’s impact on individual buildings, Lynch stops short of discussing mechanisms to encourage renovation or the impact that they may have on the communities of which they are a part.
2.3.2 Limitations of Existing Studies
Overall, the literature presented in this section focuses narrowly on identifying the marginal monetary effect that historic designation has on individual structures using hedonic price analysis. By narrowing the scope so strictly, differentiation between different types of districts, length of time a district has been in existence, policies in place to encourage renovation, and the amount of rehabilitations undertaken remain unexamined (Lynch, 2004). Asabere and Huffman (1994) simply treat this impact as an “externality”, and Schaeffer and Millerick (1991) make the blanket statement that the effect of neighborhood amenities, such as being in a historic district, is “substantial”, which they have quantified at ten to fifteen percent. This is, in part, a limitation of using hedonic price analysis. The variations in types, rules, and regulations for districts mean that gathering a enough data to yield meaningful results for each distinction is unlikely; therefore, most studies will group them all together.
Some of these issues are dealt with in passing in a few of the studies; Schaeffer and Millerick (1991) liken National Register designation to a prestigious “designer label” that pressures the local government to prevent neglect and provide adequate services to the area as a possible explanation for higher property values in these districts. This assertion is made as almost an afterthought, and without quantitative evidence to substantiate the claim. Therefore, while existing studies that examine the impact of historic designation on property values are useful in that they establish that historic homes are, in general, more valuable just by virtue of their inclusion in a historic district, they fall short of addressing the research question central to this paper.
2.4 Further Considerations
KM! The purpose of this study is twofold: first, to examine the degree to which historic preservation tax credits for non-incoming producing properties offered by the state of North Carolina are utilized by inner-ring suburbs; and second, to analyze the ability of this incentive to catalyze and maintain reinvestment and reinvigoration of urban residential neighborhoods. Trinity Park, a long-standing National Register Historic District in Durham, North Carolina, will serve as the case study for this purpose. In order to accurately examine this research question and establish a logical guide, further discussion of the scope and sequence will follow.
3.1 Choosing & Defining Trinity Park
Trinity Park is a largely residential neighborhood located to the immediate northwest of downtown Durham, sandwiched between the Durham Freeway (Route 147) and Interstate 85. Bordered roughly on the east by North Duke Street, the west by North Buchanan Boulevard, the north by West Club Boulevard, and the south by Lamond Avenue, Trinity Park paints a large north-south swath populated by over seven hundred individual parcels (History of Trinity Park, n.d.). The map below shows the relative location of Trinity Park within the City of Durham.
Map 2. Relative Location of Trinity Park
From: Google Maps (2010). User generated map of Trinity Park. Created March 10, 2010.
Trinity Park’s story began in the late 1800s as a streetcar suburb, enjoyed prosperity until approximately mid-century before falling into decline, and experienced a renaissance lasting from the mid-1970s to present day (History of Trinity Park, n.d.). A wide variety of architectural styles lend the neighborhood its character. The earliest homes built in Trinity Park appear at the turn of the twentieth century; however, four Trinity College Faculty Row homes, circa 1891, display the Queen Anne style and were moved from the college to various locations around Trinity Park sometime in the 1910s (Brown, 1984). Other common
KG! architectural styles include two varieties of bungalows, foursquare, and neocolonial; by the 1930s, most of Trinity Park had been built out which is illustrated in the figure below (Brown, 1984). Small pockets of infill during the intervening years add to this architectural mosaic, and along with additions to existing buildings, continue to drive the evolution of Trinity Park.
Figure 3. Housing Stock by Year Built5
From: US Census. (2000). American FactFinder Summary File 3. Retrieved March 28, 2009.
The Trinity Historic District, one of the largest and longest-standing National Register Historic Districts in Durham, is composed of two separate neighborhoods: Trinity Heights, which also has local designation, and Trinity Park, which does not. Originally nominated to the National Register in 1984 (added in 1986), this district has been expanded on two separate occasions, in 2003 (added in 2004) and 2007 (added in 2008) (H. Wagner, personal communication, March 25, 2009). This report focuses exclusively on the Trinity Park portion, which has only National Register designation. The district’s long history allows for a comprehensive comparison of renovations undertaken before and after the creation of non-income producing historic preservation tax credits by the state of North Carolina in 1998 (Federal and State, n.d.). Coupled with its large size, this urban neighborhood became an excellent study area for the purposes of the research question.
The map below shows all of the National Register and local historic districts within the City of Durham. Its inclusion serves not only as an orientation to the City’s historic resources but also as an illustration of how these types of districts overlap and intersect with one another.
!!!!!!!!!!!!!!!!!!!!!!!!!!!!!!!!!!!!!!!!!!!!!!!!!!!!!!!!
5 Data was obtained from Block Groups 1, 2, and 3 from Census Tract 3.02 in Durham County, North Carolina. Trinity Park does not
accurately overlaying census block group data, and these block groups include some area outside of the district. Every effort was made to assure the most accurate representation possible.
0% 5% 10% 15% 20% 25% 30% 35% 1990 - 3/2000
1980 - 1989 1970 - 1979 1960 - 1969 1950 - 1959 1940 - 1949 1939 or earlier
Percent of Total Housing Stock
Y
ear Built Trinity Park
KN! Map 3. Durham Historic Resources
From: Durham City-County Planning Department. (2004, March 28). Durham Historic Resources.
3.2 Gauging Neighborhood Change & Tax Credit Usage
The goal of the first part of this study is to determine the degree to which historic preservation tax credits for non-incoming producing properties offered by the state of North Carolina are utilized by homeowners. This was accomplished by creating a database of information about each contributing property within Trinity Park that had undergone significant changes or alterations, which was then matched against those properties that had taken tax credits. At the culmination of this research, a judgment can be made with respect to the efficacy of tax credits to induce rehabilitation. Please see Appendix A for the entire database.
3.2.1 Creating the Neighborhood Change Database
In order to accurately gauge the usage and impact of historic preservation tax credits, a database of contributing residential homes to the Trinity Park National Register Historic District in Durham has been compiled. City building permits for each addition, renovation exceeding $25,000 (the minimum cost to qualify for a state tax credit), demolition, natural hazard damage, and new construction since 1987 (the earliest records still maintained by the city) were recorded so that the evolution of Trinity Park since designation could be accurately captured. Small projects, such as back decks, screened porches, foundation repairs, and interior alterations totaling less than $25,000 were excluded, as well as the construction of any accessory structure, like a detached garage or pagoda. However, additions costing any amount were recorded because they constitute an alteration of the building’s footprint and therefore the character of the dwelling. Therefore, the final list contained all substantial improvements to any contributing home within the district.
Next, this data was meshed with the individual building descriptions enumerated in the National Register nomination to ensure that only contributing buildings were listed, as those
Trinity Park
KO! are the ones eligible for state tax credits. Finally, the renovations within the database were compared to records of state tax credits taken by address and year, allowing for some lag between permit year and tax credit year, if necessary, since credits cannot be taken until work is complete. The data was then analyzed by type, date, and usage of tax credits for each year since designation.
3.2.2 Assumptions & Limitations of the Neighborhood Change Database While comprehensive, the database is incomplete. Inconsistencies arose in which several addresses claiming the use of tax credits had no permit record with the City or were listed as non-contributing in the original 1984 nomination. When results are discussed in the following section, these properties are clearly marked as “NR” meaning that no record of their renovation exists within the city’s records. Also, definitive architectural labeling of structures added to the National Register in 2003 is avoided due to the absence of that nomination’s text. The full text of the database (please see Appendix A) simply leaves those fields blank.
3.2.3 Creating Geographic Information Systems Maps
The resulting Neighborhood Change Database was then imported into Geographic Information Systems and joined to a shapefile including all of the parcel boundaries within Trinity Park (this data had been clipped from a larger shapefile containing the entire city’s parcels). The resulting data manipulation allowed for the spatial representation of all fields in the Neighborhood Change Database, specifically the types of alterations and the usage of tax credits. Maps were created to show the distribution of additions, renovations, demolitions, new construction, and fire/hurricane damage throughout the district. Additionally, maps were created to reveal the spatial pattern of homes taking tax credits. The purpose of mapping neighborhood change is to infer or discern any recognizable or conceivable spatial patterns and determine if location within the district impacted or influence change.
3.3 Determining the Impact to the City of Durham
The next task was to gauge the impact of the change to the neighborhood as well as the City of Durham as a whole. An analysis of the estimated fair market values6 over time has been completed so that comparisons of computed summary statistics both over time and space could be evaluated. Further, approximate tax contributions have been computed as an additional way to describe the changing relationship between the neighborhood and the city. Using both of these measures, a judgment can be made as to the degree to which reinvestment spurred by state historic preservation credits impacted Trinity Park and the City of Durham.
3.3.1 Data Acquisition & Manipulation
Data was obtained from Durham City-County Geographic Information Systems (GIS) Department; specifically, parcel shapefiles for the entire city for each year from 2001 to 2010. These shapefiles were created by clipping the parcels for the entire county from the 2010 city boundary shapefile, which was chosen so that a consistent comparison could be !!!!!!!!!!!!!!!!!!!!!!!!!!!!!!!!!!!!!!!!!!!!!!!!!!!!!!!!
KP! made across the years. Other shapefiles, including those for the historic districts, parks, and roads, were also gathered from the department. The city-wide parcel shapefile was clipped in three different ways: first, all of the parcels within National Register Historic Districts were extracted into a new shapefile, then those within a Local Historic District, and finally those within Trinity Park, resulting in four distinct shapefiles (the three previously described plus the one of the entire city) for each year from 2001 to 2010. Both National Register and Local Historic Districts were added over this time period, and in order to accurately reflect just those parcels within historic districts, the shapefiles created for each year only included those parcels that were designated as of that year, which does create fluctuations in the number of parcels.
Next, the attribute tables of each shapefile were exported from GIS into .csv spreadsheets and opened in Excel. These databases included a wealth of information including land value, building value, total value, and tax exempt code. Simple formulas were used to compute basic summary statistics; the sum, minimum, maximum, mean, median, and standard deviation for each group of parcels over the years available were gathered into a single summary statistics spreadsheet for easy comparison. Please see Appendix B for the complete tables.
Finally, an approximation of the tax revenue generated by each group of parcels was created from the same attribute tables used to compute the basic summary statistics. For this calculation, the marginal tax rates for both the city and the county were obtained from the County Tax Assessor’s website for the years from 2001 to 2010 and the appropriate rate applied to the total value field for each parcel to determine their tax liability. However, not all parcels pay the full tax rate; therefore, the spreadsheets were sorted based on their tax exempt code and an address was chosen at random for each type of tax exempt code to be “spot checked” against the tax liability according to the County Tax Assessor website. At this point, the amount of the discount could be figured and applied to all parcels with that same code. When all the types of discounts had been accounted, a total was summed. These totals were then gathered into a table for easier comparison; please see Appendix C.
3.3.2 Assumptions & Limitations of the Data
KQ! 4.1 Assessing Change in Trinity Park
The creation of the Neighborhood Change Database yielded approximately 230 individual properties within Trinity Park that had undergone significant change over the past twenty years. Mapping served as the first step in the analysis and accomplished a variety of goals, primarily to discern any spatial patterns of change but also to simply provide another lens through which this data can be viewed. Map 4, Significant Alterations to the Trinity Park Neighborhood 1987 – 2008, represents the first piece of the analysis.
IJ! The most striking feature of the map is that the number of renovations far outweighs any other type of alteration. The absence of any discernable neighborhood-wide spatial pattern beyond this is far from concerning as homeowners are most likely concerned with their immediate neighbors and less so with those a mile away; therefore, the emergence of several clustering patterns would be more likely. The southwest quadrant appears to be the most active with renovations, and the northwest one shows the least activity. Instances of new construction have these roles switched with the bulk of new buildings being constructed in the northern half of the neighborhood. Additions seem to be more evenly spaced throughout Trinity Park. A possible explanation can be extrapolated from the fact that since the boundary increase in 2004 added the northern parcels; either those buildings were in less need of renovation, or the absence of a tax credit incentive made rehabilitations less desirable.
At this point, the assertion has been made that Trinity Park has undergone significant change over the past 20 years. Figure 4, Summary Table of Alterations to Trinity Park Structures by Type and Decade, appears below and adds another dimension to the map shown above. By breaking the alterations into pre- and post-tax credit time periods (state tax credits were not available until 1998), the role that state tax credits have played in renovations can begin to be analyzed.
Figure 4. Summary Table of Alterations to Trinity Park by Type & Decade
Additions Rehabilitations Tax Credits Used Demolitions Construction New Fire/Hurricane Damage Total
1987-1997 21 30 0 1 2 5 59
1998-2008 28 84 50 4 12 5 133
From: Durham City-County. Permit Office. (2006, March). Building Permits. and State of North Carolina. State Historic Preservation Office, Restoration Branch. (2009, March 6). Tax Credits.
IK! Figure 5. Alterations to Trinity Park Structures by Type and Year
Additions Rehabilitations Tax Credits Used Demolitions Construction New Fire/Hurricane Damage Total
1986 0 0 0 0 0 0
1987 3 3 0 0 0 6
1988 3 1 0 1 0 5
1989 2 1 0 0 1 4
1990 3 3 0 0 0 6
1991 3 3 1 0 0 7
1992 1 6 0 0 1 8
1993 1 1 0 1 0 3
1994 3 6 0 0 1 10
1995 0 2 0 0 0 2
1996 2 1 0 0 2 5
1997 0 3 0 0 0 3
1998 4 3 0 0 0 0 7
1999 0 7 1 0 1 1 9
2000 2 4 3 0 1 0 7
2001 1 7 9 0 1 0 9
2002 1 8 4 0 1 1 11
2003 1 6 1 0 1 0 8
2004 4 8 9 0 0 1 13
2005 2 5 3 1 2 0 10
2006 3 7 8 1 1 1 13
2007 4 13 5 1 3 1 22
2008 6 16 7 1 1 0 24
NR7 18 18
Total 49 132 50 5 14 10 210
From: Durham City-County. Permit Office. (2006, March). Building Permits. and State of North Carolina. State Historic Preservation Office, Restoration Branch. (2009, March 6). Tax Credits.
4.1.1 Assessing the Use of Non-Incoming Producing Tax Credits in Trinity Park
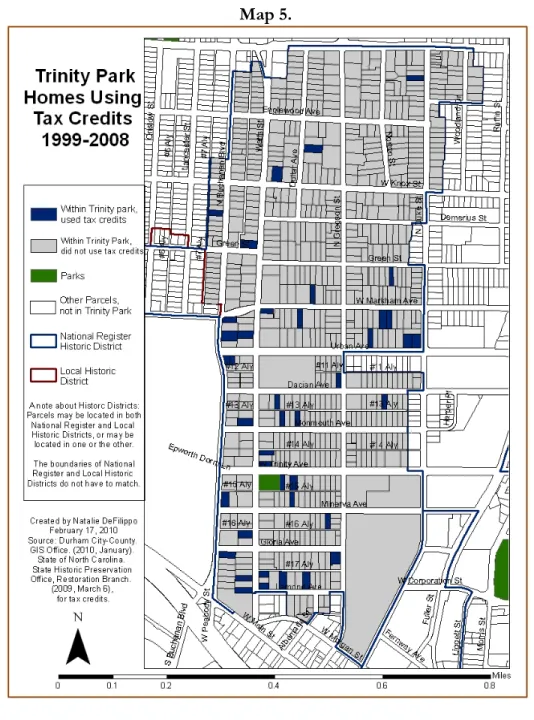
Having established that Trinity Park has undergone significant change in the past twenty years, attention turns to the use of state tax credits. In order to properly frame the conversation, this section will begin with a comprehensive look at tax credit use in North Carolina. Since the inception of state tax credits for rehabilitations of non-income producing buildings in 1998, North Carolina has spurred 62 counties to undertake 974 projects totaling more than $144 million. Durham County ranks third (behind Wake and Mecklenberg, respectively) with 86 rehabilitations, or nine percent state-wide. With fifty projects, Trinity Park represents fifty eight percent of Durham County’s total, suggesting not only substantial reinvestment in the neighborhood but a heightened awareness of the availability of state tax credits. Map 5, Trinity Park Homes Using Tax Credits 1998 – 2008,
!!!!!!!!!!!!!!!!!!!!!!!!!!!!!!!!!!!!!!!!!!!!!!!!!!!!!!!!
#!NR: no record of the rehabilitation year, type, or cost exists in the city’s building permit records; only data
II! follows below to graphically represent the homes using credits. Note should be made that less than fifty parcels are highlighted because some have taken tax credits more than once.
Figure 6. Non-Income Producing Properties using Tax Credits since 1998 Number of Projects Estimated Reinvestment
North Carolina 974 $144,239,164
Durham County 86 $10,037,201
Trinity Park 50 $5,307,1078
From: State of North Carolina. State Historic Preservation Office, Restoration Branch. (2009, March 6). Completed Historic Rehabilitation Tax Credit Projects in North Carolina’s 100 Counties.
Map 5.
!!!!!!!!!!!!!!!!!!!!!!!!!!!!!!!!!!!!!!!!!!!!!!!!!!!!!!!!
8 Cost data could only be gathered on 7 out of 50 properties (or 14%) taking tax credits, totaling $742,995. Extrapolation of this data for
IL! Similar to the previous map, there is no strong neighborhood-wide pattern of clustering; instead, smaller pockets of activity can be observed. The southern portion of the district is the most active which is to be expected since the previous map showed that area as having the most renovations. The most interesting aspect of this map is the “micro-relationships” between two or three neighboring parcels. Using the intersection of Watts St and Lamond Ave as an example (at the southwest edge of the district), five homes taking tax credits can be observed within a few hundred feet of one another. This type of “micro-clustering” suggests that these homeowners know each other well enough to exchange information about the availability of and mechanisms for taking tax credits. While in no way definitive, this pattern suggests that word of mouth plays a role in how information about tax credit availability is disseminated.
4.1.2 Analyzing Rehabilitations & Tax Credit Use
Map X, Renovations and Tax Credits in Trinity Park 1987 – 2008, is meant to mesh the most pertinent types of data from the two previous maps and reveals the spatial arrangement of renovations and tax credit use in the neighborhood.
IM! Despite covering twenty years of renovations and only ten years of tax credit use, the map shows that a majority of homes that were renovated did use tax credits. This observation alone substantiates the claim that state tax credits had at least some impact on the decision to rehabilitate. Using the intersection of Watts St and Lamond Ave again as an example, a cluster of renovated homes can be observed, and can also be seen traveling north on Watts St towards Minerva Ave. Figure 7, Rehabilitations and Tax Credits by Year, lends quantitative substance to this map, as it numerically demonstrates the relationship between rehabilitations undertaken and tax credits used.
Figure 7. Rehabilitations and Tax Credits by Year
Rehabilitations Tax Credits Used Percent of Rehabilitations taken for Tax Credit
1998 3 0 0%
1999 7 1 14%
2000 4 3 75%
2001 7 9 129%
2002 8 4 50%
2003 6 1 17%
2004 8 9 113%
2005 5 3 60%
2006 7 8 114%
2007 13 5 38%
2008 16 7 44%
NR9 18 36%
From: Durham City-County. Permit Office. (2006, March). Building Permits. and State of North Carolina. State Historic Preservation Office, Restoration Branch. (2009, March 6). Tax Credits.
Several observations can be made from an examination of the above table. Three years, 2001, 2004, and 2006, show a percent of rehabilitations taken for tax credit over one hundred; however, this can be explained due to the nature of the data, in that building permits (the source of the number of rehabilitations) are obtained when work begins, and tax credits can not be taken until renovations are complete. Therefore multi-year projects must have been executed in the years preceding those mentioned above. Interestingly, the most state tax credits were taken in 2001, which may represent the impact of the initial state tax credit offering. Further, the flurry of activity in 2007 and 2008 could be the result of the lax regulatory atmosphere that enabled favorable lending terms for homeowners, providing the cash flow necessary for some of these renovations to have taken place.
4.1.3 Interim Results: Neighborhood Change & Tax Credit Use
Taking a comprehensive look at the results presented so far, the first part of the research question can be answered. With seven more additions, fifty-four more rehabilitations, three more demolitions and ten new structures undertaken during the past ten years, the conclusion can be reached that there has been an increase in activity and investment in the neighborhood since state tax credits became available. Notably, rehabilitations outnumber all other types of alterations during both decades, and their dominance from 1998-2008 !!!!!!!!!!!!!!!!!!!!!!!!!!!!!!!!!!!!!!!!!!!!!!!!!!!!!!!!
IG! indicates an interest in preserving the neighborhood’s historic structures. Taken along with the knowledge that at least fifty of the eighty-four rehabilitations projects upheld the Secretary of the Interior’s Standards for Rehabilitation, the conclusion that Trinity Park is maintaining its historic structures through the use of state tax credits can be supported. Data, both mapped and in table form, support the assertion that state tax credits are a viable incentive to induce reinvestment through rehabilitation in historic neighborhoods.
However, while tempting to conclude from the evidence presented that state tax incentives are strong enough to maintain the historic integrity of a neighborhood on its own and that local historic designation is unnecessary, data analysis of this type should never be conducted without an understanding of the local dynamics. The Trinity Park Neighborhood Association (TPNA) was established in 1974 and remains influential and well respected within the community and city as a whole. Residents are active, informed, connected, and passionate about both community and city wide issues (TPNA meeting, personal communication, April 1, 2009). TPNA’s president, Linda Wilson (personal communication, April 1, 2009) estimated that seventy five percent of projects were begun with the expectation of state tax credits, which closely aligns with the sixty percent observed in the data. Therefore, the conclusion that the maintenance of Trinity Park as a viable and thriving National Register Historic District solely via state tax credits must be qualified with respect to the strength of the TPNA. Without oversight of some variety at the local level, be it a strong neighborhood organization or local historic designation, the maintenance of historic properties is less certain.
4.2 Changes in Estimated Fair Market Value
Having concluded that state tax credits for non-incoming producing properties in North Carolina successfully incentivize homeowners to renovate their properties in a historically responsible manner, the research task now shifts to an analysis of the impact of that reinvestment on the neighborhood and the city as a whole. The mechanism for answering this question lies with an examination of the estimated fair market values throughout the City of Durham from 2001 – 201010. Map 7, Estimated Fair Market Values, City of Durham 2002, on the following page will begin this conversation. Revaluations of estimated fair market value happen every eight years; 2002 marks two years after the last revaluation and four years after tax credits had been offered. At this point, seventeen out of fifty properties, or thirty four percent, had taken tax credits. Figure 8, Estimated Fair Market Value Summary Statistics 2002, compares basic information between the City of Durham and Trinity Park, and immediately follows Map 7. This data can be measured against Map 8, Estimated Fair Market Values, City of Durham 2010, and its accompanying Figure 9, Estimated Fair Market Value Summary Statistics 2010 (there was a revaluation in 2008). Note should be made that the values displayed by color on the map are not normalized in any way. For a comprehensive look at how the summary statistics have changed yearly, including all National Register and Local Historic District parcels, please see Appendix B.
!!!!!!!!!!!!!!!!!!!!!!!!!!!!!!!!!!!!!!!!!!!!!!!!!!!!!!!!
10 Please see Section 3.3 Determining the Impact to the City of Durham for a discussion of the rationale behind this decision.
IN! 4.2.1 Comparing Estimated Fair Market Values, 2002 and 2010
Map 7.
Figure 8. Estimated Fair Market Value Summary Statistics 2002
City of Durham Trinity Park
Total Value of all Parcels $ 14,703,133,521.00 $ 145,260,122.00 Number of Parcels 71,153 768
Minimum Value $ 0.00 $ 0.00
Maximum Value $ 285,812,810.00 $ 16,123,469.00
Mean Value $ 206,641.09 $ 189,140.78
Median Value $ 99,806.00 $ 148,624.50 Standard Deviation $ 2,611,784.25 $ 617,138.92
IO! Map 8.
Figure 9. Estimated Fair Market Value Summary Statistics 2010
City of Durham Trinity Park
Total Value of all Parcels $ 20,637,276,197.00 $ 242,449,293.00 Number of Parcels 79,058 767
Minimum Value $ 35.00 $ 100.00 Maximum Value $ 278,010,590.00 $ 19,987,564.00
Mean Value $ 261,039.69 $ 316,100.77
Median Value $ 143,896.00 $ 248,049.00 Standard Deviation $ 1,620,082.13 $ 762,573.71
IP! Focusing first on Map 7, no clear distinction can be seen between those parcels within Trinity Park and those outside of it. A slight increase in value can be discerned along the major north-south thoroughfares of Watts St and Gregson St, but these parcels are somewhat larger than the surrounding ones and could be the result of not normalizing any of the displayed values. Accompanying summary statistics bear out this initial observation: the mean estimated fair market value for Trinity Park parcels is eight percent, or $17,500.31, lower than the City of Durham. In 2002, state tax credits had only been available for four years, and while that is not an insignificant amount of time, since renovations much reach a threshold of $25,000 spent and credits can only be taken once work has been completed, four years is simply not enough time to see widespread change.
Turning next to Map 8, a clear and marked change in estimated fair market values can be observed. While the revaluation in 2008 increased these values across all parcels within the City, the increase in Trinity Park is much more dramatic (please see Figure 10). In 2010, the mean estimated fair market values are seventeen percent, or $55,061.08, higher than the City of Durham (please see Figure 11. below). Therefore, the conclusion drawn from an examination of the two maps and their summary data is that the increase in rehabilitations over the past ten years, demonstrated earlier, has manifested into higher mean estimated fair market values for Trinity Park11.
Both figures below further illustrate the changes in the relationship between the estimated fair market values in the City of Durham and Trinity Park.
Figure 10. Mean Estimated Fair Market Values12
From: Durham City-County GIS Office. (2010, January).
Figure 11. Percent Increase in Estimate Fair Market Values, 2007 - 2008
!!!!!!!!!!!!!!!!!!!!!!!!!!!!!!!!!!!!!!!!!!!!!!!!!!!!!!!!
11 For a breakdown of the summary statistics by year from 2001 to 2010, please see Appendix B.
$%!Data from 2006 is missing due to a problem with the attribute table fields in the GIS shapefile from the Durham City-County GIS Office.
$- $50,000.00 $100,000.00 $150,000.00 $200,000.00 $250,000.00 $300,000.00 $350,000.00
2001 2002 2003 2004 2005 2006 2007 2008 2009 2010
City of Durham Trinity Park
32%
61%
0% 20% 40% 60% 80%
City of Durham Trinity Park
From: Durham City-County GIS Office. (2010, January).
IQ! Above, Figure 10 graphically represents the impact of the 2008 revaluation mentioned previously. Prior to 2008, the mean estimated fair market values for the City of Durham exceed that of Trinity Park by a small margin. While the jump in values after revaluation makes sense given the economic climate in 2008, Figure 11 shows that the value of Trinity Park’s parcels grew by sixty one percent, which is almost double the thirty two percent by which the City’s parcels increased. Therefore, simply stating that the creation of a National Register Historic District will augment home value is misguided; rather, the relationship between tax credit incentives to spur renovations, which in turn raise value through reinvestment, is more appropriate13.
4.2.2 Changes in Tax Revenue
Finally, attention turns to the impact that these changes to the Trinity Park neighborhood have had on the City. The mechanism chosen for this analysis is an approximation of tax revenue generated, and the purpose is to extend and expand upon the conclusion presented in the previous section that state tax credits incentivize renovations that will then increase home values14. Below, Figure 12 includes the percent change in tax revenue year by year, and Figure 13 highlights the change between 2007 and 2008, when revaluation occurred.
Figure 12. Estimated Tax Revenue by Year
City of Durham Percent Change Trinity Park Change Percent Tax Rate15
2001 $77,085,997.43 $807,074.83 0.680
2002 $65,220,980.31 -15%16 $639,502.08 -21% 0.545 2003 $67,317,830.82 3% $617,170.62 -3% 0.545 2004 $78,024,352.46 16% $664,600.44 8% 0.583 2005 $77,408,460.90 -1% $668,294.55 1% 0.583 2006
2007 $83,444,221.56 8% $718,784.19 8% 0.618
2008 $98,024,227.77 17% $1,085,819.35 51% 0.540
2009 $99,657,338.64 2% $1,090,521.55 0% 0.540 2010 $100,812,723.73 1% $1,092,696.26 0% 0.540
From: Durham City-County GIS Office. (2010, January).
!!!!!!!!!!!!!!!!!!!!!!!!!!!!!!!!!!!!!!!!!!!!!!!!!!!!!!!!
13 Also recall the importance of some type of local regulatory environment, be it local historic district status or a strong neighborhood association.
14 For a discussion of the assumptions and limitations of gathering and manipulating the tax data, please see section 3.2.2.
15 Marginal City Tax Rate per $100 of value.
LJ! Figure 13. Percent Change in Tax Revenue, 2007 - 2008
The largest increase in tax revenue for both the City of Durham and Trinity Park was in 2008, which is to be expected due to the revaluation; however, as Figure X emphasizes, the boost is far more pronounced in Trinity Park. Other years show smaller variations that can be mostly explained by an oscillating city tax rate, including the large decrease from 2001 to 2002 where the rate fell by fourteen cents. Further evidence of the benefit to the City of Trinity Park’s reinvestment can be found by comparing the district’s tax revenue contribution relative to the City of Durham as a whole in 2002 and 2010. As Figure 14 below shows, Trinity Park comprised 0.99 percent of all tax revenue in 2002, which grew to 1.10 percent in 2010. Though small, the growth of one tenth of one percent is not without some importance as it continues to strengthen the conclusions already drawn.
Figure 14. Comparison of Relative Contribution to Tax Revenue, 2002 and 2010
From: Durham City-County GIS Office. (2010, January).
4.2.3 Interim Results: Neighborhood & City Impact
Having explored the second part of the research question with a comparison of estimated fair market values and tax revenue generation in Trinity Park and the City of Durham over time, the observation can be made that both fair market values and tax revenue have climbed more rapidly in Trinity Park than in the City of Durham over the past ten years. From the perspective of the city, appreciation in value is desirable not only for the increase in tax revenue but also as a reflection of urban vibrancy. Therefore, the assertion can be made that it would be in the city’s best interest to create, maintain, and encourage renovation in National Register Historic Districts. In the absence of a Local Historic District’s zoning powers of design review and demolition delay, National Register Historic Districts can maintain their historic integrity with this policy; however, some type of local oversight and control is also desirable.
17% 51%
0% 20% 40% 60%
City of Durham
Trinity Park
99.01 %
0.99% 2002
City of Durham
Trinity
Park 98.90%
1.10% 2010
City of Durham
Trinity Park From: Durham City-County GIS Office. (2010, January).
LK! Homeowners may view the results presented in this section differently as they are asked to contribute more financially, but such is the tradeoff for living in a thriving, desirable neighborhood. Care should be taken by the city to ensure that residents who currently live in Trinity Park and want to stay there are not forced to leave due solely to tax obligations; the City of Durham does have several programs available for tax relief under certain circumstances (please see Durham County Government’s Property Tax Relief Applications portion of their website)17. Further implications of possible gentrification are eschewed as that particular impact is beyond the purview of this paper and is left purposefully unexamined (please see Section 2.4, Further Considerations, for a short discussion).
Finally, a well-maintained old building brings immediacy to history unlike any book or portrait because it can be touched, explored, and experienced. Living amongst a collection of these structures engenders a reverence for and pride in a neighborhood’s story. Incentivizing and regulating the care and maintenance of these buildings becomes important in building and preserving neighborhood history and vibrancy. In conclusion, state tax credits offered in North Carolina for the historically appropriate renovation of non-income producing properties in National Register Historic Districts are an effective means to incentivize homeowners to reinvest in inner-ring residential suburbs. Over time, the impact of this reinvestment has manifested into increasing estimated fair market values for the neighborhood and greater tax revenue for the city.
!!!!!!!!!!!!!!!!!!!!!!!!!!!!!!!!!!!!!!!!!!!!!!!!!!!!!!!!
LI! Asabere, P. K., & Huffman, F. E. (1994, July). Historic Designation and Residential Market
Values. The Appraisal Journal , 396-401.
Brown, C. R. (1984). National Register of Historic Places Inventory - Nomination Form. United States Department of the Interior, National Park Service, Durham, North Carolina.
Center for Urban Policy Research. (May 1997). Economic Impacts of Historic Preservation.
Rutgers, The State University of New Jersey.
Coulson, N. E., & Leichenko, R. M. (2004). Historic Preservation and Neighbourhood Change. Urban Studies, 41 (8), 1587-1600.
Coulson, N. E., & Leichenko, R. M. (2001). The Internal and External Impact of Historical Designation on Property Values. Journal of Real Estate Finance and Economics, 23 (1), 113-124.
Coulson, N. E., & Leichenko, R. M. (2001). The Internal and External Impact of Historical Designation on Property Values. Journal of Real Estate Finance and Economics, 23 (1), 113-124.
Durham City-County Planning Department. (2004, March 28). Durham Historic Resources Map. Durham, NC.
Federal and State Historic Preservation Tax Credits. (n.d.). Retrieved February 18, 2009 from North Carolina State Historic Preservation Office:
http://www.hpo.ncdcr.gov/tchome.htm
Hipler, H. M. (2007, January). Economic Redevelopment of Small-city Downtowns: Options and Considerations for the Practitioner. The Florida Bar Journal , 39-42.
Historic Preservation Commission Process Overview. (2006). Retrieved Mar 31, 2010 from City of Durham; City-County Planning Department:
http://www.ci.durham.nc.us/departments/planning/historic_preservation_overview .cfm
Historic Preservation Tax Incentives. (n.d.). Retrieved February 19, 2009, from National Park Service: http://www.nps.gov/history/hps/tps/tax/brochure1.htm
History of Trinity Park. (n.d.). Retrieved March 19, 2009, from Trinity Park: http://www.trinitypark.org/history.php
Holton, R. (2008). A Profitable Past, A Priceless Future. University of North Carolina at Chapel Hill.