Oluseyi F. Alaba. A Statistical Study of Information Patterns on the Web. A Master’s Paper for the M.S. in I.S degree. October, 2010. 53 pages. Advisor: Robert Losee
This paper develops and tests two theories about the network structure of a sample of archived web documents using four statistical models. Starting from previous theories of small world networks and authority and hub constructs, each model is further developed from the hypothesis that the web is a complex network. A complex system is one where seemingly random units, which are self similar, are not independent, but whose bands of interdependence at a local level create emergent, or system-level patterns that are very different from their local level units. The models were tested using structural equation techniques and cannot be rejected as possible representations of the underlying
framework of the web.
Headings:
Computational Complexity
Information Theory/Evaluation—Entropy
Knowledge Maps
Social Capital
by
Oluseyi F. Alaba
A Master’s paper submitted to the faculty of the School of Information and Library Science of the University of North Carolina at Chapel Hill
in partial fulfillment of the requirements for the degree of Master of Science in
Information Science.
Chapel Hill, North Carolina
October 2010
Approved by
_______________________________________
Table of Contents List of Figures List of Tables
1. Introduction………... 4
2. Background……….... 6
2.1 The Web: A Network With Embedded Knowledge Capital……... 6
2.1.1 Social Capital……….. 6
2.1.2 Information is Capital……….. 7
2.1.3 Knowledge Capital is Embedded in a Network of Information………... 8
2.1.4 Global Parameters: Emergent Attributes of a Complex System……….. 9
2.2 The Web: A Network Of Strongly Tied, Small-World Groups Connected By Weak Ties……….. 12
2.2.1 Homophily………... 12
2.2.2 Heterophily……….. 13
2.2.3 Trust, Reputation and Weak Ties……… 14
3. Development of Model and Expectations……… 18
3.1 Parsing Specifications and Metric Creation……… 20
3.2 Description of Variables……….. 21
3.3 Sample Description……….. 22
3.4 Measurement Description……… 23
3.5 Authority-Hub……….. 24
3.6 Structural Equation Models (SEM)………. 25
3.6.1 Identification………... 26
4. Results and Discussion……….. 28
4.1 Content Analysis………. 28
4.2 Correlation………... 31
4.3 Network Metrics……….. 33
4.4 Network Graph……… 35
4.5 Structural Equation Models………. 36
5. Limitations and Future Work……….. 45
6. Conclusion………... 46
7. References……..………... 48
List of Figures
Figure 1: Power law distribution………. 15
Figure 2: Mahalanobis outliers……… 28
Figure 3: Distribution of outdegree………. 30
Figure 4: Distribution of centrality………. 30
Figure 5: Fractal dimension: semi-log function of subsample……… 33
Figure 6: Network graph edges=1795, nodes=1694; clusters with originating domains………. 36
Figure 7: SEM Model 1 (AB=free) and Model 2 (AB=0)……….. 38
Figure 8: SEM Model 3 (AB=free) and Model 4 (AB=0)……….. 43
Figure 9: Histogram of betweeness………. 50
Figure 10: Histogram of numofuniquelinks………... 50
Figure 11: Histogram of mjcntpp……….. 50
Figure 12: Histogram of wordcntpp……….. 50
Figure 13: Histogram of ttlinkspp………. 50
List of Tables
Table 1: Descriptive statistics……… 29
Table 2: Univariate normality……… 31
Table 3: Variable correlation………. 31
Table 4: Fractal dimension given box size r……….. 34
Table 5: Node distribution per cluster……… 34
Table 6: Maximum Likelihood Estimates: Regression Weights: (Group number 1 - AB free)….……… 38
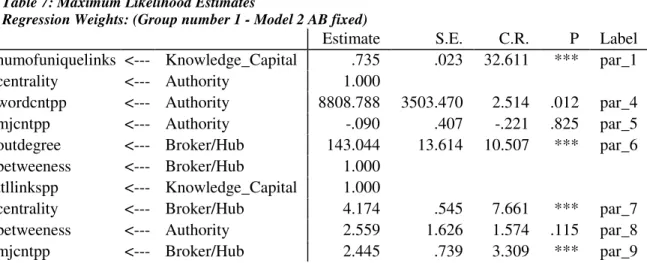
Table 7: Maximum Likelihood Estimates: Regression Weights: (Group number 1 - Model 2 AB fixed).………... 39
Table 8: Standardized Estimates………... 40
Table 9: Covariances………...……….. 41
Table 10: Maximum Likelihood Estimates Regression Weights: (Group number 1 – Model 3 AB free)...………... 43
Table 11: Maximum Likelihood Estimates Regression Weights: (Group number 1 - Model 4 AB fixed) ………... 44
1. Introduction
This paper outlines previous research from the study of social capital and web
analytics to test models of previously advanced theories and develop and test new
theories incorporating the complexity of network topology on the World Wide Web
(hereafter referred to as “the web”). Are there discernable statistical patterns evident in
the seemingly random residue of information records on the web? To date, some
research has been done to evaluate and chart the web using web page word distribution
and the link structure of web pages. These studies offer an important aspect of studies
about networks and the web as a self-similar, self-organizing information system. The
web is comprised of web pages which are units of information that organize and
self-regulate without central authority, developing a powerful information system from an
ad-hoc collection of data. These seemingly chaotic networks develop in ways that are
self-similar and self-sustaining. They have the same patterns at different scales, can replicate
themselves, correct errors and organize without guidance from a central authority. From
this complex network of interdependent units of information may emerge knowledge, or
multiple dimensions of meaning, that are more than the simple aggregate of a network’s
individual units. Understanding the causal relationships within this network of
information will enable us to more effectively and efficiently traverse the data collection
and identify emergent characteristics, such as knowledge or meaning, that are not
The expansion of digital technology, the advent of the internet, the emergence of
the web and Mandelbrot’s work in fractal theory have exploded work and ideas around
complex systems, where computers provide a mechanism for rigorous computation of
large data sets (Mandelbrot, 1982). Complexity theory, an emerging science, offers new
ways to understand the evolution, topology and relationships that comprise real networks,
including financial markets, population cycles, epidemiology, neural networks, ecological
systems, film actors, sexual contacts, the Internet and the web (Albert & Barabasi, 2002;
Anderson, 2004; Eglash, 1999; Mandelbrot, 1982; Newman, 2003). Certain topics and
domains may have different diffusion patterns. Some may adhere to a hierarchical
structure. Others may seem random. Still others, such as the web, are theorized to
exhibit a bow-tie shape.
The linkages of a specific topic are important for charting the movement of
information. However, the context of the web pages is also an important aspect of
understanding why information about a chosen topic may travel particular routes. Not
only are the links of a particular web page important in constructing this map, but
multiscale perspectives, including clusters of web pages and different time periods,
provide important contextual information about the dissemination pattern of a specific
topic. The purpose of this research is to provide a snapshot of the structure of a specific
type of information and identify multiple dimensions of the information topic to better
understand the bands of connection between data and the multiscale knowledge that the
relationships may reflect. This research will measure relationship properties based on
previously identified web analysis and social networking concepts. Additionally, this
micro-level and emergent parameter of a network of information. The properties that this
research may identify include power laws, clustering, authority-hub relationships, and
fractal dimension. In addition to supporting previous findings, identifying these
properties in the sample may offer new insight, not only by tracing topic-based link
patterns, but by understanding the embedded relationships among statistically self-similar
web-pages. In this way, the topology of the network can provide insight into the
interconnected dimensions of information, weaving individual units of data into meaning
and knowledge.
2. Background
2.1The Web: A Network With Embedded Knowledge Capital
2.1.1 Social Capital
In the same way that social capital represents resources that can be leveraged for
economic value as a result of social exchange, knowledge capital can be an emergent
attribute of a complex network of information nodes. Knowledge capital can also be
accumulated, invested and leveraged for economic currency or social prestige. Although
collective resources for a small group come from members of the group, social capital
represents resources embedded within these social networks that represent collective
value (Lin, 2001). Although networks are generally open and not easily demarcated they
may be comprised of small-world groups. Social capital can be measured on individual
and group levels. Individual assets are differentiated from collective assets, but members
have a causal relationship to macro level assets, while higher level parameters also affect
local units. The implications of social capital and the motivations for member
assets (Burt, 2005; Lin, 2001). As a group member, an individual directly or indirectly
accessing resources embedded in social networks can leverage control of community
resources and therefore gain more capital than an individual alone could have yielded due
to the relationships within the network. Similarly, assets of a social network that are not
available to individuals outside the group are valuable capital (Lin, 2001). Social capital
is a theory designed to measure the increased benefit of an individual connected through
a social network or the collective capital of a group that has value outside of the group.
The value of network resources can take on different forms and can be
accumulated and utilized in different ways. Resources are assigned values based on
social norms. For example, rank, authority, and prestige are all valuable markers of
capital within social networks (Burt, 2005; Lin, 2001). These signify advantages and
influence over others, and a member’s ability to accumulate more resources faster than
others in the group (Lin, 2001). Individuals with more resources tend to make decisions
for the collective group because of their higher status. Status within the group represents
entrenched capital. These decision making opportunities include the ability to enforce
group consensus and also to implement or improve the status of high-ranking members
(Burt, 2005; Lin, 2001). In this way, members can use collective assets as a type of credit
that is directly linked to their role in the network.
2.1.2 Information is Capital
Like other types of capital, such as prestige, rank, and influence, information can
also function as capital in networks. Information is a pattern of energy, or a pattern of
relationships to which meaning has been ascribed (Bates, 2005; Bar-Yam, 1997). In a
capital as the production of commodities that have surplus value; the value of labor that
produces the commodity is less than the value of the commodity which can be traded for
higher market value. The industrialist begins with surplus resources (capital) and is able
to produce more capital, creating value through investment (Marx & Engels, 1933).
Capital can be described as resources invested with expected returns. The capital
embedded within a social network includes the resources captured and used as investment
for the attainment of more resources. Unlike traditional forms of capital (land, physical
assets), social capital has no intrinsic value, but is based on social exchange (Lin, 2001).
Similarly, information, as a commodity, gains value in relationship to social structures.
Human capital, quantified as education and training, is a measure of information
available for an individual to leverage in the labor market (Lin). Cultural capital,
non-financial assets associated with education and intellectual knowledge in various spheres,
is also a measure of value of information given meaning by social processes (Bourdieu,
1972/1977). Information is created by humans for social purposes and, like these other
types of capital, can also be used as currency in analog and online social networks.
2.1.3 Knowledge Capital is Embedded in a Network of Information
Information is valuable capital. In the same ways that other types of social capital
can be invested to gain more for both the member and group as a whole, information can
also be invested, mobilized and can yield returns. On the web, this capital cycle may be
grounded in its small-world structure. Analogous to Granovetter’s (1973) strong and
weak tie formation, the web may be comprised of relatively small groups of strongly
connected websites which are strung together by weak ties. Conceptualizing each small
valuable means of currency. In this schema, information might translate to rank or
prestige on the web, which might be indicated by the number of visitors, the number of
in-bound hyperlinks, or monetized based on the number of ads on a web page. Although
online links may not correspond directly to reciprocated relationships, like many analog
relationships, there is a documented pattern of “hub” and “authority” web pages
(Kleinberg, 2001). Authority-hub relationships create a system of established social
norms, whereby hub pages link and direct web users to authority pages, which tend to
have information specific to the small group. Hub pages serve as directories for specific
topics and authority pages tend to have a disproportionate amount of information about a
given topic. The amount and quality of information on a page or web site is valuable in
many ways beyond basic informational uses. Information can be leveraged to yield
prestige, a higher rank, and influence among other websites within the small group on the
web and this may affect or even be the effect of analog networks. In this way, the
authority-hub structure is an informal, self-regulated, self-directed group, based on
information as capital.
2.1.4 Global Parameters: Emergent Attributes of a Complex System
The concept of knowledge capital is similar to “understanding” and “meaning.”
A reader may understand the meaning of a paragraph, an unordered self-similar
compilation of words and punctuation that separately have no emergent meaning or
different individually meanings or which meanings change depending on the
relationships between words. Knowledge capital is an emergent aspect of a complex
system of self-similar units of information. Complex systems are those that do not seem
of entities reacting together and even adapting and learning to be more efficient (Eglash,
1999; Waldrop, 1993). Complexity is the interplay of order and randomness, where a
“balance” of positive and negative feedback can maintain a state of criticality (Eglash,
1999). At this intersection of order and chaos, “at the edge of chaos,” there are system
patterns, but the outcomes are never exactly predictable (Waldrop, 1993).
We move from information theory, where knowledge is comprised of logic-based
rules (Sowa, 2000) and apply this to complex networks to chart how agents interact with
information and how this affects the whole network. Like evolution, in complex
networks agents respond based on decision-making principles, whereby useful rules grow
stronger and unhelpful ones grow weaker, and new rules can be created by combining old
ones. Complexity theories use logic to attempt to explain system-level emergent
phenomena due to the interactions between individuals with simple behavior patterns
(Bonabeau, Dorigo, & Theraulaz, 1999). Emergence is a system state that arises due to
the interdependent relationships among the units of the network (Bar-Yam, 1997; Braha,
2010; Fromm, 2005). It is an aspect of complex systems where random interactions at a
local level develop into attributes that are unlike local relationships and are system
specific.
The dynamics of complex networks are evident in citation networks, social
networks, biological systems and evolution. A collection of self-similar small groups,
which can be comprised of even smaller units, can be part of a self-organizing complex
system. A complex system can include groups with nebulous boundaries that
differentiate them from and join them to larger, embedding systems, such as
contexts is open in that there is an information flux between micro and macro levels, and
no unit is fully and solely situated in a group (Arrow, McGrath, & Berdahl, 2000).
Additionally, the units of the system are affected by random events that reverberate
through all levels of the system (Fromm, 2005). Random effects on a local level can
result in emergent global events that may seem independent of its component parts. In a
feedback loop, these emergent attributes can, in turn, restrict or enable local effects.
Feedback loops create non-linear effects. A small increase or decrease at a local level
can result in big changes at the global level. Over many iterations of a micro-macro
cycle, a complex system with random effects will settle into a global pattern (Fromm,
2005; Vertosick, 2002). This attractor is dependent on the specific contextual parameters
of the system (Arrow, McGrath, & Berdahl, 2000; Bar-Yam, 1997).
In a complex system, global variables emerge from local variables. The global
variables, in turn, affect local variables because global variables are visible to both
outsiders and individual members. Global variables cannot be changed directly but via
local variables through feedback mechanisms (Arrow, McGrath, & Berdahl, 2000;
Fromm, 2005). The global parameters are an important aspect of the network system
because the value of knowledge is defined in large part by established norms and
embedding contexts (Arrow, McGrath, & Berdahl, 2000; Burt, 2005). The global value
of knowledge is based on local units of information given meaning through its dependent
relationship with other units of information in a way that is not cumulative or sequential
(Bar-Yam, 1997; Bates, 2005). A global-level measure of an information network is
knowledge capital. This capital is embedded in the network of exchange as pages of data
be invested and yield economic returns. Knowledge capital is a measureable, emergent
aspect of a network of information that may offer insight into information movement
patterns on networks such as the web.
2.2The Web: A Network Of Strongly Tied, Small-World Groups Connected By
Weak Ties
Linking local and global levels of a system is important for the construction of
good models of complex systems. However, techniques to study social networks are not
robust enough to handle local and system structures. Most research has evaluated strong
ties, directly connected units. However, weak tie studies focus on links between groups
(Granovetter, 1973). Evaluating weak ties, which can be evaluated using network
betweenness measures, links the local and global aspects of the system. Local relations
can be studied as bridges between micro and macro modules that affect global patterns
and in turn affect again small group and individual processes in a feedback loop.
The Web is a complex network of small groups, a unit of which is a strongly-tied
collection of pages that may incorporate a similar topic. Research on groups and group
dynamics have identified different functions of small groups. Groups can be vehicles for
influencing majority and minority members, effecting human interaction and inspiring
member identity. Groups can also be information-processing systems. These groups
include members and their “sociotechnical” systems, which include member tools and
resources (Arrow, McGrath, & Berdahl, 2000).
2.2.1 Homophily
Self-organized groups develop identity by encouraging strong ties and
networks’ small-world structure (Burt, 2005). People tend to cluster around specialized
information which circulates readily within these small-world groups. This strongly tied
structure is formed from dense connections, which can be organized based on perceived
similarities, while some links are not formed because of perceived differences from the
group (Adamic, Buyukkokten, & Adar, 2003; Arrow, McGrath, & Berdahl, 2000).
Homophilous interactions are more likely because the cost of interactions between
strongly tied nodes (those with same social standing) is relatively low, whereas
interaction with weaker ties (heterophilous) requires more effort (Granovetter, 1973).
Homophily on the web might be interpreted as clusters of web pages about the same
subject.
2.2.2 Heterophily
Heterophilous interaction is between actors with dissimilar resources or
information and is less likely to occur, as it requires more work for greater risk of reward.
Actors with fewer social resources may not benefit as much from heterophilous
interaction as actors with a greater number of social resources (Lin, 2001). Causal
dependency relationships can develop between different groups of elements in a complex
network. These dependencies, common in real networks, can create bands of correlation
across hierarchal levels or lateral groups (Fromm, 2005). These frequently unpredictable
interactions between network units can develop emergent characteristics and construct
new components from rudimentary parts, in effect transforming “parts separated” into
“parts joined” (Ashby, 1947). The heterophilous relationships between small groups
2.2.3 Trust, Reputation and Weak Ties
Small-world networks that are complex systems include many strongly tied small
groups which are linked by weak ties. These links are not always “rational” or
necessarily economic in nature. Some are based on emotional, moral or other
nonmaterial exchanges (Homans, 1958). Homophilous exchanges within small-world
groups are marked by strong relationship based on reputation and trust, which are
necessary for group cohesion and accumulation of capital (Burt, 2005; Granovetter, 1973;
Lin, 2001; Wellman, 2002). Burt (2005) defines trust as “when you commit to a
relationship before you know how the other person will behave. Distrust is a reluctance
to commit without guarantees about the other person’s behavior” (93). Implemented by
trust apparatuses, homophilous group structure works as a negative feedback mechanism,
reinforcing normative social expectations. The payoffs can be economic or social, an
accumulation and distribution of reputation (Lin, 2001). Trust apparatus and
homophilous interactions enhance power and influence within social structures.
Weakly tied nodes, on the other hand, are conduits of new information (Burt,
2005). New information from different groups can add stochastic error to the system. As
a tightly connected group increases its weak ties, through increased heterphilous
interactions, the probability of positive feedback in the system increases exponentially.
Both the variation introduced by weak ties and the stabilizing factors of trust and
reputation make this system dynamic.
The relationship between the number of nodes and weak ties in a network reveals
ܸ = ߙ(ܰ)ఉ, where V is the
correlation between performance, a
result of new information, and
network constraints, due to group
norms (Burt, 2005).
Additionally, N is the
number of vectors or links, and α
and β are empirically derived.
Further, α has the following characteristics: it represents the relationship between
network constraints and an actor’s unique information; approaching zero, it represents
weak-tie relationships having no value; and at values greater than zero it is indicative of
more than one actor with unique information. The latter can be understood as hubs or
websites linked to authorities, websites more likely to contain unique information.
Burt’s study on managers at firms produced βthat was negative, indicating that the
benefits of brokerage,or information exchange through weak ties, decreases as groups get
larger. As group size increases, the likelihood of new information increases while group
identity is diluted. Based on empirical studies on complex networks, β may be expected
to be negative, between 2 and 3, depending on network topology and constraints (Albert
et al, 1999; Bennouas, & de Montgolfier, 2007; Braha, 2010; Kleinberg & Lawrence,
2001). When applied to the concepts discussed in this paper, Burt’s (2005) studies
suggest that authority nodes in different networks reveal a relationship that is indicative
of the increased value of weak ties among smaller groups with fewer options for unique
information. Given the same network size, as groups get larger and information is less
unique, the marginal benefit of new nodes decreases. This indicates that weak ties are
more beneficial to tightly bound, small groups. A node with no links has a monopoly on
information and can benefit from weak tie relationships, making coordination with others
more valuable (Burt, 2005).
It is possible for a complex network of information to exhibit a hierarchal
structure. Information flow can result from communication from media to opinion
leaders and then to their constituents. Information is spread more readily through
‘weakly equivalent people’ who may be leaders or are trusted by members of their group
and are also connected to other groups. In this way, these leaders are information brokers
with high bandwidth capabilities (Burt, 2005; Wellman, 2002). However, information
diffusion can decrease because of too few nodes in the system, not enough bridging
connections and too many nodes connected to a central node (Burt, 2005). It is more
difficult for information to spread through sparsely connected networks or those that are
rigidly hierarchal. Hierarchal network structures can diminish the complexity of a
network by both reducing the introduction of novel information and shrinking the
bandwidth by which information can move (Bar-Yam, 2010).
Strong and weak ties are competing yet interdependent parts of a complex system.
Weak ties can create value by increasing variation, while strongly tied members create
value by creating norms and reducing variation. If a small-world group is conceived as a
collection of similar information, by topic or interest, represented by authority pages, the
links from hub to authority pages symbolize trust and reputation, and also represent the
diffusion of information. The interplay of positive and negative feedback mechanisms
the case of websites as vehicles of information, positive feedback might take the form of
new information, such as a fresh news story, and negative feedback has a stabilizing
affect and might be represented by rules, standards and norms adhered to by the small
group. In addition to small, strongly-tied groups, established hub and authority units also
represent trust relationships and work to regulate and normalize the wild, possibly erratic
behavior that new information might have on the node and link patterns of a complex
network. In a complex information system, there is constant interplay between these two
forces: strong ties pulling groups together and into path dependent attractors, and weaker
ties threatening to pull information units apart and into new arrangements. Weak ties
introduce the stochastic error that facilitates the evolution of the network. Like inertia,
negative feedback forces tend to be stronger and stabilizing.
Underlying the pressures of strong and weak ties are the mechanisms of selection
embedded within the system. An important aspect of a complex network is its
self-organizing qualities (Fromm, 2005). Self-organization is a process that results from the
selection of a preferred outcome from a pool of random options (Fromm, 2005;
Vertosick, 2002). Self-organization is a learning process which can result in intelligence
(Vertosick, 2002). For a self-organized network to produce emergent phenomena, the
system must be open and allowing of a transfer of entropy to the larger environment, and
must have attractors sets to which the system can adhere (Fromm, 2005). As a
self-organized network, the web is part of larger social networks of local, national and
international economies, politics and other systems subject to social norms. As an open
patterns of information movement and knowledge capital development which are
impacted by the chaotic nature of this information network.
3. Development of Model and Expectations
In order to conduct this project about 1.5 million web pages with the keyword
“Michael Jackson” were collected from the period between June and Sept 2009 from
WebBase, a Stanford web information research archive that makes monthly web
collections of about 350 websites available for study. These were parsed and stored in a
database. These dates were chosen to extract control data, web pages last modified
before the death of American celebrity and entertainer Michael Jackson 25 June 2009,
and also to capture the development of the network as the news from his death circulated
on the web. Michael Jackson’s death is academically interesting and relevant to this
study of the topology of the web because it is the first event that “broke” the internet
(Rawlinson & Hunt, 2009). At the news of his death, many important sites, including
google.com, cnn.com, and twitter.com and latimes.com, were overloaded and crashed
because of the dramatic increases in visitors searching for updated news. Also, it has
become clear that there will be news stories about the entertainer’s death for some time to
come. Therefore, the time frame during which the story blossomed makes a longitudinal
analysis possible. Although this paper only evaluates a subsample of the network during
the control period, future analysis will incorporate a longitudinal study.
The data were evaluated using descriptive statistics, structural equation modeling,
and network metrics to understand the multilevel relationships between web pages that
share similar information. From these data, the topology of the sample network was
reconstructed and analyzed. In addition to traditional count information necessary for
that are excluded from many statistical analysis. Network analysis contains statistical
information, as well as information about the word distribution, the link structure of each
page and also the way in which each page is situated within the sample network.
Consequently, due to its massive quantity it was not possible to employ all the data used
in the network analysis could not be used in the structural equation modeling treatment.
However, a quantitative evaluation of the network structure has been included in this
discussion. The data sample for the structural equation modeling procedure necessarily
excludes in-bound link information because these are not available on web pages, but
only available as links to other pages in the sample network. It is only possible to know
the in-bound links from pages that are in the sample network, and there are very few
pages with this information available in a web sample. Using a variable with such a large
number of missing data in statistical evaluation would make the calculation both more
complex and less meaningful. Although the in-links were excluded from the structural
equation model, this information was captured in certain measures that include this
information. When evaluating networks on the web, researchers can never see the
network in its entirety. In the same way that we can only infer the number of in-bound
links to a page, based on the out-bound links in our sample, we can only evaluate and
measure parts of the web, due to its rapidly changing nature and because much of the web
is private and therefore not accessible. The topology metrics, betweeness and centrality
were included because they are calculated using in-link counts. Additionally, the graph
necessarily includes this information. Although the model employs traditional statistical
techniques, it also includes network information about how the units of the model are
previous literature, it is expected that the total number of words, the number of topic
words, and the number and type of links at many network scales and time periods will be
power law distributed, an artifact of its complex nature (Adamic, 2008; Albert &
Barabasi, 2002). This paper employs traditional statistical measures for testing theories
about the topology of the web and also uses network analysis to understand and evaluate
the topology of the web without the unrealistic assumptions of normality, non-correlated
errors and continuity made by traditional statistical techniques.
3.1 Parsing Specifications and Metric Creation
Specific content of the collected webpages was parsed to extract specific metadata
from the downloaded page, including date modified/published, url, number of times the
term "Michael Jackson" or "Micheal Jackson" (misspelled) appeared on the page, the
number of words contained within HTML paragraph markers (<p></p>), the total
number of outbound links on the page, and the number of unique links on the page.
Javascript was excluded from the data. The term-count processing was case-insensitive.
The parser was written in Perl programming language and the data was stored in a
relational database (MySQL) on a UNIX operating system for further processing.
In addition to the previously mentioned variables, three other variables were created.
The domain variable was derived from the url (using the Perl parser) to be used as a
website level (higher-level) identifier. Network topology measures, centrality and
betweeness, were calculated after the sample network was created by Pajek (Figure 5).
Once the random sample was created, it became possible to identify in-bound links and to
to Node XL (an add-on to Excel, Microsoft spreadsheet software), where centrality and
betweeness were calculated. These measures were also stored for use in MySQL.
3.2 Description of Variables
In order to evaluate the topology of the network, a subsample of the web crawl of
pages modified prior to June 25, 2009 was evaluated by quantitative analysis.
Specifically, a web page was the smallest unit of analysis, where the variables are the
number of occurrences of keywords, ‘Michael Jackson’ or ‘Micheal Jackson’ appears on
a page (mjcntpp) (Appendix: Figure 11); the total number of words in the copy of the
page (this does not include title or metatags) (wordcntpp) (Appendix: Figure 12; the
number of links originating from the page within the subsample of pages modified prior
to June 25, 2009 (outdegree) (Appendix: Figure 3); and the count of different out-bound
links on a page as measured from the larger sample of web data, which was collected
over a four month period (numofuniquelinks) (Appendix: Figure 10). It is possible for
numofuniquelinks to be higher than the outdegree variable, which was derived from the
subsample of 1952 pages. Like, numuniqelinks, ttllinkspp (Appendix: Figure 13) was
also tallied from the larger web sample. The variable, ttllinkspp is the total number of
hyperlinks, including multiple links to the same page, in the larger sample. Also
quantified were network variables describing the location of the page in relationship to
others in the sample, betweeness and centrality. The betweeness measure is the
probability that a shortest path connecting two nodes passes through a given node
(Appendix: Figure 9). Pages that are on many shortest paths (shortest path from one node
to another) have high betweeness metrics: ܤ = ∑(ܵ௧ (݆, ݅)) ⁄ ܵ(݆, ݅) , where ܵ௧(݆, ݅) is the
node t and ܵ(݆, ݅) is the number of shortest paths between j and i (Braha, 2010). Pages
with high betweeness metrics are located amongst many weak-ties and may have an
increased ability to facilitate the flow of information through a network. The centrality
score is actually the network closeness centrality measure. It is an average of the shortest
distance between a given node and all other nodes reachable from its place in the
network. It is calculated using in- and out-bound links. ܥ(ݐ)݅݊ = ∑ 1/(݀(ݐ, ݐ)) and
ܥ(ݐ)௨௧ = ∑ 1/(݀(ݐ, ݐ), where d of tj and ti is the distance between a pair of nodes
(Braha, 2010). Based on the hypothesized movement of information through networks,
high centrality scores may be linked to the importance or authority of a page. Given the
assumption that information moves through a network using paths requiring the smallest
expenditure of energy, centrality measures such as betweeness and closeness may be
network proxies for trust and reputation. At the node level, a high measure of centrality
(Appendix-Figure 4), can represent influence over other nodes in the network (Braha,
2010). These metrics can be used to estimate the amount of influence any node may have
in the context of information flow within a small-world network (Figure SEM Model 1).
3.3 Sample Description
Of the pages downloaded (over a four month period, from June –September 2009)
and parsed, a random sample of pages with modification dates prior to 25 June 2009, the
date of Michael Jackson’s death, was extracted. The subsample for the structural
equation model consists of 1952 web pages. The cases in the model are the vertices for a
randomly created network. The subsample for the network metrics is comprised of 1795
edges and 1694 nodes. The network graph contains all the vertices of the subsample used
duplicate records (a page may be counted as linking more than once to another page).
Although multiple links to the same page are not depicted in the network graph, this
information is captured in the metrics in the total number of out-links in the larger sample
(ttllinkspp) and the total number of out-degrees per page (outdegree) in the subsample.
The descriptive statistics were produced by R version 2.7.2 (a broad application open
source statistics program), the structural equation modeling was performed by the student
version of AMOS 5.01 (a statistical program for structural equation modeling),
betweeness and centrality metrics were generated by Node XL, version 1.0.1.112. The
network graph and other network measures were generated using Pajek 1.23 (a network
analysis program). MATLAB, version R2010a (a broad mathematics application) was
used to determine the fractal dimension of the network graph created.
3.4 Measurement Description
The condition of a web page being a hub or an authority will also be affected by
its location on the network. Assuming that some web pages are better positioned in the
network to broker information, pages with a given degree attribute (the number of in- and
out-links) may have access to more or less knowledge capital. Additionally, the ability of
a page to facilitate the movement of information may be represented by measures of
betweeness, centrality, the number of keywords on the page (mjcntpp) and the number of
links originating from the pages in the subsample (outdegree) (Figure SEM Model 1). In
these models, a page’s brokering abilities is a latent endogenous variable indicated by the
topology of the network (betweeness, centrality, mjcntpp, outdegree). The same
analogies can be made for network authority (also a latent endogenous variable), where
(wordcntpp), and centrality and betweeness measures. The total links per page from the
larger sample of downloaded data (ttllinkspp) and the number of different out-links per
page (numuniquelinkspp) are conjectured to be manifestations of the endogenous latent
variable knowledge capital. Authority, broker and knowledge capital constructs are all
correlated, authority and broker attributes being affected by variables on the subsample
scale. The built-in interdependence of the variables due to the complexity of the network
violates the statistical assumption of independence. The inherent non-normality of
complex networks can be accommodated using log transformations of variables or
bootstrapping techniques which are not distribution dependent (Kline, 2005; Arbuckle,
2003). This paper uses a bootstrapping technique to circumvent the limitations of
non-normality and test the models based on specific distributions of the subsample.
3.5 Authority-Hub
The complexity of the network necessitates analysis at a higher level construct,
where small-world groups are the unit of analysis. The data from the crawl were used to
identify units of small-world groups consistent with Kleinberg’s authority- hub model of
the web. The word distribution and the number of in-links (indirectly) and out-links were
used to determine clusters of web pages, or small communities of information. These
groups were conceptualized as either authority web pages or hub web pages. The former
being pages that have both a disproportionate number of occurrences of the topic word
and more in-bound links; the latter being web pages that have a disproportionate number
of out-bound links. Depending on the topic and characteristics of the groups of web
pages, there may be more tightly or loosely connected pages that comprise a small-world
3.6 Structural Equation Models (SEM)
Confirmatory factor analyses with double loadings were performed using a
bootstrapped Maximum Likelihood technique. These were evaluated to understand the
relationships between variables representing different scales in the network, the random
subsample and the larger sample of webpages. SEM is a method by which theories about
how complex relationships specified in the form of covariance matrices can be tested.
SEM combines confirmatory factor analysis and regression techniques to analyze the
intercorrelations between observed indicators and latent constructs (Schreiber et al,
2006). Good SEM structural specifications of these models will be similar to the data
about the network as determined by the chi-square (χ2) test and other fit indices. Models
that sufficiently describe the variances in the subsample will tend to have low chi-square
scores (non-significant) because the sample distribution is not significantly different from
the model being tested, and also have high fit metrics (significant) (Schreiber et al, 2006,
Tabachnick & Fidell, 2007). Significance tests, however, may be less important in
structural equation modeling, due to their higher level perspectives and relatively large
sample size (Kline, 2005). Unlike other statistical techniques, SEM permits the testing of
the theoretical models discussed herein.
The local topology of the network and the relationships between nodes can be
mapped to emergent parameters of the network at large. The nature of many complex
systems is such that there are no linear relationships that accurately describe much of the
data. For example, knowledge is not linearly accumulated. Based on Kuhn’s ideas of
paradigm shifts, there is a gradual accumulation of knowledge, a phase transition period
paradigm shift that dramatically increases our knowledge base (Kuhn, 1962). For this
reason, variation in a complex network might better be understood using SEM, a method
that permits complex relationship testing. The means and covariances of the observed
and latent variables will be traced to identify relationships between local variables and
unobserved emergent parameters (latent variables). There are some important
assumptions of this model that are restrictive in the study of complex networks.
Networks change over time and are discontinuous, non-linear and representative of
relationships between nodes. Therefore, they may also violate assumptions of univariate
and multivariate normality as well as the independence of errors assumptions that buttress
most statistical calculations.
3.6.1 Identification
Although a non-recursive SEM model may allow for the feedback relationship
between variables, the models tested in this paper are recursive, due to the issue of
identification. For example, characteristics of a webpage, such as keyword counts and
out-degree, can be interpreted as predictors of authority-ness or hub-ness variables. In a
feedback loop, authority-ness and hub-ness can be used to describe the emergent
characteristic of knowledge capital, and are also affected by knowledge capital. In the
models, these relationships are represented as correlations, instead of two unidirectional
arrows, because of the cost in degrees of freedom and the likelihood of non-identification
(Figure SEM Model 1 and Model 2). Additionally, many of the observed variables
would be expected to affect other observed variables. For example, the measure of
betweeness, the number of out-links, and the amount of copy on a page may all affect one
between the latent variables and double-loadings, due to the limitations of identifiability
and lack of degrees of freedom in the data sample.
Given a certain number of variables, there are a specific number of unknowns that
can be calculated. Beyond that amount, the model is underidentifiable. In these models,
there are 7 observed variables, and therefore 28 unique units of information available.
The oblique models, where the AB correlation is unrestricted, estimate 21 parameters,
while the model that assumes no direct relationship between authority and broker-latent
variables (AB=0) estimates 20 parameters. The number of unknowns, however, is not the
only information necessary to determine identifiability. Each latent variable must have at
least 2-3 observed variables and have a scale metric, where a path to an observed variable
is set equal to 1 (Kline, 2005). Alternatively, without a scale fixed to 1, the variance of
the latent variable can be set to 1, creating a z-score type metric (Ware, 2010). Even if a
model is theoretically identifiable, a model may still be underidentified if there is high
multicollinearity amongst the variables. For example, two highly correlated variables do
not offer two unique pieces of information. Instead, together they may only offer one
piece of information (Kline, 2005). As discussed previously, some of the variables in the
model have correlations greater than 60%. The issue of identifiability was an issue that
4. Results and Discussion
4.1 Content Analysis
The sample was screened for univariate and multivariate skewness and kurtosis.
The content analysis for each page includes the number of topic word occurrences, total
number of words, and the number of out-bound links. These provided the frequency,
direction (in- and out-links) and intensity or strength of a message based on a chosen
topic word. Descriptive statistics for each variable in the collection were generated. Of
these variables, the range identified the scope; the median and mean indicated central
tendencies of the samples; the standard deviation was a measure of variability within the
samples; and the skewness or possible kurtosis were also important statistics for variables
that are assumed to be Gaussian-distributed, due to reliance of statistical techniques on
the central limit theorem. For the
subsample, the mean betweeness score
was 0.114, centrality score 6.101, the
average word count was just above 700,
‘Michael Jackson’ appeared a little more
than twice, and there were about 20
out-links on the average web page. In the
larger sample, there were an average of
186 out-links per page and of those, 87
were different.
When evaluating networks, distributions are rarely normal. In fact, descriptive
statistics are not always useful in describing the non-continuous and broken shapes that
0 500 1000 1500 200
0 50 100 150 200 250 300 350
Inde mahal
may comprise a network. This sample is representative of a network of information in
that none of the variables are normally distributed (Figure Distribution matrix).
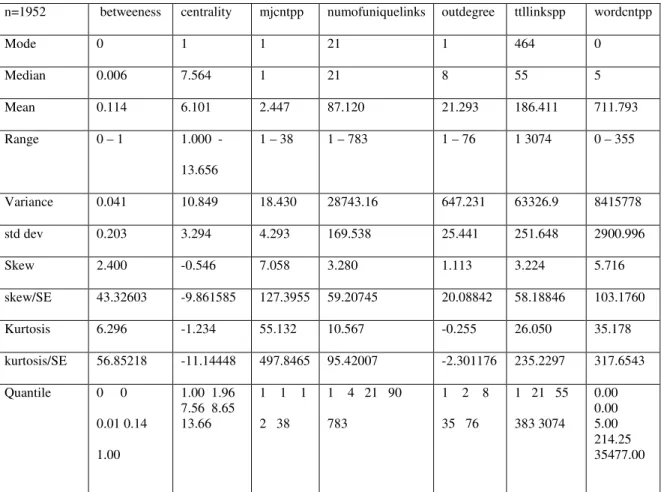
Table 1: Descriptive statistics
As expected, much of the data in the first sample are highly positively skewed and very
leptokurtic (Table Descriptive statistics). There were more than 100 cases that were
outliers based on Mahalanobis critical values of 26.124 (0.00l, 8), 27.877 (0.00l, 9),
18.46683 (0.001, 4), and 20.51501 (0.001, 5) for Models 1, 2, 3 and 4, respectively
(Figure Maholanobis). These were not removed from the analysis because they may not
be “outliers” in the network.
Skewness values normalized by a skewness standard error of 0.055 were greater
than 20 for all variables, except the centrality metric, which was largely negatively
n=1952 betweeness centrality mjcntpp numofuniquelinks outdegree ttllinkspp wordcntpp
Mode 0 1 1 21 1 464 0
Median 0.006 7.564 1 21 8 55 5
Mean 0.114 6.101 2.447 87.120 21.293 186.411 711.793 Range 0 – 1 1.000 -
13.656
1 – 38 1 – 783 1 – 76 1 3074 0 – 355
Variance 0.041 10.849 18.430 28743.16 647.231 63326.9 8415778 std dev 0.203 3.294 4.293 169.538 25.441 251.648 2900.996
Skew 2.400 -0.546 7.058 3.280 1.113 3.224 5.716
skew/SE 43.32603 -9.861585 127.3955 59.20745 20.08842 58.18846 103.1760 Kurtosis 6.296 -1.234 55.132 10.567 -0.255 26.050 35.178 kurtosis/SE 56.85218 -11.14448 497.8465 95.42007 -2.301176 235.2297 317.6543 Quantile 0 0
0.01 0.14 1.00
1.00 1.96 7.56 8.65 13.66
1 1 1 2 38
1 4 21 90 783
1 2 8 35 76
1 21 55 383 3074
skewed (-9.862). Kurtosis values normalized by a standard error of 0.111 suggest highly
leptokurtic distributions for variables: betweeness, numofuniquelinks, mjcntpp,
wordcntpp, ttllinkspp. The variable outdegree has a heavy tailed distribution, although a
negative kurtosis measure may seem to indicate otherwise (Figure Out-Link). The
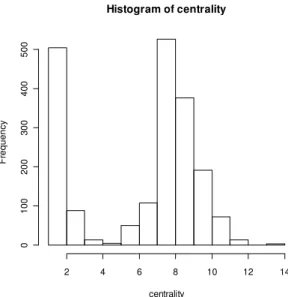
centrality metric also has a negative kurtosis metric of less than -11.144, although it has a
bi-modal distribution (Figure Centrality). All of the variables in the sample are
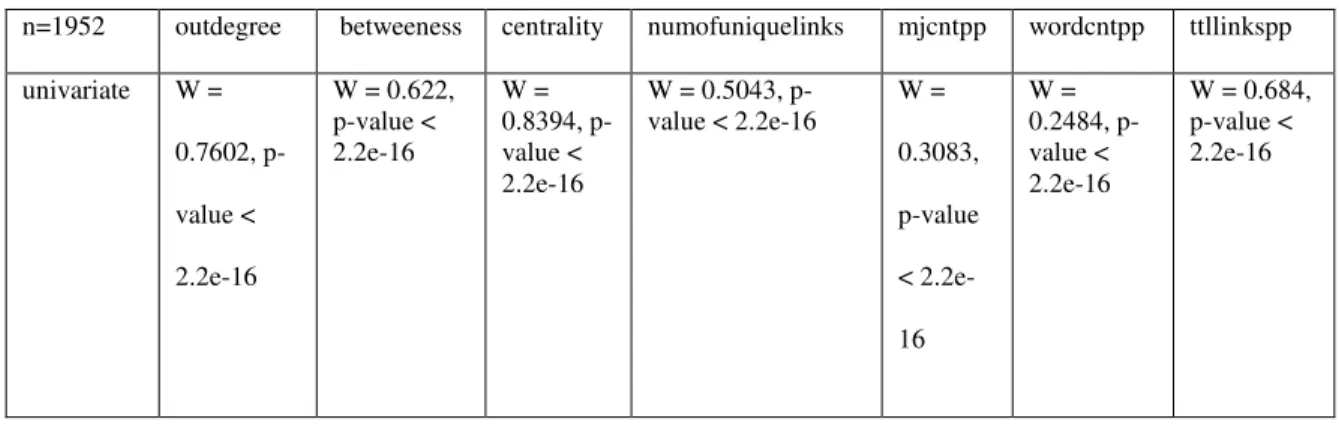
significant at the 0.001 level for the Shapiro-Wilk normality test, indicating univariate
non-normality, which would imply multivariate non-normality (Table Normality).
The total number of words, number of topic words, and out-links in this sample
are power-law distributed. Consequently, the observed variables, outdegree, betweeness,
numofuniquelinks, mjcntpp, wordcntpp and ttllinkspp were tested using a bootstrap
method to circumvent the assumptions of normality. The bootstrapping technique
transformed the data to match the model and generated random samples from that data to
generate the p-score of the χ2 distributions (Ware, 2009).
Figure 3: Distribution of outdegree Figure 4: Distribution of centrality
Histogram of outdegree
outdegree
F
re
q
u
e
n
c
y
0 20 40 60 80
0
2
0
0
4
0
0
6
0
0
8
0
0
Histogram of centrality
centrality
F
re
q
u
e
n
c
y
2 4 6 8 10 12 14
0
1
0
0
2
0
0
3
0
0
4
0
0
5
0
Table 2: Univariate normality
n=1952 outdegree betweeness centrality numofuniquelinks mjcntpp wordcntpp ttllinkspp univariate W =
0.7602, p-value < 2.2e-16
W = 0.622, p-value < 2.2e-16
W = 0.8394, p-value < 2.2e-16
W = 0.5043, p-value < 2.2e-16
W = 0.3083, p-value < 2.2e-16
W = 0.2484, p-value < 2.2e-16
W = 0.684, p-value < 2.2e-16
4.2 Correlation
The univariate descriptive statistics offer a basic statistical outline of the data
from the crawl. However, information about complex networks with emergent
characteristics exhibit causal relationships between the nodes of the network. Pearson’s
correlations were evaluated to understand the degree to which some variables change in
relations to others. Although correlation does not imply causation, it may indicate some
underlying relationship that is expressed in the network topology (Table Variable
Correlation).
Table 3: Variable Correlation
The number of out-links (outdegree) and the betweeness of the web page in the
network are highly correlated. Each variable can explain 63.9% of the variation in the
other. This is expected because betweeness is the probability that the shortest path
between random two nodes passes through a given node. The number of out-links on a
page is highly correlated with it being located in a position important to the diffusion of
information on a network. There was high correlation between the number of words in
the copy of the page and the betweeness measure. Also of note was the strong
relationship between out-degree and the number of unique links on a page (59%),
numofuniquelinks and the total links on a page (ttllinkspp) were very highly correlated at
greater than 70%. These values can be expected from this sample. The ability to broker
information, may be related the number of out-links and the number of words on a page.
Also, the total number of links on a page, both from the small sample from which this
data was prepared and from the larger sample taken from the WebBase site, would be
expected to be related to the number of different links on the page. The number of
unique links on a page (numofuniquelinks) would represent the diversity of other pages to
which a link points. Interestingly, the betweeness measure explains about 50% of the
variation in the number of words in the copy of a page. Based on the literature, one
might also expect the number of words on a page to be correlated with the authority of a
4.3 Network Metrics
Unlike traditional statistics techniques that assume univariate and multivariate
normality, network analysis introduces measures more appropriate for charting the
dynamics of a complex network.
Network topology is important to
understand the dynamics of a complex
network (Bar-Yam, 2010). Some
important measures at network and
group levels include density,
robustness and path length. Network
density is the proportion of links in the
network to the number of links possible
in the network (Braha, 2010). Although the density of a network decreases as the
network increases networks tend to develop connections over time and become more
dense. Path length is the shortest distance connecting any two nodes in the network.
Perhaps due to evolutionary fitness, many real networks that are scale-free are robust to
random failures, but are more affected by the removal of highly correlated nodes and
specific links (Braha, 2010). The density of the subsample network is 0.0006802,
indicative of a relatively sparse network; 0.068% of all possible links are expressed in the
network. The giant component is comprised of 1081 vertices and 1279 directed edges;
64% of the nodes are connected (Table Node distribution per cluster). As expected, most
nodes of the subsample are part of the giant component that is expected to develop in
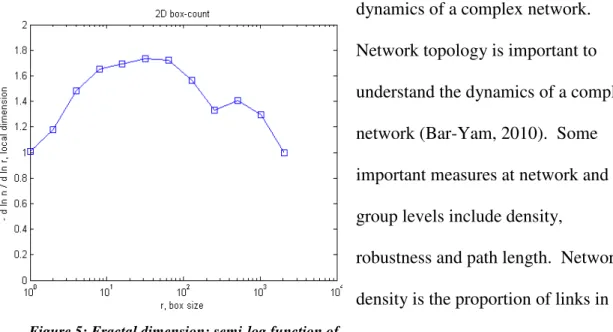
networks of multiple levels. The diameter of the network, or the maximum shortest path Figure 5: Fractal dimension: semi-log function of
from one vertex to another in the network, is 19; it takes 19 hops (via hyperlinks) to get
from a web page on one end of the network to a web page on the other. The average
geodesic distance (the average shortest path) is a short 8.75 hops. The average number of
links per node is 2.119.
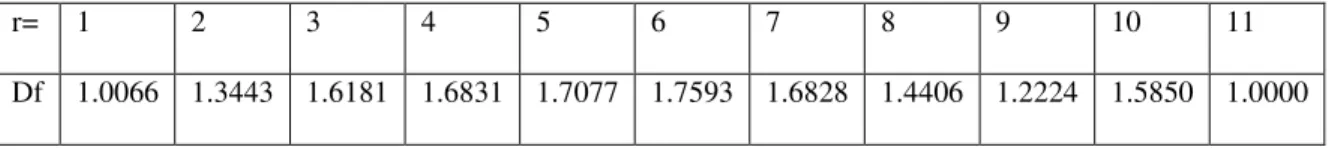
Table 4: Fractal dimension given box size r
Another metric that characterizes the complexity (as a measure of roughness and
complexity) of macro-level attributes of a self-similar, complex network is fractal
dimension, which was calculated using the box-counting method (Figure Fractal
dimension: semi-log function of subsample). Fractal dimension is obtained by counting
the number (n) of boxes of size r necessary to cover the entire network graph:
ܦ݂ = −݀(݈݃(݊))/݀(݈݃(ݎ)) (Moisy, 2008). The most constant fractal dimension is Table 5: Node distribution per cluster
--- Dimension: 1694
Cluster Freq Freq% CumFreq CumFreq% Representative --- 1 1267 74.7934 1267 74.7934 www.chicagomag.com
2 241 14.2267 1508 89.0201 chicagotribune.p2ionline.com 3 57 3.3648 1565 92.3849 www.apartments.com
4 28 1.6529 1593 94.0378 http://www.chicagotribune.com/news/opinion/..6170046.htmlstory 5 11 0.6494 1604 94.6871 www.theyard.com
6 14 0.8264 1618 95.5136 http://www.chicagotribune.com/..7291221,print.htmlstory 7 6 0.3542 1624 95.8678 www.latimes.com
8 10 0.5903 1634 96.4581 http://www.chicagotribune.com..6852982..la-et-joey-rory-photo 9 5 0.2952 1639 96.7532 http://www.chicagotribune.com..20090616190644
10 3 0.1771 1642 96.9303 http://www.wired.com/autopia/2008/09/say-it-aint-so/ 11 2 0.1181 1644 97.0484 detroit.metromix.com
12 4 0.2361 1648 97.2845 www.pluck.com 13 3 0.1771 1651 97.4616 www.usatoday.com
14 5 0.2952 1656 97.7568 http://www.asanet.org/footnotes/mayjun09/announce_0509.html 15 1 0.0590 1657 97.8158 http://digital.library.upenn.edu/women/truth/1850/1850.html 16 3 0.1771 1660 97.9929 circularcentral.shoplocal.com
17 7 0.4132 1667 98.4061 www.zap2it.com
18 1 0.0590 1668 98.4652 http://www.well.com/user/jmalloy/blueskies/calartists1.html 19 3 0.1771 1671 98.6423 www.facebook.com
20 6 0.3542 1677 98.9965 search.marketplacedetroit.com 21 4 0.2361 1681 99.2326 www.cars.com
22 2 0.1181 1683 99.3506 del.icio.us
27 1 0.0590 1684 99.4097 http://www.ornl.gov/sci/ees/pes/publications.html 29 1 0.0590 1685 99.4687 http://www.cl.cam.ac.uk/~lp15/papers/workshop.html 30 1 0.0590 1686 99.5277 http://www.albany.edu/..vwindex.html
35 1 0.0590 1687 99.5868 http://www.earlham.edu/~peters/fos/2009_02_15...html 41 1 0.0590 1688 99.6458 http://www.cl.cam.ac.uk/~fms27/
44 1 0.0590 1689 99.7048 http://www.research.att.com/~pamela/bio.html 46 1 0.0590 1690 99.7639 http://www.research.att.com/~pamela/mps.html 68 1 0.0590 1691 99.8229 http://www.research.att.com/~pamela/fre.html
70 1 0.0590 1692 99.8819 http://www.uiowa.edu/be-remarkable/portfolio/people/index.html 72 1 0.0590 1693 99.9410 http://www.research.att.com/~pamela/dfc.html
76 1 0.0590 1694 100.0000 http://www.vanderbilt.edu/AEA/students/Programs_name.htm ---
Sum 1694 100.0000
r= 1 2 3 4 5 6 7 8 9 10 11
between box sizes 3 and 7 and is 1.6902 +/- 0.050934. Over time, the fractal dimension
might be expected to increase and approach 2 dimensions as more connections link the
nodes and the network develops.
As previously mentioned, metrics describing group level variables were evaluated
and included in the structural models. These include betweenness and centrality. In
describing the movement of information through networks, the location and group
connectivity of nodes are important. At the node level, a high in-degree, or a high
measure of centrality, can represent influence over other nodes in the network. In
addition, nodes that have short path lengths to a large numbers of nodes, or high
betweenness measures, tend to have the ability to broker the flow of information.
Clustering is a measure of local cohesiveness or density, where the likelihood that any
given node’s neighbors are also linked to the node (Braha, 2010). The higher the
clustering coefficient, the higher the probability that two neighbors of a node are
connected. These metrics also explain relationships across levels. For example, a small
world network is characterized by micro and macro qualities, having short path length
and high clustering coefficient (Watts & Strogatz, 1998). In this subsample of 1267, 74%
of nodes are in one giant cluster, the next largest cluster has a little more than 14% of the
nodes, followed by a smaller cluster with 3.4% of nodes (Table Node distribution per
cluster).
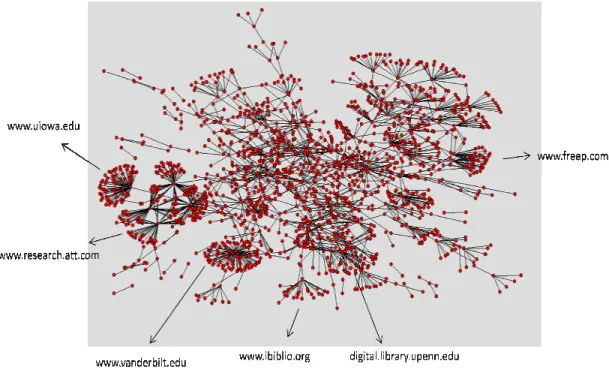
4.4 Network Graph
To visualize the relationships between web pages beyond the scope of statistics, I
created a network map of the subsample, using Node XL software. This network graph
This chart can be used to visualize
dynamics and network density at multiple scales
dynamic relationships of the units of
sets, thereby creating a chart of a possible search topic and all of its related
and patterns on the web.
example, out-links from ww
www.ibiblio.org, www.digital.library.upenn.edu, and
sample.
Figure 6: Network graph edges=1795, nodes=1694
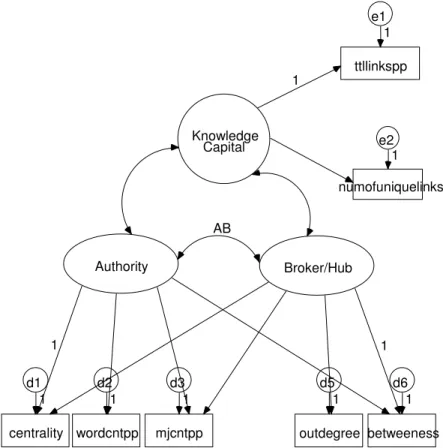
4.5 Structural Equation
The first model tested was o
covary freely; that is, AB was not fixed
knowledge capital, authority and broker types. The indicators for knowledge capital were
the total links per page and the number of unique links per page
s chart can be used to visualize multi-dimensional interactions, such as clustering
dynamics and network density at multiple scales. This type of model can describe the
relationships of the units of data at different levels and help to identify
thereby creating a chart of a possible search topic and all of its related
. In this subsample, there are visible clusters that emerge. For
www.uiowa.edu, www.research.att.com, www.vanderbilt.edu
digital.library.upenn.edu, and www.freep.com are prevalent in the
: Network graph edges=1795, nodes=1694; clusters with originating domains
quation Models
The first model tested was one of three latent variables that were assumed to
; that is, AB was not fixed (Figure Model 1, Table Covariance
knowledge capital, authority and broker types. The indicators for knowledge capital were
the total links per page and the number of unique links per page, with the former such as clustering
can describe the
identify attractor
thereby creating a chart of a possible search topic and all of its related pages, topics
In this subsample, there are visible clusters that emerge. For
www.vanderbilt.edu,
are prevalent in the
; clusters with originating domains
ne of three latent variables that were assumed to
, Table Covariance). These were
knowledge capital, authority and broker types. The indicators for knowledge capital were
providing the scale. The authority and broker variables shared both centrality and
betweeness indicators, as these network measures were hypothesized to affect the
influence of a page on other pages. Authority’s unique indicators were keyword
(mjcntpp) and total word count (wordcntpp). Its metric was scaled by the centrality
variable. In addition to betweeness, which provided the scale, the number of outlinks per
page as counted in the smaller sample were the indicators for the broker variable.
Although the χ2 was significant, usually indicative of a poor fit, this may be due to the
large sample size, which tends to make significant results unlikely. Judging by other
measures, however, this model describes the variance in the dataset well (χ2 [8, N=1952]
= 31.28, p<0.000; NFI=0.993; RFI = 0.982; IFI = 0.995; TLI = 0.987; CFI = 0.995;
RMSEA = 0.039, p = 0.894 at the 0.05 level; AIC = 85.278). Good-fit indicators are a
nonsignificant χ2 score (less than a critical value), and GFI, NFI, RFI, CFI and TLI ≥
0.95 and RMSEA < 0.06 at the 0.05 level (Schreiber, et al, 2006). The covariances
between knowledge capital and authority, and authority and broker were not significant
in Model 1.
The second model was a nested model of the first, where the relationship between
authority and hub factors was hypothesized to be zero. That is, the covariance AB was
set to zero, making their relationship orthogonal. Here, the assumption that authority and
hub pages are completely independent and do not influence each other at all. Although
we gained a degree of freedom with this more constrained model, this model produced a
Figure 7: SEM Model 1 (AB=free) and Model 2 (AB=0)
Table 6: Maximum Likelihood Estimates
Regression Weights: (Group number 1 - AB free)
Estimate S.E. C.R. P Label
numofuniquelinks <--- Knowledge_Capital .735 .023 32.611 *** par_2 centrality <--- Authority 1.000
wordcntpp <--- Authority 8805.701 3489.331 2.524 .012 par_5
mjcntpp <--- Authority -.089 .405 -.220 .826 par_6
outdegree <--- Broker/Hub 136.604 22.633 6.036 *** par_7 betweeness <--- Broker/Hub 1.000
ttllinkspp <--- Knowledge_Capital 1.000
centrality <--- Broker/Hub 3.998 .720 5.554 *** par_8 betweeness <--- Authority 2.644 1.739 1.520 .128 par_9
mjcntpp <--- Broker/Hub 2.334 .771 3.030 .002 par_10
Knowledge Capital
Authority Broker/Hub
mjcntpp wordcntpp
centrality outdegree betweeness
numofuniquelinks e2
1
1 1
d1 1
d2 1
d3 1
d5 1
d6 1 ttllinkspp
e1 1
1