Brooks J. Breece. Local Government Use of Web GIS in North Carolina. A Master‘s Paper for the M.S. in L.S degree. November, 2010. 97 pages. Advisor: Dr. Stephanie W. Haas
This study examines the use of online geographic information systems (GIS) by North Carolina county governments. The study was conducted to investigate what web GIS services North Carolina counties offer, to determine how much these services are used and by whom, and to uncover how offering these services has impacted agency
functioning. The counties examined were Wake County, Lee County, Guilford County and Robeson County.
Methods employed over the course of the study included analyzing trends in web traffic statistics and interviewing staff members of participating agencies to uncover
organizational changes occurring post-deployment of a web GIS. Trends in web GIS use were not consistent across counties. The chief impact of offering a web service was a decrease in walk-in traffic to agencies. This has freed up staff members to work on other projects. Employees also have taken on new roles as technology educators for web GIS users.
Headings:
Geographical information systems.
by
Brooks J. Breece
A Master‘s paper submitted to the faculty of the School of Information and Library Science of the University of North Carolina at Chapel Hill
in partial fulfillment of the requirements for the degree of Master of Science in
Library Science.
Chapel Hill, North Carolina November 2010
Approved by
Table of Contents
List of Tables ... 3
List of Figures ... 4
Introduction ... 5
Literature Review ... 6
The Advent of Geobrowsers and the Geospatial Web ... 6
Rise of E-Government: A Sea Change in Service Provision and Citizen-Government Interaction... 20
Impacts of e-Government: Organizational Co-evolution and Concerns over Privacy and Social Equity ... 27
Significance ... 30
Methods ... 31
Participants ... 31
Metrics ... 32
Interviews ... 32
GIS in North Carolina ... 33
GIS in Wake, Lee, Guilford and Robeson Counties ... 39
Wake County ... 40
Lee County ... 41
Guilford County ... 42
Robeson County ... 42
The location of GIS in local government ... 42
Wake County Geographic Information Services ... 42
City of Raleigh GIS ... 43
Study Findings ... 45
Web Applications ... 45
Lee County ... 51
Guilford County ... 53
Robeson County ... 56
Analysis of website traffic... 58
Wake County and City of Raleigh ... 58
Lee County ... 62
Guilford County ... 63
Robeson County ... 64
Changes to organization ... 65
The impetus ... 65
Impact on staff ... 67
Impact on users ... 70
Changes to human and physical resources ... 71
Cooperation with other agencies ... 74
Future directions ... 74
Discussion and Summary ... 75
Variation in website complexity ... 78
Obscuring of real world political boundaries ... 79
Limitations ... 81
References ... 82
Appendix A: Glossary of Acronyms ... 90
Appendix B: EMAIL SOLICITATION ... 92
Appendix C: INFORMATION SHEET / CONSENT FORM... 93
List of Tables
Table 1 Federal Interactive Mapping ... 13
Table 2 Tracking ARRA funding cartographically ... 14
Table 3 State-level Interactive Mapping ... 15
Table 4 Local government Interactive Mapping ... 17
Table 5 WMS applications in the developing world ... 18
Table 6 Characteristics of Agencies Studied and Data Collected ... 40
Table 7 Demographics of North Carolina and the Examined Counties ... 40
Table 8 Other location of GIS services in study area ... 44
List of Figures
Figure 1: DocSouth ―Going to the Show‖ ... 8
Figure 2: Georeferenced Sanborn Map ... 8
Figure 3: Google Earth ... 10
Figure 4: Pop-up in Google Earth ... 11
Figure 5: National Renewable Energy Laboratory (NREL) OpenPV Visualization ... 14
Figure 6: Colorado Economic Recovery Mapping ... 15
Figure 7: City of Boston GIS Data Hub ... 17
Figure 8: Abu Dhabi Geospatial Portal ... 18
Figure 9: CitySourced... 19
Figure 10: North Carolina Department of Administration website ... 36
Figure 11: Other NC county web GIS sites ... 37
Figure 12: NC municipal web GIS sites ... 38
Figure 13: Counties examined ... 39
Figure 14: ―Old‖ iMAPS ... 47
Figure 15: Wake County Register of Deeds website... 48
Figure 16: The ―new‖ iMAPS web application ... 48
Figure 17: Downtown Raleigh (the North Carolina Executive Mansion selected) ... 50
Figure 18: iMAPS pop-up (North Carolina Museum of History selected) ... 50
Figure 19: Lee County‘s web GIS ... 52
Figure 20: Downtown Sanford (historic Railroad House Museum selected) ... 52
Figure 21: Guilford County Data Viewer ... 54
Figure 22: The University of North Carolina at Greensboro ... 55
Figure 23: Guilford County. Flood Zones, Detailed Soils and Streams Layers On. ... 55
Figure 24: Robeson County‘s web GIS ... 57
Figure 25: A Robeson County parcel selected ... 57
Figure 26: Lumberton. County Zoning Layer ... 57
Figure 27: Unique Visitors to iMAPS site ... 59
Figure 28: Visits to /imaps/map.asp ... 60
Figure 29: Views of /imaps/maps.asp ... 61
Figure 30: New iMAPS web traffic... 61
Figure 31: Lee County Connect GIS web traffic... 62
Figure 32: Guilford Data Viewer: Visits ... 63
Figure 33: Robeson County ConnectGIS: Visits... 64
Figure 34: Wake County Walk-In Customers and Telephone Calls ... 66
Introduction
The advent of widely available and easy-to-use online, geographic information
systems (GIS) and geovisualization tools has changed ways users interact with
information (Arsenault 2007, Schoning 2008, Aucott et al. 2009, Jessop 2005, Scharl
2007). The georeferencing or geotagging of digitized materials, or assigning geospatial
location information to items, has led to new ways of querying and analyzing data
collections – such as earthquake records, news reports and crime records. Other uses of
interactive maps as access tools for quick data visualization include patrons viewing
archival materials or remotely tracking in real-time disaster relief efforts through updated,
online maps of the crisis area infused with multimedia (Solar 2005, ESRI 2010). State
and local governments – who increasingly have offered electronic government services including online voter registration, driver‘s license renewal and tax filing – also are using
web mapping technologies as methods of allowing remote browsing of and access to
digitized or digital government records.
For users of local government GIS systems, one of the chief uses of web mapping
services (WMS) is to view cadastral data about parcels of land. Interactive, web mapping
interfaces allow users to zoom and pan through the digital rendering of a terrain, select
parcels and view information on ownership, mailing address, deed date, deeded acreage,
This study investigated how the offering of these data-sharing e-government
services through a map interface linked to or housed on a government agency‘s website
leads to some organizational reorientation of the agencies. The local government
agencies examined are: Wake County and the City of Raleigh GIS agencies, Lee County
Strategic Services, Guilford County GIS and Robeson County GIS. This study sought to
chronicle the evolution of web GIS in these selected North Carolina local governments.
The study relied on agency-supplied web traffic data to gauge the variation in use of
online GIS applications. Semi-structured interviews were conducted with staff members
of the investigated GIS agencies to uncover cross-organizational patterns of change. This
study is modeled on a 2002 study by Dr. Gary Marchionini of organization and interface
co-evolution [Marchionini, G. (2002). Co-Evolution of User and Organizational
Interfaces: A Longitudinal Case Study of WWW Dissemination of National Statistics‖,
Journal of the American Society for Information Science and Technology, 53(14)].
Literature Review The Advent of Geobrowsers and the Geospatial Web
As seen in the rising use of personal, in-car navigation system and online mapping
applications for finding driving directions or locating points of interests, advances in
digital technology have made mapping technology easier to use and more ubiquitous.
Developed over the last half a century, geography information systems (GIS) had been
the domain of computer and environmental scientists, climatologists and geographers.
and statistics to the general public, members of the geology and geography faculty at the
West Virginia University commented in a chapter in ―The Geospatial Web‖:
The availability of free Web mapping applications may now help break down many of the long-standing barriers to the public use of geospatial technologies. Anyone with access to an Internet-enabled computer or mobile device now has the ability to display and interpret geospatial data and even add to that information without expert intervention.
(Rouse, 2007, p. 153)
Put concisely, the ―Geospatial Web‖ ―is an integrated, discoverable collection of
geographically related Web services‖ (Lake and Farley, 2007, p. 15). The term is used to
define the integrating of ―cartographic geodata with geotagged hypermedia‖ and
―allowing [users] to browse geospatial data from a satellite perspective‖ – by zooming in
and out on a digital representation of the Earth‘s surface – and ―refers to the global
collection of general services and data that support the use of geographic data in a range
of domain applications.‖ The development of the ―Geospatial Web‖has taken two
forms: 1) ―stand alone‖ virtual globes (e.g., Google Earth); and, 2) web mapping services
that are embedded on websites. Layers of elements such as documents and photos can be displayed on either surface by being ―georeferenced‖ or linked to a position on the globe
or map. This allows for repositories of data to ―made aware‖ of the location of what they
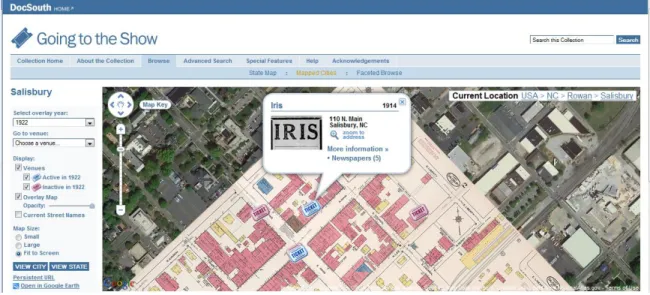
describe/depict. For example, the UNC University Library‘s Document the American
South used a map interface for searching of their online ―Going to the Show‖ collection,
that chronicles the history of movie theaters in North Carolina from the late 1890s to
approximately 1930 (http://docsouth.unc.edu/gtts/). Collection content includes
newspaper ads and articles, photographs, postcards and Sanborn Fire Insurance maps –
all of which are discoverable by panning across the North Carolina terrain in the browser
integrated into the map display (Figure 1). After selecting a city and zooming into its
historic area, the user can select a specific theater in order to access collection items
about that theater (Figure 2).
Figure 1: DocSouth ―Going to the Show‖
The growth in the use of maps as interfaces is a result of a conclusion that much
of information is specific to geography and/or spatial relationships between different
geographies. Jokingly two British researchers noted that ―80 percent of all information has a geographical component‖ and that web developers – with application such as
Google Maps and Yahoo! Local – are incorporating geographic awareness into search
engine design to reflect this reality (Hart & Dolbear, 2007, p. 39). Information can be ―geospatially peculiar‖. This development comes out of user demand and information
sciences research:
Information retrieval research has also discovered geobrowsers as an effective platform to identify and access relevant information more effectively. An increasing number of applications use geospatial extensions for specifying queries and structuring the presentation of results. (Scharl, 2007, p.4 )
In a January 31, 1998 speech entitled ―The Digital Earth‖, then-Vice President Al
Gore called for a reimagining of how individuals interact with data and the development of a ―multi-resolution, three-dimensional representation of the planet, into which we can
embed vast quantities of geo-referenced data.‖ The development of downloadable
geovisualization applications such as Google Earth and ArcGIS Explorer is a partial
realization of this idea (Goodchild, 2008) of ―a mechanism for users to navigate and
search for geospatial information - and for producers to publish it… [with] a browsable,
3D version of the planet available at various levels of resolution, a rapidly growing
universe of networked geospatial information, and the mechanisms for integrating and
displaying information from multiple sources.‖ Twelve years after Gore‘s Los Angeles
speech, user-generated, non-governmental organization-generated and
government-generated information – such as U.S. Geological Survey earthquake and stream flow
be draped onto a digital, virtual globe in Google Earth while users of NASA‘s World
Wind can fly through NASA and USGS satellite imagery. In fact, within 15 months of
its release, Google Earth had been downloaded 100 million times (Schoning et al., 2008).
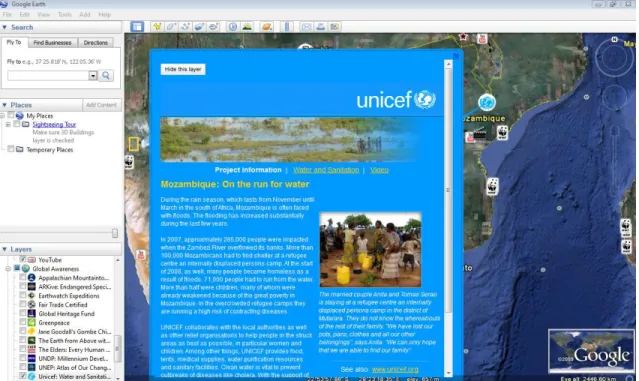
Google Earth allows layers of data to be draped onto its virtual globe. In Figure
3, icons displayed on a portion of southern Africa link to content from the National
Geographic Society, World Wildlife Fund, The New York Times, United Nations
Environmental Programme and user-generated videos uploaded to YouTube. Selecting a
point allows the user to view information and hypermedia. Once an icon is selected, a ―pop-up‖ displays data about the location. ―Pop-up‖ blocks may contain text, images,
other media and hyperlinks to other resources (Figure 4).
Figure 4: Pop-up in Google Earth
Inside the web browser environment, the federal government and state and local
governments increasingly are using online, interactive and embedded map interfaces as
data visualization tools to connect users to government-held data. Under the heading of ―GIS Supports Gov 2.0‖, the Environmental Systems Research Institute, Inc. (ESRI)
website reports, ―Government are increasingly using GIS as a platform to build mapping applications that engage citizens, deliver transparency, and enhance policymaking.‖
Based in Redlands, California, ESRI produces the ArcGIS software package and is a
recognized leader in the GIS world. In his keynote address at the Gov 2.0 Expo held in
Washington, D.C. in May 2010, ESRI President Jack Dangermond stated, ―This technology provides a framework for open government… and also for civic
engagement‖. Commenting on the pervasiveness of Web 2.0 technologies that allow for
form of maps through browsers and other data devices such as cellular phones and allow
easier access to this data.
These non-static mapping interfaces may allow users to: 1) determine the data
presented (e.g., crime statistics, location of medical facilities, electoral results); 2)
determine the spatial extent of the map (e.g., 1:250,000); 3) define the granularity of the
data (e.g., zip code, county, Census block, health district, watershed); 4) change the map
symbology; 5) conduct minor spatial analysis (e.g., buffering waterways); 6) click on
spatial units to access more data (e.g., median income of a Census tract or number of
photovoltaic installations in a county); and 7) add user-generated content (e.g., citizen
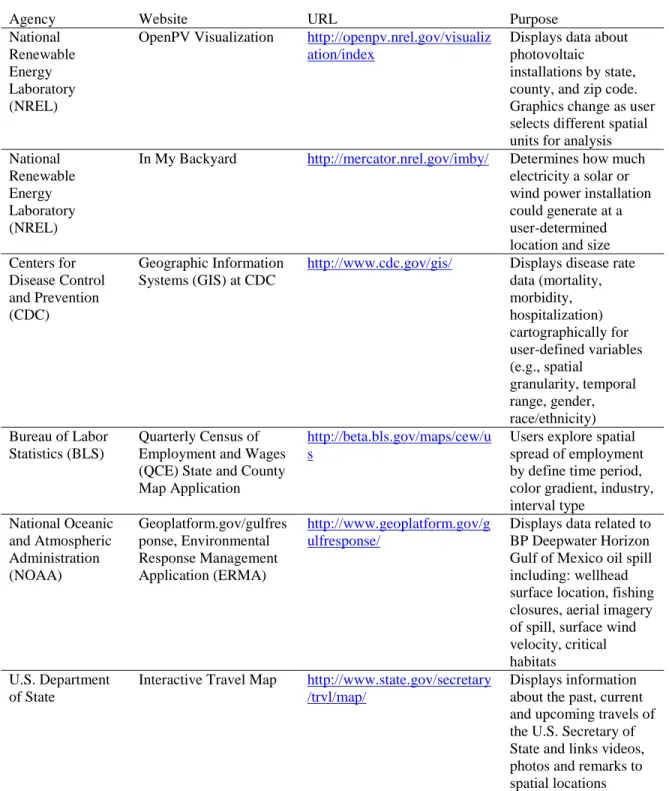
reporting). In addition to those included in Table 1, examples at the federal
government-level include ESRI-designed Recovery.gov (2010) that tracks how American Recovery
and Reinvestment Act of 2009 (ARRA) funds are used at state and local levels and a host
of Department of Health and Human Services and Department of Homeland Security applications to support ―a geospatial Web-enabled U.S. public health infrastructure‖
(Cromer, 2003). The utility of such services does not stop at national boundaries.
Interest in the dynamic disease mapping also extends across national borders as seen in a
disease mapping geo-portal prototype created by the State of Maine and the Province of
New Brunswick (Gao et. al., 2008).
The National Renewable Energy Laboratory (NREL) OpenPV Visualization site
allows for dynamic change charts and graphs also as a user zooms to finer spatial extents
Table 1 Federal Interactive Mapping
Agency Website URL Purpose
National Renewable Energy Laboratory (NREL)
OpenPV Visualization http://openpv.nrel.gov/visualiz ation/index
Displays data about photovoltaic
installations by state, county, and zip code. Graphics change as user selects different spatial units for analysis National
Renewable Energy Laboratory (NREL)
In My Backyard http://mercator.nrel.gov/imby/ Determines how much electricity a solar or wind power installation could generate at a user-determined location and size Centers for
Disease Control and Prevention (CDC)
Geographic Information Systems (GIS) at CDC
http://www.cdc.gov/gis/ Displays disease rate data (mortality, morbidity, hospitalization) cartographically for user-defined variables (e.g., spatial granularity, temporal range, gender, race/ethnicity) Bureau of Labor
Statistics (BLS)
Quarterly Census of Employment and Wages (QCE) State and County Map Application
http://beta.bls.gov/maps/cew/u s
Users explore spatial spread of employment by define time period, color gradient, industry, interval type National Oceanic and Atmospheric Administration (NOAA) Geoplatform.gov/gulfres ponse, Environmental Response Management Application (ERMA) http://www.geoplatform.gov/g ulfresponse/
Displays data related to BP Deepwater Horizon Gulf of Mexico oil spill including: wellhead surface location, fishing closures, aerial imagery of spill, surface wind velocity, critical habitats
U.S. Department of State
Interactive Travel Map http://www.state.gov/secretary /trvl/map/
Figure 5: National Renewable Energy Laboratory (NREL) OpenPV Visualization
Like the federal government, many states have similar interactive ARRA funding
maps (Table 2). For example, the Colorado Economic Recovery Mapping site (Figure 6),
the user can view more information about a particular project by clicking on an icon.
Graphs also change dynamically based on user behavior. States also have developed
portals for the display of environmental and general demographic data (Table 3).
Table 2 Tracking ARRA funding cartographically
State Website URL
Colorado Colorado Economic Recovery Mapping
http://www.colorado.gov/recovery/RecoveryMa pping_2/index.html
Connecticut Stimulus Map http://www.dir.ct.gov/opm/IGP/StateStatApp/m ap.htm
Maryland One Maryland‘s Recovery and Reinvestment
http://mdimap.towson.edu/statestat/
Figure 6: Colorado Economic Recovery Mapping
Table 3 State-level Interactive Mapping
State Agency URL Purpose
State of Idaho Department of Environmental Quality
http://www.deq.state.id.us/maps/interac tive_mapping.cfm
Interactive applications to display air quality, surface water quality and ground water quality Commonwealth of
Kentucky
Kentucky Geography Network
http://kygeonet.ky.gov/kydemographics /index.html
Displays
demographic data (e.g.,
Municipal and county governments also have established geoportals (Table 4).
An example of the use of web mapping services at the municipal level includes the Philadelphia Police Department‘s (2010) online crime mapping application that allows
users to view locations of crimes after specifying temporal and spatial extents for selected
offenses. Raleigh‘s Capital Area Transit (CAT) (2010) ―Real Time Bus Route Info‖
application supplies users with information on current bus locations, expected arrival
times and bus stop locations. On its official website, the District of Columbia employs a
GIS viewer (DC Atlas All-in-One
http://dcatlas.dcgis.dc.gov/dcgis_allservices/viewer.htm) that allows users to toggle on or
off a range of datasets on city services grouped by theme such as: Business and
Economic (Banks, Business Improvement Districts, High Technology Development
Zones); Education (School Attendance Zones, School Election Districts); Health
(Dialysis Clinics, Hospitals, Nursing Homes, Primary Care Centers); Planning, Land Use,
and Zoning (Land Use- Existing, Land Use- Planned); and Aerial Photography and
Scanned Maps (2002 Orthophoto, 2005 Orthophoto, 2008 Orthophoto).
The City of Boston‘s GIS Data Hub (http://hubmaps1.cityofboston.gov/datahub/ )
displays data on city services (e.g., police districts, fire districts), political boundaries
(e.g., wards, city council districts, BRA Planning Districts), public safety (e.g.,
evacuation routes, neighborhood emergency shelters) and ARRA projects (e.g.,
―Greening Our City‖, ―Increasing Public Safety and Public Health‖) (Figure 7). The City
of Chicago and the City and County of San Francisco have similar online viewers:
Chicago Maps, http://maps.cityofchicago.org/mapchicago/viewer.htm and SFViewer
Table 4 Local government Interactive Mapping
Jurisdiction Agency URL Purpose
City of Savannah Savannah Economic Development Authority
http://availableproperty.seda.or g/
Allows users to search for available properties by Size/Access Requirements (e.g., Size from, Size to, Land Type, Rail Access), Maximum Distance to (e.g., Airport, Interstate,
Container Terminal, Break-Bulk Terminal). Allows for some service area analysis Lake County (FL) Lake County GIS http://gis.lakecountyfl.gov/City
View/
Displays zoning, proposed zoning and future land use data. Allows for buffering of features
Figure 7: City of Boston GIS Data Hub
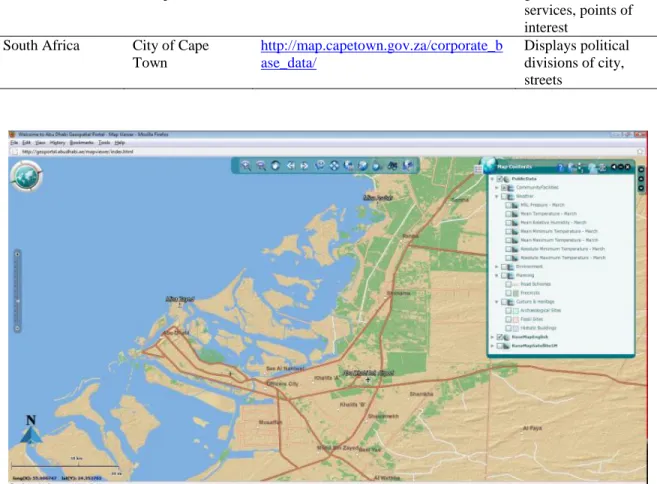
Developing world nations have joined this push into web-based GIS services
(Table 5). Abu Dhabi Systems and Information Centre (ADSIC) received the ESRI ―Making a Difference‖ Award at the 2010 ESRI International Users Conference. ADSIC
administers the Abu Dhabi Spatial Data Infrastructure (AD-SDI) – including the Abu
Table 5 WMS applications in the developing world
Country Agency URL Purpose
United Arab Emirates
Abu Dhabi Geospatial Portal
http://geoportal.abudhabi.ae/mapviewer/ index.html
Displays street, governmental services, points of interest
South Africa City of Cape Town
http://map.capetown.gov.za/corporate_b ase_data/
Displays political divisions of city, streets
Figure 8: Abu Dhabi Geospatial Portal
In a step beyond the dynamic displaying of information based on user behavior
and preferences, web-based public participation GIS (PPGIS) allows users to add data to
a digital map that is shared by a community. Participatory GIS (PGIS) or ―GIS2‖
applications – allow users to exchange views on, for example, planned construction
projects (Zhao and Coleman, 2006).
The basic precept of PGIS is the empowerment of communities through the facilitation of greater community input and access to geospatial data and technologies, community mapping and spatial analysis in support of project decision making.
In such as environment, users could add the location of downed power lines or
sites of environmental contamination. Under the banner of ―Opening the world to everyone‖ at the opening plenary session of ESRI‘s July 2010 International User
Conference in San Diego (http://www.esri.com/events/user-conference/index.html),
Dangermond said along with technical developments, a new crucial data type is the
anthropological ―dimension of data – crowdsourcing – people and citizens coming into GISs‖ in real-time civic engagement. Highlighted during Dangermond‘s opening
remarks, CitySourced (http://www.citysourced.com/) is one such tool through which citizens can report ―graffiti, trash and other civic blight‖ through ―smartphones‖ such as
the Apple iPhone, Google Android or Blackberry. Once registered, reports are sent to
relevant local government agencies in participating cities such as major cities of New
York, Los Angeles, Dallas, Boston, Phoenix and Baltimore.
Rise of E-Government: A Sea Change in Service Provision and Citizen-Government Interaction
The proliferation of geobrowsers and embedded, online GIS applications as well
as the increase in distribution of government data in emerging geospatial data formats
such Keyhole Markup Language (KML) has occurred as part of an exponential growth in
the offering of electronic government (e-government) services all over the globe – from
the European Union and the United States to China and Sub-Sahara Africa (Schuppan,
2009). Edmiston (2003) defined e-government as ―the use of digital technology in the management and delivery of public services, predominantly through the Internet‖ (p. 20).
E-government services are promoted as increasing efficiency through remote service
delivery (e.g., telemedical applications, distance learning, online automobile registration,
and electronic submission of tax returns), remote procurement (e.g., comparative
shopping, tracking orders, electronic purchasing) and the reduction of fraud (e.g.,
tracking food stamp transactions) (Edmiston, 2003).
Proponents of e-government frame its use as a not only as a way to provide less
costly services but also as democratizing of information, empowering citizens by allowing them to engage in ―fluid communication with government institutions‖,
encouraging public participation in democratic processes, and increasing in transparency
as citizens can access anytime and anywhere government-held information that is served
online (Willoughby et al., 2010). Agencies are opening more data to citizens.
Advocates say that this is a break from ―the old model of citizen-public
administration interaction, where communication between the two was at best a lengthy
frustration‖ (Willoughby et al. 2010, p. 51). In equally colorful language, major Gov 2.0
proponent Tim O‘Reilly, president of O‘Reilly Media and organizer of Gov 2.0
conferences, stated in an interview with Inc. Magazine, ―We've come to think about
government as a kind of vending machine – we put in our taxes and we get out services.
And if we don't get the services we want, we shake the vending machine. We get to
protest. We write our congressmen. We have a tea party… But there are better things we
can build than vending machines‖ (Chafkin, 2010).
Considered ―the Oracle of Silicon Valley‖, O‘Reilly has championed government
use of Web 2.0 platform technology. In his book Open Government, O‘Reilly wrote:
Now, a new generation has come of age with the Web, and it is committed to using its lessons of creativity and collaboration to address challenges facing our country and the world. Meanwhile, with the proliferation of issues and not enough resources to address them all, many government leaders recognize the opportunities Web 2.0 technologies provide not just to help them get elected, but to help them do a better job. By analogy, many are calling this movement Government 2.0. What the heck does that mean?
Much like its predecessor, Web 2.0, ―Government 2.0‖ is a chameleon, a white rabbit term, that seems to be used by people to mean whatever they want it to mean. For some, it is the use of social media by government agencies. For others, it is government transparency, especially as aided by government-provided data APIs. Still others think of it as the adoption of cloud
computing, wikis, crowdsourcing, mobile applications, mashups, developer contests, or all of the other epiphenomena of Web 2.0 as applied to the job of government. (O‘Reilly, 2010)
O‘Reilly countered that Gov 2.0 is not only about service provision but also the
encouragement of collective action.
Government 2.0, then, is the use of technology—especially the collaborative technologies at the heart of Web 2.0—to better solve collective problems at a city, state, national, and international level.
The hope is that Internet technologies will allow us to rebuild the kind of participatory government envisioned by our nation‘s founders, in which, as Thomas Jefferson wrote in a letter to Joseph Cabell, ―every man…feels that he is a participator in the government of affairs, not merely at an election one day in the year, but every day.‖ (O‘Reilly, 2010)
With harnessing of the Internet for government services occurring at all levels of
government, federal legislation – the E-Government Act of 2002 – was passed that
governmental life. Both the United States House of Representatives and Senate passed
the bill by unanimous consent and President George W. Bush signed the bill into law on
December 17, 2002. The bill became Public Law No. 107-347 and established the Office
of Electronic Government (OEG) within the Office of Management and Budget (OMB). The bill‘s ―Findings‖ section acknowledged ―the use of computers and the Internet is
rapidly transforming societal interactions and the relationships among citizens, private businesses, and the Government‖. Perambulatory language found in the ―Purposes‖
section stated e-government programs should be employed ―to promote the use of the
Internet and emerging technologies within and across Government agencies to provide
citizen-centric Government information and services‖, and ―to promote access to high quality Government information and services across multiple channels‖. In the Act,
―Electronic Government‖ was defined similarly to how the term is defined by scholars as:
(3) ‗electronic Government‘ means the use by the Government of web-based Internet applications and other information technologies, combined with processes that implement these technologies, to—
(A) enhance the access to and delivery of Government information and services to the public, other agencies, and other Government entities;
or (B) bring about improvements in Government operations that may include effectiveness
Belanger and Hiller (2006) proposed a categorization of e-government services
into six buckets: 1) Government with individuals – delivering services; 2) Government
with individuals – political process; 3) Government with business as a citizen; 4)
Government with business in the marketplace; 5) Government with employees; and, 6)
Government with government. Online mapping application can fall into all of these
of needed supplies during a natural disaster; management of utilities and interagency
cooperation on issues such as maintaining biodiversity; and, route finding for employees.
Because of the potential and perceived savings in resource expenditure and
demands for transparency, the trend of greater e-government services is expected to
continue. On his first day in office on January 21, 2009, President Barrack Obama signed a memorandum on Transparency and Open Government reaffirmed that ―[e]xecutive
departments and agencies should harness new technologies to put information about their
operations and decisions online and readily available to the public‖ (White House, 2009).
On March 5, 2009, President Obama appointed Vivek Kundra as the federal government‘s first Chief Information Officer. At Kundra‘s appointment, President
Obama said, ―I have directed him to work to ensure that we are using the spirit of
American innovation and the power of technology to improve performance and lower the
cost of government operations. As Chief Information Officer, he will play a key role in
making sure our government is running in the most secure, open, and efficient way possible‖ (White House, 2009).
The Office of Management and Budget report FY 2010 Report to Congress on the
Benefits of the E-Government Initiatives highlighted the value of federal e-government
programs (Office of Management and Budget, 2010). The report is divided into ―Government to Citizen‖ programs, ―Government to Businesses‖ and ―Government to
Government‖ programs. ―Government to Citizen Portfolio‖ programs recognized
included:
GovBenefits.gov – managed by the Department of Labor, this web portal provides
IRS Free File – managed by the Department of the Treasury, this program creates
―a single point of access to free on-line preparation and electronic tax filing
services‖ and is credited with saving the federal government $68 million since
2003 (p. 4)
―Government to Businesses‖ programs detailed included:
Business Gateway – managed by the Small Business Administration (SBA), this
service pulls together information on federal, state and local regulations, financing
opportunities and licensing requirements in one resource portal
E-Rulemaking – managed by the Environmental Protection Agency (EPA), this
program allows for ―one stop shopping‖ for federal regulations
―Government to Government‖ programs described included:
DisasterAssistance.gov – this site allows users to ―Learn what help you might be
able to apply for from 17 government agencies‖, ―Check the progress of your applications online‖, ―Apply for help from FEMA‖ and other learn about and use
other disaster-related resources
Grants.gov – managed by the Department of Health and Human Services, this site
is ―a central storehouse for information on over 1,000 grant programs and
provides access to approximately $500 billion in annual awards‖. Governmental,
education, public housing organizations and non-profit organizations can apply
for grants and check on the status of an application
Geospatial One-Stop – allows users to search for and access governmental-held
This implementation of e-government services has extended to local and state
governments and developing nations (Willoughby et al., 2010). With the slogan ―Connecting you to the Government‖, the Government of Singapore web portal
(http://www.gov.sg/) allows citizens to engage in ―fluid communication‖ with the
government by providing feedback on governmental policy on a web form that allows
file attachments. A 2004 article in The Virginian-Pilot on e-government adoption of Hampton Roads‘ municipalities (e.g., Chesapeake, Virginia Beach) reported that
―services that once required residents to wait in Nile-length lines or endure six Yanni
songs while on hold, can now be done online 24 hours a day‖ (Newton, 2004). These
services included: applying for city employment, paying for parking tickets, reporting
potholes, applying for building permits and scheduling bulk trash pick-up.
In addition to online, interactive GIS mapping, the counties used for this study
have embraced Gov services. Wake County, North Carolina offers a range of
e-government services including reporting a lost pet, registering to vote, viewing voting
records, applying for county jobs, view restaurant sanitation inspection grades, applying
for a marriage license and paying tax bills online (Wake County, 2010). Lee County
(2010) government‘s webpage for ―Electronic Government and Online Services‖
declares:
The mission of Lee County E-Gov (E-Government) services is to improve the delivery of public services and achieve long term cost savings by offering online services that are structured to meet the needs of our customers. E-Gov is designed to offer information and services 24x7 to citizens and businesses in a reliable, secure and convenient manner.
On the site, users can pay taxes online, request to appear before Commissioners, renew
Some research has been done on the success of e-government services. For
example, the national 2010 ―Public Library Fundy & Technology Access Study‖ –
conducted by the American Library Association (ALA) and the Center for Library &
Information Innovation at the University of Maryland – stated 79 percent of libraries
reported assisting patrons with accessing online government data or services. In 2009,
only 54 percent reported providing such assistance. Agency-level case studies show
similar increases in visits to governmental websites. Marchionini‘s (2002) trend analysis of the web log of the U.S. Department of Labor‘s Bureau of Labor Statistics (BLS)
showed that total BLS website page requests in the month of October for 1995 and 2000
increased from 191,639 to 6,486,473. The BLS is ―the principal Federal agency
responsible for measuring labor market activity, working conditions, and price changes in the economy‖ and its mission is ―to collect, analyze, and disseminate essential economic
information to support public and private decision–making‖ (U.S. Bureau of Labor
Statistics). The increase see in traffic on the BLS website mirrored a proportionally
similar rise in traffic on the Library of Congress website during the same period. Library
of Congress monthly page requests increased from 1,981,045 in 1995 to 58,268,221 in
2000. A more gradually upward trend was seen in online accessing of geospatial data
provided by MetroGIS, a Minnesota-St. Paul area, voluntary GIS initiative through which participating agencies share data. MetroGIS‘s DataFinder website also experienced a
significant rise in total visitor sessions between 2003 and 2008 – when events rose from
13,841 to 17,584. Over the same period, total data downloads increased 29.2% from
Impacts of e-Government: Organizational Co-evolution and Concerns over Privacy and Social Equity
The deployment of these new technologies for data dissemination, collection and
interaction with the public leads to changes in how agencies and governments function –
from the federal government to municipalities (Marchionini, 2002). Speaking on the City of Virginia Beach‘s web presence from 1996 to 2004, chief information officer David
Sullivan said, ―It‘s literally transformed the way people deal with the city.‖ Marchionini
came to a similar finding in his work with the BLS – that changing an agency‘s user
interface impacts how the organization evolves thereafter and that other components of an organization‘s interface co-evolve with changes made to an organization‘s user
interface. The organizational interface is ―data systems, policies and procedures,
corporate culture, and public face of an agency or institution‖ – in other words, ―the
intersection of people, data, tools and policies specific to an organization‖ (p. 1193). In
the world of e-government, an organization‘s public face is its website.
For example, the roll-out of a new BLS website led to changes to departmental
policies, financial planning and design of future services. An important finding of the
study was that the deployment of a BLS website that allowed online 24-hour-a-day
access to labor data led to a shift in user population from academics, public officials and
reporters to non-expert members of the general public. This change in turn impacted the
culture of the institution as the agency revised its internal government orientation to
become more general public ―customer‖ oriented. Marchionini noted that with a greater
web presence, the BLS evolved since the 1990s from an agency ―from serving the needs
tapes of data sets to a broader group with sophisticated computer skill and systems who used the Internet to transfer datasets via ftp, to today‘s web-based dissemination to
anyone with a personal computer and Internet access‖ (p. 1198, Marchionini, 2002).
An expanding user base with new demands in this new technological environment
changed technical skills of BLS employees needed to perform work (shift from handling
phone calls to HTML coding and emailing). The growth in activity on the BLS website
further has led to greater resources being devoted to its maintenance and the addition of
new services to the site (e.g., an inflation calculator, educational tools for kids, briefs on
economic principles).
Despite demonstrated growth in use of such services, e-government services was
and continues to be a contentious issue because of high costs and concerns some privacy
groups, public administrators and those in academia have with the repercussions of vast
amounts of government-held data being widely accessible and blurring of
citizen-consumer identities.
Privacy concerns surrounding e-government services abound. Some citizens‘
groups are concerned that governmental bodies surreptitiously will collect data of users
accessing governmental websites. Skeptical citizens see e-government initiatives as an ―invasion of citizen privacy by government‖ (Belanger and Hiller, 2006, p. 49). Further,
with more public information being made available online, some worry that too much
information about individuals is too easily accessible now that it is served up online.
Prior to digital copies of land records being provided online, citizens had to travel to a
central governmental office to view such records. Now someone can access information about a resident‘s home – including the type of exterior walls and heating system and the
number of full bathrooms and additions – from the other side of the globe through the
integration of GIS and property records (Franklin County, NC – Parcel Map Search).
Another concern is the security of electronic exchanges as e-government services move
from simply displaying and allowing interaction with data to online transactions of
financial and personal information (Horst et al. 2007).
Also in dispute in some literature is the value of importing private sector concepts
into the realm of public administration and treating citizens as consumers (Mosse and
Whitley 2008).
While the metaphorical recasting of citizens as customers is understandable in terms of the need to provide more responsive services, the consequences and dangers of this re-identification are manifold. Fundamentally, the idea of citizen as customer is embedded within the idea of government acting in a market. (p. 165)
Such writers posit that economic laws of supply and demand cannot be applied to
governmental work since the its ostensive mission involves equitable treatment of all
classes of citizens and providing public goods – often because of market failure.
Further, some social geographers are concerned with the impact online GIS will
have on notations of citizenship and the extent community members are able to
participate in this digital civic engagement since not all societal members have equal
access to the Internet. The ―informatization of neighborhoods‖ – or the relating of
massive amounts of demographic and socioeconomic data with specific geographies –
will accelerate what they describe as the increasingly fragmentation of social geography
online GIS to ―find ‗their‘ place within complex and dynamic urban spaces‖ placed on
neighborhood characteristics (p. 326).
It is not hard to imagine parents using Internet search facilities to identify areas where particular types of schooling (specialist status, privately managed) are being developed and, more
importantly, being able to interpret the information they discover. From here it is a short step towards using online GIS more generally in order to negotiate the dynamic social geography of splintering urbanism strategically, substituting online search capacity for what was hitherto intuition and loosely organized 'anthropological evidence'. (p. 330)
In short, for these geographers, the question is one of access to digital technology:
[A]ccess to new digital technologies, particularly online GIS, is beginning to alter the nature of urban space as the aggregated decisions of privileged social actors increasingly affect the social and political patterning and characteristics — the social politics — of their chosen
neighbourhoods. (p. 335)
While this study focuses on organizational change in an agency deploying new
data-sharing technologies, it is important to remember these services can impact greater
society by their use and real or perceived misuse.
The three research questions for this study were:
1. What web GIS services do North Carolina counties offer?
2. How much are these services used and by whom?
3. How has offering these services impacted agency functioning?
Question 1 was addressed by examining participating agency web GIS services. To
answer Question 2, the researcher examined trends in web traffic statistics for web GIS
sites. Answering Question 3 required the researcher to interview staff members of
participating agencies to uncover organizational changes.
Significance
The expected result of this study was that online, interactive mapping interfaces
internal functioning and future direction. Patterns of changes are identified as are areas
deserving of future research.
Methods
Participants
The participants for this study were chosen from the North Carolina Geographic
Information Coordinating Council-maintained list of North Carolina County GIS
Contacts (http://www.ncgicc.com/Portals/3/documents/County_GIS_Contacts.pdf).
Thirty-six county agencies were invited to participate in this study. The four agencies
who agreed were Wake County, Lee County, Guilford County and Robeson County.
They were asked to submit web analytics reports for their agency‘s main web GIS site.
Three additional counties agreed to participate, but their data were not complete
enough to be used. For example, one respondent only was able to send the prior month‘s
web analytics because her practice was to delete prior report upon receiving a new report. The sites considered to be a county ―main web GIS‖ were the interactive web
mapping services that display cadastral data. For the study participants, these sites were:
City of Raleigh & Wake County‘s Internet Multi Access Parcel System (iMAPS); Lee
County‘s ConnectGIS, Guilford County‘s Data Viewer and Robeson County‘s
ConnectGIS. The Guilford County site also maintains links to separate sites that were
not included in the study. Guilford County also supplied web traffic data for its GIS FTP
Financial information included in this report came from individual county governments‘ financial reports. Demographic information was gathered from the U.S.
Census Bureau‘s American FactFinder.
Metrics
The metrics used to measure traffic to digital government records were those that
are established web analytic measures – visits, unique visitors and page impressions
(Alpar 2001, Sterne 2002). The Interactive Advertising Bureau (IAB) (2004) defined
these terms for the business community as follows.
Visit: one or more text and/or graphics downloads from a site qualifying as at least one page, without 30 consecutive minutes of inactivity, which can be reasonably attributed to a single browser for a single session. A browser must ―pull‖ text or graphics content to be considered a visit.
Unique Users: the number of actual [individual IP addresses], within a designated reporting timeframe, with activity consisting of one or more visits to a site or the delivery of pushed content Page Impressions: measurement of responses from a web server to a page request from the user browser, which is filtered to remove robotic activity and error codes prior to reporting, and is recorded at a point as close as possible to opportunity to see the page by the user
Page impressions – or page views – often are characterized by views, average
views per day, average per unique visitor and document views. Visits often are
characterized by visits, average per day, average visit length, median visit length, visits
from United States, visits referred by search engines (Jana, 2004). Metrics collected by
Google Analytics include pages per visit, percent of direct traffic, percent of referring
sites traffic, and top content – determined by page views (docsouth.unc.edu 2010).
Interviews
Following Marchionini (2002), the web log analysis was augmented with agency
personnel. The University of North Carolina at Chapel Hill‘s Institutional Review Board
approved the study on September 24, 2010 (Study #: 10-1714). Semi-structured
Agency directors supplied lists of staff members and their email addresses. Only Wake
County did not provide a complete listing of staff members and their contact information.
Staff members were contacted individually via email and asked to participate in the study
(Appendix B). Participants were provided an information sheet outlining the goals of the
study and their rights as participants (Appendix C)
Interview questions centered on the role of the interviewee in the organization and their perceptions of how the agency‘s role and user base had changed since the
deployment of the web mapping application (Appendix D). Interviews were conducted
via telephone and lasted between 20 and 30 minutes. Six of the seven interviews were
recorded and the researcher took notes.
GIS in North Carolina
GIS is an evolving field in North Carolina local government and as such, the state
has created agencies and structures to promote its use. The North Carolina Center for
Geographic Information and Analysis (CGIA) serves as the chief coordinator of GIS
services in the state and the main clearinghouse for geospatial information in the state
(http://www.cgia.state.nc.us/). The agency began in 1977 when the General Assembly
initially created it as the Land Resources Information Service within the Department of
Administration‘s Office of State Planning (Shanley, 2007). After most recently being
housed in the Department of Environment and Natural Resources (DENR), CGIA moved
to the Office of Information Technology Services (OITS) and the Office of the State
Chief Information Officer (CIO) in August 2009. The CGIA Director reports to the
In 1991, through Executive Order No. 147, Governor James Martin created the Geographic Information Coordinating Council (GICC) to ―develop policies regarding the
utilization of geographic information, GIS systems and other related technologies‖ and be
responsible for ―strategic planning‖, ―coordination, direction, and oversight of State,
local, and private GIS efforts‖, and ―advising the Governor, the legislature, and
[Information Technology Commission] as to the needed directions, responsibilities, and
funding regarding geographic information‖. The Governor created the Coordination
Program to encourage data-sharing and reduce redundancy in services across state and
local governments. Governor Jim Hunt‘s Executive Orders No. 16 (in 1993), No. 124 (in 1997), No. 142 (in 1999), and No. 166 (also in 1999) expanded the GICC‘s membership
(Shanley, 2007).
In August 2001, the General Assembly passed N.C. Session Law 2001-359 that
contained similar language to the previous executive orders and permanently established
GICC (www.ncgicc.com). Both the executive orders and enacted legislation mandated
that the CGIA provide staff support to the GICC and its subcommittees. The GICC‘s
five standing committees include the Federal Interagency Committee (FIC), the Local
Government Committee (LGC), State Government GIS Users Committee (SGUC), the
Statewide Mapping Advisory Committee (SMAC), and the Management and Operations
Committee (M&O). The CGIA Director serves as lead staff for the GICC.
Since 1991 because of legislative action and technological advances, the need for CGIA‘s support role has grown. GICC has grown from 12 to 35 members appointed by
the Governor, General Assembly or Executive Office. Ad hoc committees and working
long-term digital preservation and perform narrow roles such as document drafting for
orthoimagery business plans. The CGIA supports these subunits as needed. The
governor, NC House or NC Senate appoint GICC membership or members serve by
virtue of their executive office. The GICC consists of representatives from municipal,
county, state and federal government as well as the private sector. Performing the bulk of Council‘s work are standing committees such as the State Government GIS Users
Committee, the Statewide Mapping Advisory Committee and, most relevant for this
study, the Local Government Committee. North Carolina‘s CGIA-mandated data
clearinghouse is NC OneMap (www.nconemap.com/).
As of March 2010, 94 of North Carolina‘s 100 counties had an online mapping
site. In 2002, this number was less than 10 and as late as 2007, less than 50 counties had
such web mapping services (Next Generation Archives, 2009). The NC Department of Administration‘s State Property Office website (Figure 10) also maintains a list of county
and municipality GIS sites (http://www.doa.state.nc.us/spo/county.htm). County
websites included are (Figure 11): Currituck County
(http://www.co.currituck.nc.us/Interactive-Online-MappingDup2.cfm); Caswell County
(http://arcims.webgis.net/nc/caswell/default.asp); and Ashe County
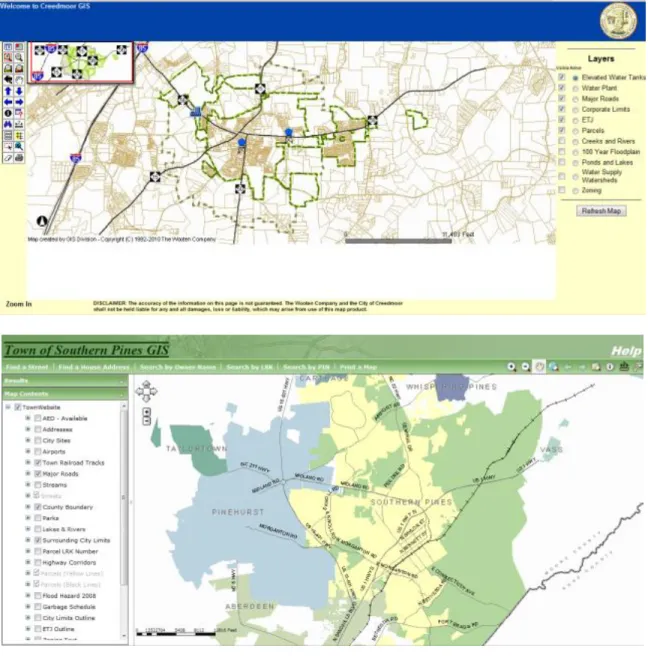
(http://ashegis.ashecountygov.com/webgis/). Municipal web GIS sites (Figure 12) include
the Town of Creedmoor (http://maps.thewootencompany.com/creedmoor/viewer.htm)
Figure 12: NC municipal web GIS sites
Non-governmental GIS organizations in the state include the North Carolina Arc
Users Group (http://ncaug.com/) and the Carolina Urban and Rural Information Systems
Association (CURISA) (http://www.carolinaurisa.org/home.php). The CGIA and
CURISA are the sponsors of the 2011 NC GIS Conference
Carolina, NC Property Mapper Association, NC State University and other educational
institution, private companies and professional associations.
GIS in Wake, Lee, Guilford and Robeson Counties
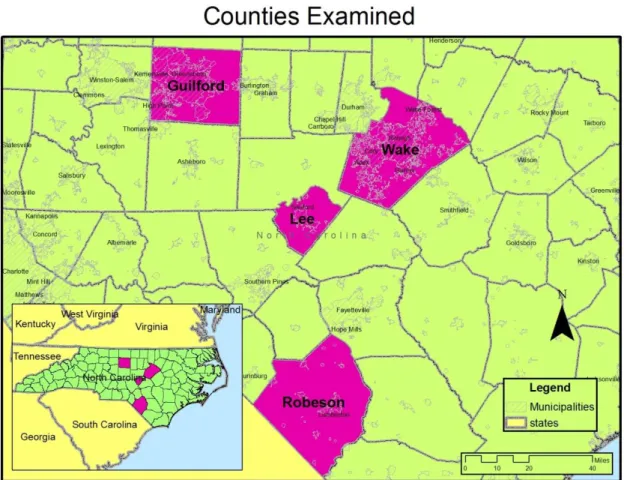
The four agencies examined in this study are Wake, Lee, Guilford and Robeson
Counties (Figure 13). The GIS agencies in these counties serve populations of varying
sizes and demographic make-up (Table 7). Serving the biggest population, Wake County
is the largest agency included in this study, and the agency was able to provide the most
complete web traffic data for its web applications (Tables 6 and 7).
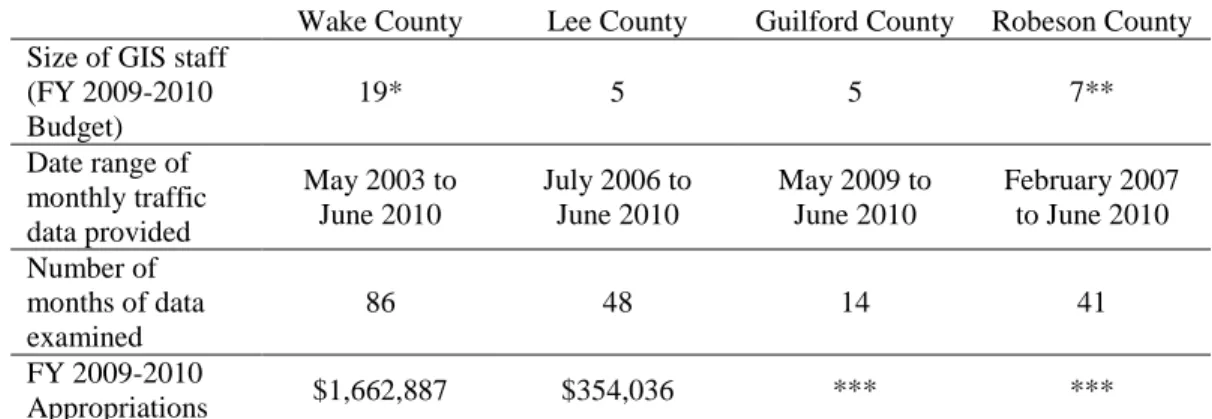
Table 6 Characteristics of Agencies Studied and Data Collected
Wake County Lee County Guilford County Robeson County Size of GIS staff
(FY 2009-2010 Budget)
19* 5 5 7**
Date range of monthly traffic data provided
May 2003 to June 2010
July 2006 to June 2010
May 2009 to June 2010
February 2007 to June 2010
Number of months of data examined
86 48 14 41
FY 2009-2010
Appropriations $1,662,887 $354,036 *** ***
*This number does not include the 8 staff members of Wake County‘s iMAPS partner – the City of Raleigh.
**Department does tax mapping as well as GIS. Staff includes: three mapping technicians; one tax clerk; one E911 Addressing Coordinator; and, one GIS Technician.
***Unable to separate GIS budget from parent departmental budget
Table 7 Demographics of North Carolina and the Examined Counties
North Carolina
Wake
County Lee County
Guilford County
Robeson County Population (2009) 9,036,449 897,214 60,477 480,362 129,559 Population, percent
change, April 1, 2000 to July 1, 2009
16.6% 42.9% 22.9% 14.1% 5.1%
High degree graduate or higher (2000)
82.9% 91.1% 77.7% 86.2% 68.6%
Bachelor‘s degree
or higher (2008) 25.6% 47.0% 15.7% 32.1% 12.5%
Median household
income (2008) $46,107 $64,527 $43,046 $47,308 $36,133 Median value of
owner-occupied housing units (2008)
$145,600 $217,700 $129,800 $151,700 $72,900
Source: U.S. Census Bureau
Wake County
Wake County is home to the City of Raleigh, the state‘s capital and second most
populous city after Charlotte in Mecklenburg County. Raleigh‘s population was
county is part of the Triangle region which also includes the Town of Chapel Hill – to the
west in Orange County – and the City of Durham – in the adjacent Durham County. The
presence of three large research universities in the Triangle – the University of North
Carolina at Chapel Hill, Duke University in Durham and North Carolina State in Raleigh – fueled economic development in the latter 20th
century and this corresponded with a
rapid population growth. With the creation of the Research Triangle Park (RTP) and the
boom in biotechnology pharmaceutical industries, the Triangle became home to a highly
skilled and educated workforce, and since the 1950s, the municipal boundaries of Raleigh
and other Wake County jurisdictions steadily have crept outward with urban sprawl as
populations have swollen.
The U.S. Census estimated the population of Wake County in 2009 at 897,214. In
addition to Raleigh, Wake County municipalities include Cary (2009 pop. est.: 112,414),
Garner (2009 pop. est.: 27,525), Holly Springs (2009 pop. est.: 21,743), and
Fuquay-Varina (2009 pop. est.: 17,905). When considering population size and characteristics,
Wake County is an outlier along with Mecklenburg County in the state because of their
large populations and affluence.
Lee County
Lee County is the state‘s most recently formed county (in 1907) and is situated in
the center of the state. A member of the Triangle J Council of Governments, Lee County
is located in the southwestern portion of this high growth region. Like Wake County
between 2000 and 2009, population growth in Lee County (22.9%) outpaced the rest of
Guilford County
Guilford County is located in the Triad region of the state, formed by the cities of
Greensboro, Winston-Salem and High Point. With a population estimated at 255,061, Greensboro is the county‘s largest city and is the third largest in the state. Also in the
county, High Point is the state‘s eighth largest city with a population of 103,396 –
101,618 of whom live in Guilford County.
Robeson County
Located in the southeast corner of the state, Robeson County borders South
Carolina and is home to a significant population of Native Americans – the Lumbee. The
largest city is Lumberton (2009 pop. est: 21,923).
The location of GIS in local government
GIS operations are located in a variety of locations in the organization structure of
local governments – according to a May 2010 GICC survey
(http://www.ncgicc.com/Portals/3/documents/Location_of_County_GIS_Operations.pdf).
Of the 100 North Carolina counties, 29 governments include GIS functioning as part of
the Tax Administration/Assessor, 19 in Information Technology/MIS and 13 as
stand-alone GIS agencies. The location of GIS agencies varies across the counties included in
this study.
Wake County Geographic Information Services
Wake County Geographic Information Services (GIS) is a part of the Community
Services department of the Wake County government. From 2004 to 2009, the GIS
department lost one position. In that budget document, the mission of the office was
described:
Geographic Information Services has a primary responsibility to develop and maintain core geographic databases needed by our customers. Once the data is accurate, current, and complete, GIS serves as a central distributor for the data and a clearinghouse of the data to and from other agencies. In order to accomplish these two business services, GIS staff provides technical support to our users. This support includes needs analyses, programming/application development, hardware/software support, database development, training, project management, and coordination with other agencies concerning the technical infrastructure and support needed to provide and maintain the information, services, databases, and capabilities that our customers need. p. 154, Adopted Operating and Community Improvements Budgets (FY 2010)
Because its staffing has been constant, the percentage of Community Services
employees that are GIS personnel has steadily declined over the last six years and the department‘s funding as a percentage of Community Services funding also slipped
downward. In 2004, the GIS department made up 8.08% of the Community Services
staff and its expenditures accounted for 9.23% of Community Services expenditures. By
the 2010 budget, only 5.96% of the Community Services staff was in the GIS office and
in 2009, only 7.01% of Community Services expenditures were on GIS. In real terms,
GIS expenditures only increased 8.37% from FY 2003 to FY 2009 (2009 dollars) – from
$1,559,971.98 to $1,690,493.00.
City of Raleigh GIS
Wake County GIS offers its interactive, online GIS application in partnership with
the City of Raleigh. GIS services are a part of the City of Raleigh‘s Information
Technology (IT) Department. In 2003, seven of 59 departmental employees were
designated as geographic information services. In 2004, this number increased to eight of
59. After a departmental reorganization, ―geographic information services‖ was dropped
in budget documents as a designation of service area within IT. Currently, the agency
In the FY 2010 budget, GIS services were under the Business Applications
Support, one of five divisions with the department. A description of the section‘s work
stated:
Business Applications includes planning, development, implementation and maintenance of software systems. Web Services manages the city's intranet and internet. The GIS program is responsible for the city‘s geographic data, as well as the dissemination of GIS technology to other city programs, including Stormwater. Database Services designs and maintains the City‘s
databases. (City of Raleigh, 2010).
Other divisions within the IT department are Customer Relationship Management,
Enterprise Infrastructure Management, Administration and Shared Services and Strategy
and Planning. Between 2003 and 2010, the number of IT employees increased from 59
to 74.
The FY 2010-2011 budget touts the department‘s collaboration with Wake
County GIS in updating the web application iMAPS.
Partnered with Wake County to upgrade and enhance the existing iMAPS online mapping application using the latest technologies. The new application includes improved cartography, intuitive navigation, new and improved searches, and access to additional data and enhanced integration to other City and County applications. (City of Raleigh, 2010).
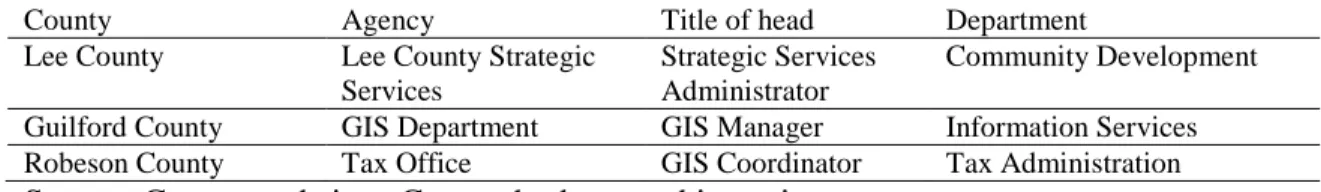
The location of GIS agencies in the other examined county governments varied (Table 8).
Table 8 Other location of GIS services in study area
County Agency Title of head Department
Lee County Lee County Strategic Services
Strategic Services Administrator
Community Development
Study Findings Web Applications
The web application employed by the agencies examined included in-house
creations and vendor-created applications.
Wake County and the City of Raleigh
iMAPS (March 2003 to July 2010):
http://imaps.co.wake.nc.us/imaps/main.htm?msize=525
iMAPS (April 2010 to present): http://maps.raleighnc.gov/imapsraleigh/index.html
In a joint effort with the City of Raleigh, Wake County deployed an ESRI-
created online GIS in May 2001. The first version of the Internet Multi-Access Parcel
System (iMAPS) replaced the initial web GIS in March 2003. This version of iMAPS
was housed on the Wake County government server.
To explore different groups of data, users could select a view from a list box
(Figure 14). Once a view was selected, a list of available layers of data would appear in a
right side table of contents and a user could toggle on and off layers. The views available
are listed below along with some of the layers contained by each.
Property (Parking, Vegetation, Parcels, Streets, Zipcode Boundaries)
Property 2
Environmental – Septic (Solid Waste Facilities, Septic Points, Soils)
Environmental – Topo (Creeks and Rivers)
Aerial Photography (2006 Color Orthos: Raleigh only, 1999 Color Orthos:
County Zoning (Angier Zoning, Apex Zoning, Morrisville Zoning, Cary
Watershed Zoning Overlay)
Raleigh Zoning (Airport Overlay District, Downtown Overlay District, Pedestrian
Business Overlay District)
Electoral Districts (Polling Places, Voting Precincts, Wake County Commissioner
Districts, Raleigh City Council Districts, Wake County Superior County Judge
Districts, US Congressional Districts)
Administrative Districts (Townships, Corporate Limit Boundary)
Park and Greenways (Wake Count Openspace, Raleigh Greenways, Raleigh
Parks)
Cultural Facilities (Libraries, Schools)
Demographic (Census Tracts – 2000, Census Block Groups – 2000)
Public Safety (EMS Stations, Fire Stations, Sheriff Zones, Garner Police Beats,
Fire Insurance Districts, County Fire Response Districts)
Transportation (Rail lines, Airports, Major Roads, Streets)
Raleigh Planimetrics (Raleigh Trails, Raleigh Railroads, Raleigh Communication
Features, Raleigh Building Footprints, Raleigh Utility Structures)
Raleigh Trash and Recycling Collection (Yard Waste Collection Routes, (Trash
Collection Routes, Collection Day)
Raleigh Development Plans (Raleigh Development Plans)
Raleigh Crime Data (Arson, Larceny, Motor Vehicle Theft, Robbery, Homicide,
In a property view, a user was able to zoom in and select a parcel. The right-side
sidebar then would display information about the property including: Building Footprints;
subdivision information; parcel number; and to what planning jurisdiction the property belongs. Clicking on the hyperlink ―Surveys, Plats & Deeds‖ would take the user to the
Wake County Register of Deeds website Books where they could type in the parcel
number and view ownership information and digitized versions of deeds (Figure 15).
Figure 15: Wake County Register of Deeds website
In April 2010, the City of Raleigh and Wake County GIS rolled out an improved
iMAPS web application in beta (Figure 16). In July 2010, the ―new‖ iMAPS site became the main application while the ―old‖ iMAPS was planned to be retained until the end of
July. The newer version is hosted on the City of Raleigh government server.
The improvements made included:
Link to the Wake County Real Estate website with your selected parcel‘s record
selected
Link to the Register of Deeds application showing scanned documents available
for the selected parcel
Links to related websites from within the application
Measure Distance & Area Tools
Print to PDF
Print to Scale
Spatial Bookmarks
Resizeable Map (when you click the arrow between the map and the search panel,
the map will resize to fill the whole screen)
Improved cartography
Improved Searching:
o Improved Address Search
o Improved Find Intersection Tool
o Search by Subdivision
o Search by Common Place Name (RBC Center for example)
Latitude & Longitude (reported as you scroll over the map)
Intuitive navigation
Improved Help Document
Property details are displayed in a side toolbar when a property is selected (Figure
17). Users can toggle on other layers. Clicking on a location‘s icon will bring up a
pop-up with more information (Figure 18).
Figure 17: Downtown Raleigh (the North Carolina Executive Mansion selected)