TABLE OP CONTENTS
Section Title Page No
1.0 Abstract... 2
2.0 Introduction... 3
3.0 Cyclone Theories... 5
4.0 What is Natural Length?... 10
5.0 Experimental Apparatus and Procedure... 13
6.0 Results and Discussion... 25
7.0 Limitations of this Study and Recommendations... 32
8.0 Conclusions... 33
9.0 References... 34
1.0 ABSTRACT
This study is part of a larger investigation attempting to
understand gas flow patterns within a cyclone. For the first time,
a flow visualization method, using a bubble generator, was utilized
to illuminate the gas flow patterns in a cyclone for a certain
range of gas flowrates and design configurations. The main
objective of this study is to investigate the presence of natural
length and the effect of selected cyclone parameters on it. In
addition, the effect of these parameters on the number of turns
formed in a cyclone was also studied. The flow visualization
experiments were recorded on a VHS video cassette.
Thus, this study hopes to contribute towards a better
2.0 INTRODUCTION
Cyclones are very simple separation devices that are used to
remove dust particles, mostly from gases and sometimes from
liquids. This study concentrates on gaseous fluids. Cyclones have
found extensive use in a wide range of engineering processes, for
more than a hundred years. Some common applications are in
coal-based power plants, grain handling in agricultural processes,
woodworking factories, and oil refineries.
The operation of cyclones can be extended to high temperature
and high pressure conditions by simply using appropriate materials
of construction. They can also handle high dust loadings (with an
increase in efficiency) and high throughputs. It is this
versatility of cyclones that makes them a widely used device for
gas cleaning. However, the separating capacity of cyclones is
limited to particles down to only about 5 microns in size.
Consequently, for particles of size below about 5 microns, they
have to be used in conjunction with other cleaning devices. In air
pollution control operations, they are often used as precleaners.
The various structural components of a conventional reverse
flow cyclone are (i) a gas inlet, (ii) a gas outlet, (iii)
cylindrical body section, (iv) conical section, (v) a dust outlet,
and (vi) a dust hopper. The most commonly used cyclone has a
tangential gas inlet. A schematic diagram of cyclone compenents
is shown in Figure 1. The relative proportions of all the above
i
---,---1
1 ^
!
1
I iI
1
1
1
s
1 t 1
1
\, —---,
V
''
H
3.0 CYCLONE THEORIES
The separation in cyclones is largely brought about by the
centrifugal force imparted to the particles by the spinning motion
of the gas. The gas enters the cyclone via an entry duct that is
usually tangential to the body of the cyclone (Figure 2).
Sometimes a scroll entry is used (Figure 3) . It is generally
understood that the gas forms a downward moving outer vortex in the
annulus above the gas outlet duct. The vortex narrows as the gas
goes down the body of the cyclone. There is a second inner vortex
that flows upward and out of the gas exit duct.
As simple as it appears, the design of a cyclone is still
largely empirical. There is yet to be a "first principle" design
technique. The gas flow within a cyclone is extremely complex and
incompletely understood. However, the research works of ter Linden
(1949), Stairmand (1951), Lapple (1940) and Alexander (1949) in the
past, have contributed greatly to the understanding of cyclones.
In recent years, the works of Leith (1979, 1985) and others have
helped build on this earlier body of research.
The ultimate goal of a design technique for cyclones is to
predict accurately the collection or separation efficiency. The
collection efficiency "i^" is defined as that fraction of particles
of a certain size, which are collected by the cyclone. It is also
termed as "fractional efficiency." The fractional efficiency for
various particle sizes yields the fractional efficiency curve.
PlG.'^.C^CLOU^ CnTRY - HaLP OCHOLL
shape. One crucial estimator of efficiency is the "cut diameter,"
or "cut point" which is the particle size corresponding to a
cyclone efficiency of 50%.
The objective of any cyclone theory is to be able to predict
accurately the efficiency for particles of all sizes. A number of
relationships are available from the studies of Rosin et al.
(1932), Stairmand (1951), Lapple and Shepherd (1940), Davies
(1952), Barth (1956), Leith and Licht (1972), Dirgo and Leith
(1985), Theodore and de Paolo (1980), and lozia and Leith (1988).
The latter study uses a logistic model for cyclone efficiency to
show the relationship between various cyclone dimensions and
collection efficiency for particles of all sizes. This study has
been shown to predict djQ better than the preceeding theories. The
expression for dgg is:
1/
dso = { (9 U Q)/(Pp Z, Y,^^^) }2
where Q = gas flow rate
u = gas viscosity
^tmax ~ maximum tangential velocity
p = particle density
Zj, = cone length or natural length.
The term "Z^" that appears in the above equation is the topic of
this study. It is evident that accurate prediction of 6.^^ requires,
in turn, an accurate prediction of V^^^ and Z^. V^^^ is presently
evaluated from the following empirical relation (lozia and Leith,
1988), while Z^. is determined geometrically.
Vtmax = 6.1 V. (ab/D2)0-61 (D,/D) "^-^^ (H/D)'^-^^
V,. = inlet gas velocity a = height of gas inlet
b = width of gas inlet ^e ~ ^^^ exit duct diameter
D = cyclone diameter H = overall cyclone height. The length of the core is defined by Barth (1956) as the distance
from the bottom of the gas outlet to the base of the cyclone, H-S
(refer Figure 1) . Dirgo and Leith (1985) interpreted the core
length to be the distance from the bottom of the gas outlet to the
intersection of the cylindrical core with the cone wall, a distance
that can be less than (H-S) if the core diameter is greater than
the dust outlet diameter B. Alexander called it the "natural
length." A systematic investigation of natural length (Z^.) has
been lacking. A better understanding of natural length and
improved methods for its estimation are necessary to enhance the
design techniques for cyclones. Such an understanding will also
contribute towards the overall comprehension of flow patterns
within a cyclone. Hence, the investigation of natural length and
its dependence on some geometric and flow parameters of the cyclone
is the main objective of this study.
This study is divided into two parts. Part I deals with the
experimental investigation of natural length, while Part II
concerns the study of the number of turns made by a gas streamline
inside the cyclone and correlates it to gas flowrate and the inlet
4.0 KHAT IS NATX7RAI. LENGTH?
It is already known that the gas forms a vortex as it enters
the cyclone. The pressure is high throughout the cyclone, but
there exists a core of low pressure that extends the full height of the cyclone (ter Linden, 1949) . Below the gas outlet, the
spinning gas gradually migrates to this core of low pressure.
Within the core, the flow is upward. As the gas spirals down the
length of the cyclone, more and more of it is drawn off into this
central core and removed. At a certain point in the cyclone, all
the gas will be drawn into the core. This is the point of total
flow reversal, because there is no more gas flowing beyond this
point. The distance from the bottom of the exit duct to the point
of flow reversal is defined as the "natural length" of the cyclone.
This term was coined by Alexander (1949). He defined natural
length as the distance below the bottom of the exit pipe where the
vortices naturally turn (refer Figure 4).
Alexander states that the natural length is dependent only on
the proportions of cyclone inlet and outlet, irrespective of
gasflow over a wide range of values. He also proposed an empirical
relationship to estimate natural length (Z^) .
Z^ = 2.3 D^ (D^/ab)°-^^
where D^ = gas outlet diameter
D = barrel diameter
a = gas inlet height
b = gas inlet width
J Dus>T Hopper^
NATURAL. ieN&TH
Tig. 4 (qQ- CotscgpT^A^ d)ag-RAM snovjirvcr
NATURAL ^GNCrr^l C>^C-SS THAfM ToTAU /-^NG-TH
DMSr HDPP(5 fi.
NATURAL /.ENGTH
FiGr. itW"- CoNCtPTUA^ j:>;a^ra)M showing.
TOJAi-ͣ
i^^^S^P'
It is evident from the definition of natural length that it
actually signifies the functional length of the cyclone. Beyond
the natural length, there will exist a stagnant zone where no
separation of particles from the gas takes place. Hence, an
optimal design requires that the overall length of the cyclone not
exceed the natural length significantly, to avoid the existence of
a stagnant zone. On the other hand, a cyclone that is shorter than
its natural length will not achieve full separation potential.
The experiments that led Alexander to the equation of natural
length are not clear from the literature. Furthermore, no
additional experimental work has been reported in the last 40 years
to substantiate or report the idea of natural length, or to
substantiate its dependence on inlet and outlet dimensions. Hence,
the purpose of this study was to investigate the dependence of
natural length on gas inlet and outlet dimensions and on gasflow.
5.0 EXPERIMENTAL APPARATUS AND PROCEDURE
The cyclone used in this study was constructed from clear
acrylic and polycarbonate plastic (see photograph in Figure 5) .
All its components were detachable and interchangeable. The overall height of the cyclone, and the diameter of the cyclone barrel were maintained constant throughout the experiments. The cyclone was fitted at the bottom with a dust hopper, also made of
clear acrylic.
Three sizes of outlet ducts and six kinds of inlets (all
tangential) were used in this study. The air flowrate in the
cyclone was controlled using a magnehelic pressure controller and
a fan (see photograph in Figure 6) . In general, the cyclone
dimensions conformed to the Stairmand high efficiency design except
for changes in inlet and outlet dimensions.
Part I - Method for Detection of Natural Length;
During the initial phase of this study, numerous attempts were
made to detect indirectly the point of flow reversal. The devices
that were used in these trials to track air flow included: (i)
smoke tubes, (ii) titanium tetrachloride fumes, introduced into
the cyclone through a perforated steel capillary, and (iii) a fine
perforated rod, threaded crosswise with numerous silk filaments along its length.
However, the above tests were not successful in reliably
recording the point of flow reversal. Hence, a better method had
to be developed to track air flow patterns and clearly reveal flow
FlC>. 6 Photo GrRAPH ^HOWtNG.
'Thg Mag-hahcuc PRessufie
reversal. Such a method was found in the use of neutrally bouyant
bubbles that follow air streams. Soap bubbles filled with helium
gas were introduced into the cyclone through the air inlet duct,
and the track of bubbles was illuminated using a strobe. The
illuminated flow patterns were filmed using a video camera and
recorder. A more detailed description of the apparatus is given
below. The experimental set-up is shown in Figure 7. Figure 1
shows the different dimensions of the cyclone.
The SAI Bubble Generator (model 3), manufactured by Sage
Action Inc., was used in these experiments (see photograph in
Figure 8) . This device generated helium-filled bubbles of sizes
between 1/16" and 1/4" diameter. The head from which the bubbles
were produced, consisted of three concentrically arranged tubes.
Helium passed through the inner tube, while the soap solution
flowed through the intermediate tube, thus forming helium-filled
bubbles at the tip. Air passing through the outermost tube
provided the thrust to blow the bubbles from the tip.
A continuous stream of bubbles could be formed and controlled
from the console of the bubble generator. The console (see
photograph in Figure 9) housed the valves that metered flow of
helium, air and bubble soap solution to the head. Micrometer
scales were provided on these valves to reproduce desired
flowrates.
A cylinder of compressed helium supplied the gas at a pressure
of about 22 psig. Compressed air was provided at a pressure of 26
psig. The bubble film solution was made using the liquid soap
t
To P'AH(p3
C^CiLoNfc
f>uST
HoPPeR
Sr«oB6
CUBBke
H
GreHe«.ATO«
K/?CA/ ComPR.esS6D MR une
Heu OM
T^i^iK
a^
9 :
S
Fig-. 8 Photo&rkpw Showing- The Bobb^
€
fi
fV^J PHoTo&-RAr?H SHOWING- -THE CoHSOi-.? OF
THB Buse.ur GeNe RAT07? vo\th aal
thg-CoK-7ftc>u vAi^veS. Thg- HeAb Resr ON ToP.
"Joy." The bubbles were introduced in the cyclone at an average
rate of about 150 bubbles per second. The bubble generator head
(nozzle) was supported on a long narrow stem (see photograph in
Figure 10). During a flow visualization experiment, this stem was placed inside the inlet duct of the cyclone so that the bubbles
were entrained into the air stream, just inside the inlet.
A strobe was placed at the bottom of the cyclone, just below the dust hopper (see photograph in Figure 11). Since the entire cyclone was made of clear acrylic, the strobe light illuminated the bubbles as they followed the air streamlines within the cyclone. The farthest point in the cyclone, where the outer vortex reversed
direction and turned upward, was measured as the natural length.
Six different inlets and three sizes of outlets were used in
this study. Each of these combinations was in turn studied at five
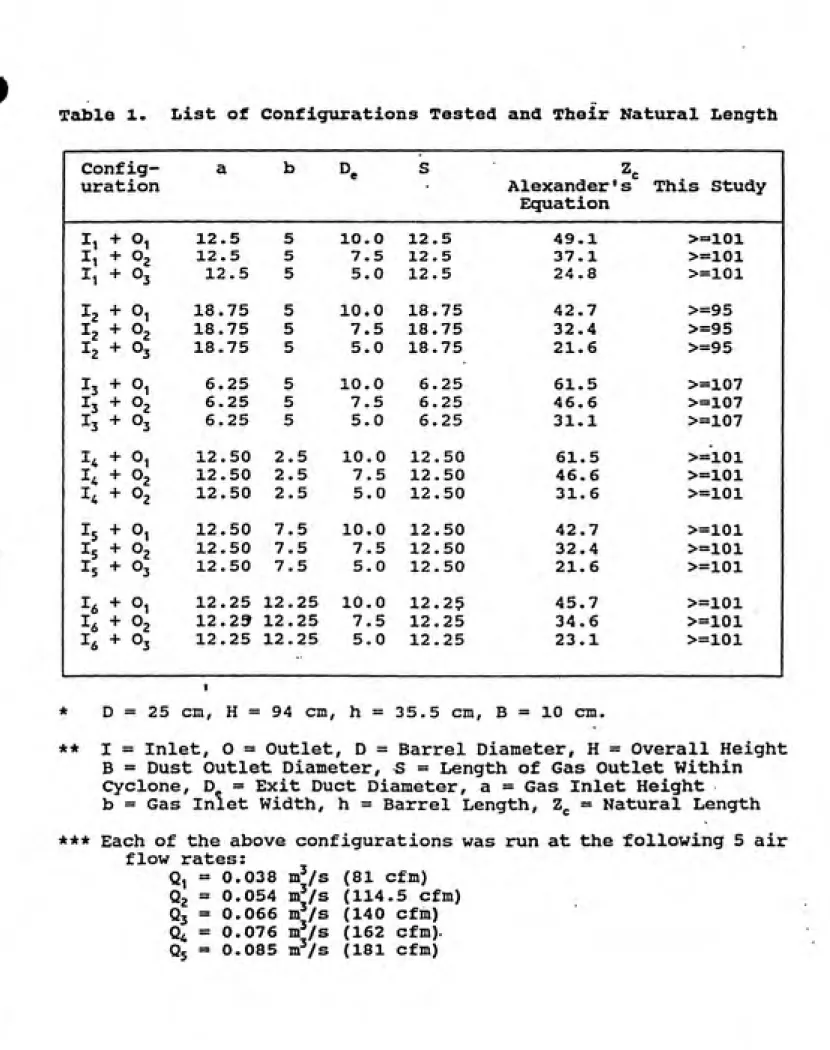
different air flows. The configurations and flows tested are listed in Table 1.
Part II - Method for Determination of Number of Turns and Velocity;
In this part of the study, the same set-up as that of Part I was used. This time, the number of turns made by the gas was observed and visually estimated from the recorded image on the
video cassette, for 7 different inlet and outlet duct combinations,
at a gas flow of 0.054 m^/s (114.5 cfm).
For each configuration used in this part, the cyclone was divided into four sections. The picture on the video screen was
paused, then the frame advance feature was used to track the number of tracks made by a chosen streak of bubbles. This process was
r ill—tiilll^B
Table 1. List of Configurations Tested and Their Natural Length
Config¬ a b D. S ͣ ' .-Td..^^ 'Z,
uration Alexander's This Study
Equation
i ^1
ͣ
*
ͣ
O1 12.5 5 10.0 12.549.1 >=101 Ii + 0? 12.5 5 7.5 12.5
37.1 >=101
h + O3 12.5 5 5.0 12.5
24.8 >=101
h + O1 18.75 5 10.0 18.75
42.7 >=95 I2 + 0? 18.75 5 7.5 18.75
32.4 >=95
I2 + O3 18.75 5 5.0 18.75
21.6 >=95
h + Ol 6.25 5 10.0 6.25
61.5 >=1D7
^3 + 02 6.25 5 7.5 6.25
46.6 >=107
h + 03 6.25 5 5.0 6.25
31.1 >=107
I4 + 01 12.50 2.5 10.0 12.50
61.5 >=101
^4 + 02 12.50 2.5 7.5 12.50
46.6 >=101
I4 + 02 12.50 2.5 5.0 12.50
31.6 >=101
I5 + O1 12.50 7.5 10.0 12.50
42.7 >=101
^5 + 0? 12.50 7.5 7.5 12.50
32.4 >=101 I5 + O3 12.50 7.5 5.0 12.50
21.6 >=101
^6 + O1 12.25 12.25 10.0 12.25
45.7 >=101 ^6 + 0? 12.29 12.25 7.5 12.25
34.6 >=101
l6 + O3 12.25 12.25 5.0 12.25
23.1 >=101
D = 25 cm, H = 94 cm, h = 35.5 cm, B = 10 cm.
** I = Inlet, 0 = Outlet, D = Barrel Diameter, H = Overall Height
B = Dust Outlet Diameter, S = Length of Gas Outlet Within
Cyclone, D^ = Exit Duct Diameter, a = Gas Inlet Height
b = Gas Inlet Width, h = Barrel Length, Z^. = Natural Length
*** Each of the above configurations was run at the following 5 air
flow rates:
Q, = 0.038 m^/s (81 cfm)
Q2 = 0.054 m^/s (114.5 cfm)
Q3 = 0.066 m^/s (140 cfm)
Q^ = 0.076 m^/s (162 cfm).
repeated for each section and the cumulative number of turns made
by the gas in the cyclone was estimated. Four counts of turns was
made for each each configuration. Analysis of variance was done
to estimate the statistical significance of the effect of
configuration on the number of turns.
It was evident from the video recording that the speed of
turns changed for different configurations. Though the film was
recorded in real-time, the high degree of parallax present in the
videotaped image made it impossible to make actual estimates of
angular velocity. Instead, the vertical speed (^) was estimated
for all configurations, i.e., the vertical distance traveled by a
bubble track in one second was measured.
This parameter was used to compare various test
configurations. To estimate this parameter, a section of the
cyclone was selected. At a flowrate of 0.054 m^/s (114.5 cfm) , the
video image of the flow was frozen on the T.V. screen. A track of
bubbles was chosen and advanced frame by frame on the screen. The
vertical distance travelled by the track was directly measured from
the T.V. screen. The video tape recorder had been previously
calibrated to find the time elapsed between two frames. Also, the
distance between two chosen points on the cyclone was directly
measured from the screen, and compared with the actual distance
between these two points, as measured during experimentation. This
comparison provides the magnification factor of the T.V. screen.
This magnification factor was then used to convert the vertical
distance traveled by the track on the screen to the actual distance
in the cyclone. An average of four readings was taken for each configuration.
Magnification Factor = Length Measured on T.V. Screen Actual Length Measured on Cyclone
The vertical velocity (j2f) was then estimated as:
= Actual Vertical Distance Traveled by a Bubble Track per __________________Frame (cm)_________________________
Elapsed Time Between Two Frames (sec)
6.0 RESULTS AND DISCUSSION
Part I - Natural Length:
The findings of this part of the study are shown in Table 1.
The flow visualization studies for the various inlet and outlet
configurations yielded the following results:
1. The bubbles clearly verified the presence of the outer
downward-flowing vortex.
2. A faster, upward-flowing, vortex was also observed at the core
of the cyclone.
3. The flow reversal occured all the way at the bottom of the
dust hopper. Z^ was estimated by taking the difference
between the entire length of the cyclone and the height of the gas inlet. These values are shown in column 7 of Table 1.
4. The point of flow reversal did not change with change in gas
flow.
5. The point of flow reversal remained the same for all inlets and outlets tested.
6. Comparison of the experimental results with Alexander's
empirical relationship for natural length (Table 1) shows that
the equation Z^ = 2.3 D^ (D^/ab)^^^ consistently
underestimates the natural length. Part II - Number of Turns:
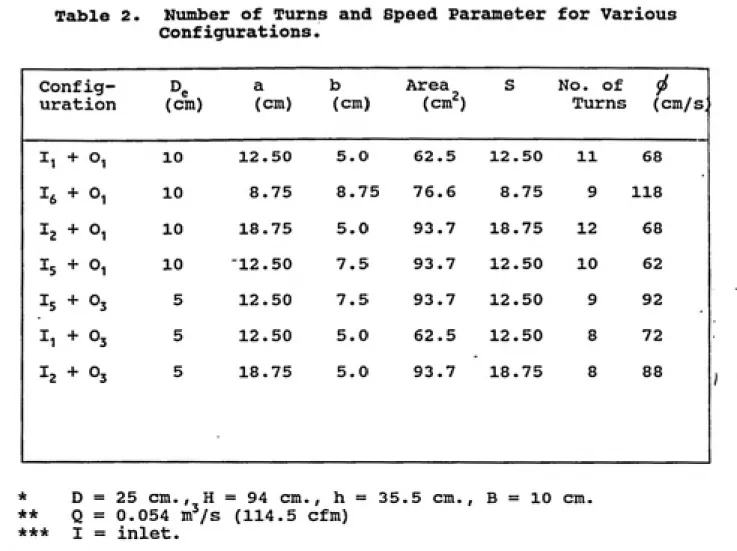
The findings of Part II, i.e., the number of turns and
estimation of speed parameter for the seven configurations selected
are given in Table 2. The signifcant observations are:
Table 2. Number of Turns and Speed Parameter for Various
Configurations.
Conf urat
ig-ion (cm)
a
(cm)
b (cm)
Area
(cm^)
S No. of
Turns (cm/s)
i^ 1
^1 + O1 10 12.50 5.0 62.5 12.50 11 68
^6 + O1 10 8.75 8.75 76.6 8.75 9 118 1, + Oi 10 18.75 5.0 93.7 18.75 12
68
I5 + O1 10 12.50 7.5 93.7 12.50 10 62 I5 + O3 5 12.50 7.5 93.7 12.50 9 92
^1 ^ O3 5 12.50 5.0 62.5 12.50 8 72 I2 + O3 5 18.75 5.0 93.7 18.75 8 88
* D = 25 cm., H = 94 cm., h = 35,5 cm., B = 10 cm.
** Q = 0.054 m^/s (114.5 cfm)
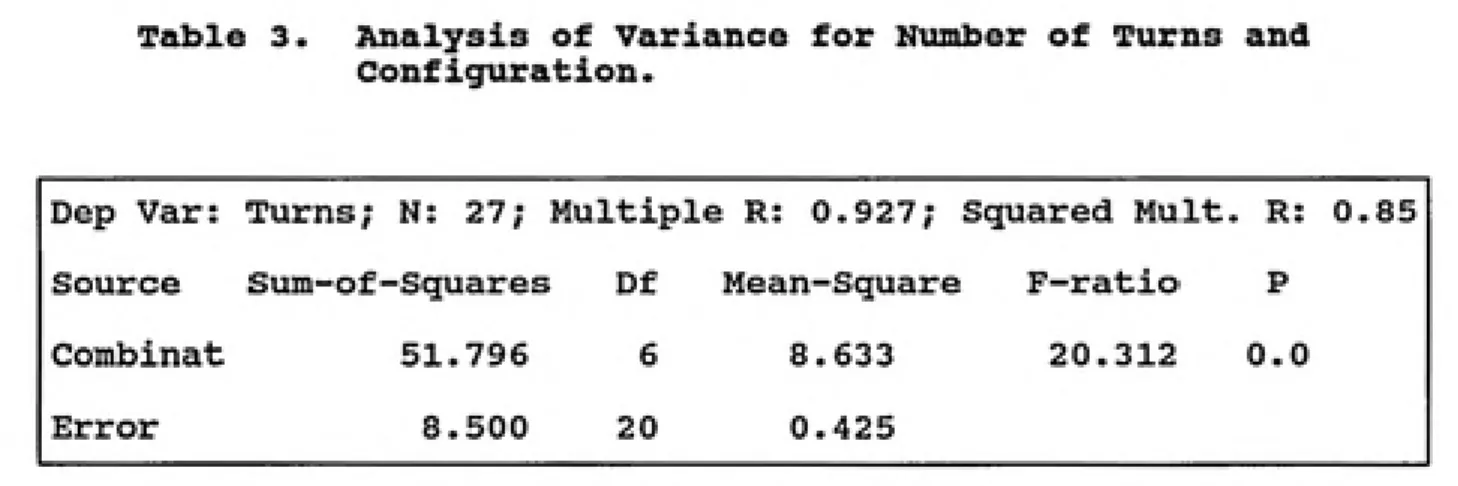
1. Analysis of variance done for the various configurations
tested and number of turns obtained, shows that the
configuration has significant effect (p=0.00) for the inlets
and outlets studied (refer to Table 3).
2. Configuration also has a significant effect on the vertical
velocity (p=0.00), when statistical significance was tested
(refer to Table 4).
3. The vertical velocities were consistently lower for the bigger
exit duct (Dg = 10 cm) than for the smaller exit duct (D^ = 5
cm). For the inlet configuration I^, turns were estimated
only when used in conjunction with outlet O^. The comparable
value for the conbination I^ + Og was not obtained, because the
turns formed in this case were too fast to be counted.
4. The vertical velocities were found to be close for the
combinations (I5 + O3) and (Ij + O3) . Both these inlets, I5 and
I2 have the same cross-sectional area, 93.75 cm^.
Discussion;
The most significant finding of the natural length study was
that, for all the configurations used, the flow reversal was seen
well below the dust outlet, at the base of the hopper. This
finding raises two questions:
(i) Does that part of the core vortex within the dust hopper have
dust separation potential?
(ii) Would the point of flow reversal extend still further if the
length of the cyclone was increased?
It would now seem that the "natural length" observed in these
Table 3. Analysis of Variance for Number of Turns and
Configuration.
Dep Var: Turns; N: 27; Multiple R: 0.927; Squared Mult. R: 0.85 Source Sum-of-Squares Df Mean-Square F-ratio P
Combinat 51.796 6 8.633 20.312 0.0
Error 8.500 20 0.425
Table 4. Analysis of Variance for Vertical Velocity and
Configuration.
Dep Var: Factor; N:29; Multiple R:0.847; Squared Mult. R: 0.72
experiments is actually an "artificial length" occuring due to the
obstruction posed by the base of the hopper. It may not have been the point where the vortices would "naturally" have reversed.
If part of the vortex within the hopper has separating
potential, then it also follows that the efficiency of the cyclone
could be increased by increasing its length, or changing the core
to barrel ratio. Otherwise, the turning vortex within the hopper
will lead to re-entrainment of dust from the hopper into the gas stream. It is necessary to corroborate the results of this study
by measuring the operational efficiency of these configurations
when dust-laden gas is processed through the cyclone.
The point of flow reversal did not change at different gas
flows. This is in keeping with Alexander's statements on natural
length. Since no change in the point of flow reversal was detected when the configurations or gasflow was changed, the conclusion drawn is that natural length, if it is different for different
cyclones, would depend on the total length of the cyclone. The total length of the cyclone was not changed in this study. The
ratio of barrel length to cone length, h::(H-h) (see Figure 6) may
also change the point of flow reversal. The effect of cyclone
total length and cone to barrel ratio should be investigated in
future studies.
In addition to these findings, the results of Part II suggest
that outlet and inlet dimensions affect the number of turns made
by the gas in the cyclone. Vertical velocities also changed with
change in outlet and inlet dimensions. An examination of the
values in Table 2 shows that the number of turns is higher for the larger outlet O^, while the vertical velocities are lower. The
bigger outlet duct has a larger cross-sectional area, hence, it
will lead to lower exit velocities of the gas, thus contributing
to the reduction in velocity.
However, it should be noted that vertical velocity is not the
only component, or even the major component of gas velocity in the
cyclone. Hence, the actual effect of reducing the outlet dimension
cannot be accurately known unless information is also available on
the radial and tangential components of the velocity. Ter Linden
(1949) and Alexander (1949) have also stated in different studies
that, smaller outlet ducts lead to faster vortices, and hence, a
higher pressure drop. In this study, it was difficult to detect a discernible trend in vertical velocities as a function of inlet cross-sectional area.
The values of natural length, as estimated from Alexander's
equation are significantly lower than the results of this study.
Alexander' s equation gives values of Z^. which decrease in
proportion with smaller outlet ducts and larger inlets. This
effect was not observed in this study. It is evident from Alexander's description of his experiments, that the method used to detect natural length was the introduction of water droplets
into a clear glass cyclone with an adjustable cone. The furthest
tracks made by the water droplets hitting the wall of the cyclone
was then arbitrarily defined as the natural length. At least one
problem, inherent in using this method, is that water drops being
much heavier than air, will be thrown against the cyclone wall long
before they follow the entire path of an air stream. This
introduces a "sling" factor for the drops/bubbles used to track the
air stream. The sling factor will be proportional to the density
difference between the drops/bubbles and air (or gas). In this
study, the use of neutrally buoyant helium filled soap bubbles
virtually eliminated the sling factor. This sling factor could
account for the lower values of Z^. predicted by Alexander. The
main conclusion of this study is that the effect of inlet and
outlet dimensions on natural length is not as significant as stated
by Alexander.
7.0 LIMITATIONS OP THIS STUDY AND RECOMMENDATIONS
Limitations;
Some of the limitations of this study are:
1. This study was restricted to testing the effects of gas outlet
and inlet dimensions on natural length. The basic design of
the cyclone was confined to the Stairmand high efficiency
configuration.
2. The range of air flowrates used was limited by the capacity of the fan.
3. At higher air flowrates, it was difficult to track the bubbles
visually. A light source more intense than the strobe, such as a laser beam, may be able to illuminate these tracks more
effectively.
4. The diameter of the barrel and the height of the cyclone were
invariant throughout the study.
Recommendations;
Some recommendations are:
1. The inlets and outlets used in this study should be further
tested with various core and barrel ratios.
2. The study should be extended to include efficiency tests on the configurations used.
3. Another parameter important to natural length estimation is
barrel diameter. Further studies on the effect of this
variable on Z^, are necessary.
8.0 CONCLUSIONS
This study concludes that the inlet and outlet dimensions do
not affect natural length, for a constant total lentgh of a
cyclone, as was proposed in the studies of Alexander (1949). Gas
flow does not affect natural length either. The number of turns
and the vertical velocity of the gas change with change in inlet
and outlet dimensions.
Flow visualization using naturally buoyant bubbles has great
potential for providing further insights into the complex flow
patterns within a cyclone. Further study, using a more
sophisticated version of the bubble generator device, and a laser
light source, is already underway. This study has set the
precedent for the use of a flow visualization method in the
characterization of cyclone performance.
9.0 REFERENCES
1. Abrahamson, J., Martin, C.G., and Wong, K.K. Trans. Inst.
Chem. Eng., 56, 168-176 (1978).
2. Alexander, R. McK., Proc. Australian I.M.M., (1949).
3. Barth, W., Brennstoff-Warme-Kraft, 8, 1-9 (1956).
4. Dirge, J.A., and Leith, D., Aerosol Sci. Technol., A, 401-405
(1985).
5. lozia, D.L., Ph.D. Thesis, University of North Carolina,
Chapel Hill (1988).
6. lozia, D.L., and Leith, D., Submitted to Aerosol Sci.
Technol., (1988).
7. Leith, D., and Licht, W., AIChE Symp. Series No. 68, p. 196
(1972) .8. Leith, D. , in Handbook of Environmental Engineering, Humana
Press (1979).9. Rosin, P., Rammler, E., and Intelmann, W., Zeit. Ver. Deutsch.
Ing., p.433 (1932).
10. Shepherd, and Lapple., Ind. Eng. Chem., 972-984 (1939).
11. Stairmand, C.J., Engineering, p.356 (1951).
12. Stern, A.C., Caplan, K.J., and Bush, P.O., Cyclone Dust
Collectors (1955).
13. Swift, P. Filtration and Separation, 24-27 (1986). 14. Ter Linden, A.J., Engineering, 165-168 (1949).
10. ACKNOWLEDGEMENT
I would like to thank my thesis advisor. Dr. David Leith, for
his support and guidance in the research and preparation of this
technical report. I am also thankful to Drs. Michael Flynn and
Francis Digiano for their valuable suggestions during the
preparation of this report.
I am especially grateful to my husband, Venu Menon, who has
been a constant source of inspiration and assistance.
This project was supported by a research grant from the
Department of Energy.