Social Predictors of Diet Quality in Galapagos, Ecuador
By Elijah Watson
Senior Honors Thesis Department of Anthropology
University of North Carolina at Chapel Hill
2019
Approved:
Amanda Thompson, Thesis Advisor
Mark Sorensen, Reader
ACKNOWLEDGEMENTS
First, I would like to thank Dr. Amanda Thompson for her guidance and support
throughout my summer research internship and honors thesis. I also want to thank Dr. Margaret
Bentley and Dr. Mark Sorensen for serving on my committee and providing their feedback on
my work. I also would like to Chelsea Philyaw and my family for their unending support
throughout the entire process.
Direct support for my summer research internship at CPC was provided by the Office of
the Vice Chancellor for Research at the University of North Carolina at Chapel Hill. The CPC
summer undergraduate internship program also received support from the Population Research
Infrastructure Program awarded to the Carolina Population Center (P2C HD050924) at The
University of North Carolina at Chapel Hill by the Eunice Kennedy Shriver National Institute of
Child Health and Human Development (NICHD). Additionally, this research was supported by
Table of Contents
1. List of Abbreviations
2. Introduction
3. Research Questions & Study Aims
4. Methods
5. Results
6. Discussion
7. Limitations
8. Conclusion
List of Abbreviations
OWT/NCD (Overweight and non-communicable disease)
UW/ID (Underweight and infectious disease)
ENSANUT-ECU (National Health and Nutrition Survey-Ecuador)
DQI-I (Diet Quality Index-International)
Introduction
Located roughly 600 miles off of the coast of Ecuador, Galapagos is best known for its
biodiversity. The archipelago consists of fourteen volcanic islands, four of which are currently
home to a total of 25,244 residents (INEC, 2015). Ninety-seven percent of the geographic area of
the Galapagos is a designated national park, with only a small and increasingly populated area
available for human habitation (Parque Galapagos, 2011). The population of the islands has
increased by more than 300% in recent decades (Larrea, 2008). Additionally, tourism and
migration have fueled rapid economic, environmental, and demographic change in the Galápagos
Islands, resulting in new pressures on human health and changing food systems (Walsh et al.,
2010; Walsh & Mena, 2013). However, outdated water and sanitation systems along with
inadequate water quantity have led to poor water quality with residents often resorting to
imported water and external cistern storage. Furthermore, residents primarily rely on food
shipped from mainland Ecuador, much of which is processed and can contribute to poor health
(Walsh et al., 2010; Walsh & Mena, 2013).
The economic development and social changes being experienced in low- and
middle-income countries, such as Ecuador, are often associated with an increase in the prevalence of
overweight, obesity, and noncommunicable diseases (OWT/NCD) (Popkin, Adair & Ng, 2012).
However, under-nutrition and infectious diseases (ID/UND) continue to exist due to considerable
geographic, socioeconomic and demographic variability in these changes. Economic- and
development-associated changes in diet outpace changes in infrastructure for food, water, and
sanitation systems. Therefore, individuals can be exposed both to high-fat, energy-dense diets
and to pathogens associated with poor water quality and inadequate sanitation. These factors
Research has shown that the dual burden not only varies across in populations (Griffiths
& Bentley, 2001), but also within households and individuals (Doak et al. 2000; Doak et al.,
2005). For example, within a household, a parent may be overweight while their child is stunted.
An individual may be both overweight due to an unhealthy diet and stunted due to micronutrient
deficiencies. Cross-national comparisons suggest that greater household income and urbanization
contribute to the dual burden of nutritional disease in middle-income countries (Tzioumis &
Adair, 2014; Doak et. al 2005). Studies have shown an increasing co-occurrence of overweight
mothers and stunted children in lower income, rural indigenous households in Guatemala and
Mexico (Fernald & Neufeld, 2007; Lee et al., 2010). Within Ecuador, Galapagos has the highest
rates of obesity in all age groups amongst all provinces, while levels of stunting, (11% in
children younger than five) and micronutrient deficiencies of iron (16% in children younger than
five) and zinc (57% of reproductive age women) are common (Freire et al., 2013; Freire et al.,
2015).
These findings highlight the pressing need to study the social patterning of this dual
burden in Galapagos and other low- and middle-income countries. However, the effects of poor
water and diet quality exposures and the underlying social determinants of poor health are
difficult to distinguish. Demographic and socioeconomic factors have been shown to be
associated with differences in diet quality (Darmon & Drewnowski, 2015; Alkerwi et al., 2015;
Chong, Appannah, & Sulaiman, 2019). Composite indices are preferred in nutritional
epidemiology over those that are based on a specific nutrient or food group because of the
varying factors that contribute to diet quality (Gerber, 2001 & Kant, 1996). The Diet Quality
Index-International (DQI-I) was chosen to assess diet quality in this study because it was created
obesity and metabolic diseases (Kim, Haines, Siega-Riz, & Popkin, 2002). The DQI-I takes into
account dietary variety, adequacy, moderation, and balance in order to provide a nuanced
understanding of factors contributing to overall diet quality.
This study specifically focuses on the social predictors of diet quality and dietary
adequacy in Galapagos. Additionally, the social predictors of adequate intake of calcium and
iron are examined in respondents ages 18 or younger. Adequate intake of iron has been linked to
healthy cognitive development in children in the nutritional epidemiology literature, while poor
intake of calcium has been linked with stunting (Lozoff 1988; Pollitt 1993; Stuijvenberg et al.,
2015). The few studies on human health in Galapagos indicate that obesity and overweight are
amongst the most pressing public health challenges facing the islands (for example, Friere 2018;
Page, Bentley & Waldrop 2013). The unique challenges that Galapagos faces will change as the
islands continue to grow and change, creating new pressures on human health and food systems
and exacerbating existing inequalities. The findings from this study can provide evidence for
future research on the social patterning of the dual burden in Galapagos that examines how social
Research Questions & Study Aims
This study uses quantitative methods to address the following research question:
• What are the socioeconomic predictors of overall diet quality and dietary adequacy in
Galapagos, Ecuador?
Understanding the social determinants of diet quality and dietary adequacy is important
for informing interventions and policy responses in Galapagos that aim to improve diet
quality and nutritional health. It is hypothesized that rural household location, food
insecurity, and lower socioeconomic status will predict lower diet quality and adequacy.
To address these research questions, this study investigates the following four aims:
Aim 1 Describe the socioeconomic factors and dietary characteristics of the overall sample.
Aim 2 Examine the socioeconomic predictors of diet quality and adequacy in the overall sample.
Methods Sample
Data came from the nationally-representative Encuesta Nacional de Salud y Nutrición
(ENSANUT-ECU) 2012 (Freire et al., 2013). 665 respondents in the Galapagos completed a
24-hour dietary recall survey, a method that is described below. For Aim 1 and 2, the sample
(n=626) only included individuals coming from households with at least one individual under 18
years of age. For aim 3, the sub-sample (n=345) included only individuals ages 18 or younger. In
this study, children are defined as individuals 18 years of age or younger.
Variables and Measures
24-hour dietary recall data
ENSANUT-ECU 2012 used single 24-hour dietary recalls to gather data on diet
behaviors. 24-hour recalls involve an individual recalling every item of food that they ate during
the past day, which is also measured in “serving” or “plate” sizes by the interviewer. 24-hour
due to the likelihood that not everyone will remember every single item of food and the amount
that they ate during the past day (Ma et al. 2009). However, directly observing every individual’s
eating behaviors for hours would be expensive and extremely time-intensive. Therefore,
24-hour recalls are often considered the best tool to assess diet quality in a population (Hébert
2014).
Diet Quality Index
The Diet Quality Index-International (DQI-I) is a tool developed “for exploring aspects
of diet quality related to the nutrition transition (Kim et al. 2003)”. Kim et al. (2003) adapted the
index from the original Diet Quality Index (Patterson et al. 1994). Dietary quality in this index is
composed of adequacy, moderation, and overall balance (see Appendix 1 for detailed scoring
breakdown). Achieving more dietary variety and adequacy results in a higher score, as does
having a well-moderated and more-balanced diet. Kim et al. (2003) developed the index and
demonstrated its effectiveness in comparing diet quality cross-nationally between China and the
United States. Mariscal-Arcas et al. (2007) adapted the index to Mediterranean context to assess
diet quality among young people in Southern Spain
The variety sub-component is based on the variety according to five major food groups
(meat/poultry/fish/eggs; dairy/beans; grain; fruit; vegetable) as well as within protein-group
variety (meat, poultry, fish, dairy, beans, eggs). The adequacy component assesses servings of
fruits, vegetables and grains, in addition to adequate intakes of fiber, protein, iron, calcium and
vitamin C relative to Dietary Reference Intakes and Daily Recommended Amounts, which may
vary by age and gender. Adequacy of protein is scored based on the percentage of energy
sub-component scores for iron, calcium and vitamin C are based on the respective recommended
daily allowances, reference nutrient intakes, and adequate intake amounts. Moderation of fat,
saturated fat, sodium, cholesterol, and empty-calorie foods contributed to the moderation
component score. The concept of nutrient density, the ratio of nutrients to energy in a certain
amount of food compared with the recommended intake levels, was used to assess the percentage
of total energy provided from low-nutrient dense or “empty-calorie foods.” The overall balance
component consisted of the ratios of macronutrients and fatty acids. Data on empty calorie foods
were not available; therefore, for this analysis 94 points was the maximum score possible rather
than 100.
Socioeconomic Variables
The sample was distributed across the islands of San Cristobal (the capital city of Puerto
Baquerizo Moreno and the rural town of El Progreso) and Santa Cruz (the urban town of Puerto
Ayora and the rural towns of Santa Rosa and Bellavista). Sociodemographic variables included
both head of household- and individual-level factors. Individual-level characteristics included
sex, age, and self-identified ethnicity (mestizo, indigenous, white, and other). Head of household
variables included migration status (from Galapagos or from elsewhere), education level
(primary or below, secondary, or post-secondary), marital status (married/partnered or not
married/not partnered). Household-level characteristics included a household wealth index,
household size, and household food security.
Statistical Analyses
Statistical analyses were conducted using Stata v. 15.1 (StataCorp, College Station, TX,
and diet characteristics of the respondents. Chi-square analyses were used to test for differences
between socioeconomic factors and dietary variety. Because of the large percentage of maximum
variety scores, for these analyses variety was dichotomized into having either the highest score
or any score less than the highest.
To achieve Aim 2, separate multiple linear regression models were used to identify
socioeconomic predictors of DQI-I and adequacy sub-component scores in the overall sample.
Simple linear regression was used to identify variables for inclusion in the multiple linear
regression models. All of the socioeconomic variables except household wealth index were
included in the models for Aim 2. An interaction term was included between island and
urban/rural to control for inter-island differences. Outliers were removed in order to achieve
normality of residuals. Nine outlier DQI-I scores were removed, resulting in 617 observations for
DQI-I model. From these 617 observations, 9 outlier adequacy sub-component scores were
dropped, resulting in 608 observations for the adequacy model. The results changed minimally
after removal of outliers.
To achieve Aim 3, separate multiple linear regression models were used to identify
predictors of adequate intake of iron and calcium in respondents ages 18 or younger (n=345).
The iron and calcium adequacy sub-component scores are a scaled representation of the
percentage of RDA achieved for each nutrient. For easier interpretability, percentage of RDA
achieved was used as the predictor variable instead of the scaled DQI-I sub-component scores.
Simple linear regression was used to identify variables for inclusion in the multiple linear
regression models. The model for iron included all socioeconomic variables except household
size, household wealth index, and head of household marital status. The model for calcium
outlier calcium adequacy scores were dropped in order to achieve normality of residuals for the
calcium model. Due to the presence of heteroscedasticity, robust standard errors were used for
Results
Sample characteristics: Socioeconomic factors
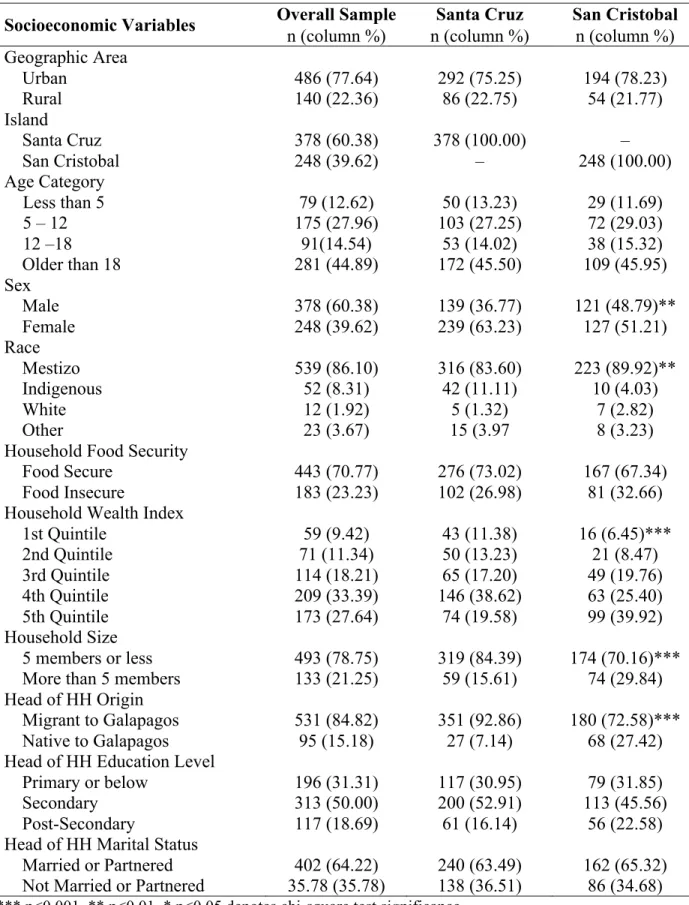
Table 2 shows the socioeconomic characteristics of the overall sample (n=626). The
majority of respondents in the sample resided in urban areas and on the island of Santa Cruz.
55% of respondents were 18 or younger, while 45% of respondents were older than 18. The age
range of respondents was 1-59 years. Approximately 60% of respondents were female and
approximately 86% were of Mestizo ethnicity, with smaller numbers of Indigenous, White, and
Afro-Ecuadorian individuals. Approximately 23% of households were food insecure. 60% of
households were in the two highest wealth quintiles. Household sizes ranged from two to ten and
79% of households had five or fewer members. Approximately 85% of heads of households in
the sample migrated from elsewhere to the Galapagos Islands, 50% had achieved
secondary-level education, and 64% were married or partnered.
Chi-square analyses revealed significant differences between islands in regards to sex,
race (self-identifying as Mestizo versus non-Mestizo), household wealth index, household size,
and head of household location of origin. 63% of respondents in Santa Cruz were women, while
the amounts of women and men in San Cristobal were almost equal. Approximately 84% of
respondents in Santa Cruz and 90% in San Cristobal self-identified as Mestizo. Approximately
25% of respondents in Santa Cruz and 15% in San Cristobal were in the lowest two wealth index
Table 1. Sample characteristics (n = 626)
Socioeconomic Variables Overall Sample Santa Cruz San Cristobal n (column %) n (column %) n (column %) Geographic Area
Urban 486 (77.64) 292 (75.25) 194 (78.23)
Rural 140 (22.36) 86 (22.75) 54 (21.77)
Island
Santa Cruz 378 (60.38) 378 (100.00) –
San Cristobal 248 (39.62) – 248 (100.00)
Age Category
Less than 5 79 (12.62) 50 (13.23) 29 (11.69)
5 – 12 175 (27.96) 103 (27.25) 72 (29.03)
12 –18 91(14.54) 53 (14.02) 38 (15.32)
Older than 18 281 (44.89) 172 (45.50) 109 (45.95)
Sex
Male 378 (60.38) 139 (36.77) 121 (48.79)**
Female 248 (39.62) 239 (63.23) 127 (51.21)
Race
Mestizo 539 (86.10) 316 (83.60) 223 (89.92)**
Indigenous 52 (8.31) 42 (11.11) 10 (4.03)
White 12 (1.92) 5 (1.32) 7 (2.82)
Other 23 (3.67) 15 (3.97 8 (3.23)
Household Food Security
Food Secure 443 (70.77) 276 (73.02) 167 (67.34)
Food Insecure 183 (23.23) 102 (26.98) 81 (32.66)
Household Wealth Index
1st Quintile 59 (9.42) 43 (11.38) 16 (6.45)***
2nd Quintile 71 (11.34) 50 (13.23) 21 (8.47)
3rd Quintile 114 (18.21) 65 (17.20) 49 (19.76)
4th Quintile 209 (33.39) 146 (38.62) 63 (25.40)
5th Quintile 173 (27.64) 74 (19.58) 99 (39.92)
Household Size
5 members or less 493 (78.75) 319 (84.39) 174 (70.16)***
More than 5 members 133 (21.25) 59 (15.61) 74 (29.84)
Head of HH Origin
Migrant to Galapagos 531 (84.82) 351 (92.86) 180 (72.58)***
Native to Galapagos 95 (15.18) 27 (7.14) 68 (27.42)
Head of HH Education Level
Primary or below 196 (31.31) 117 (30.95) 79 (31.85)
Secondary 313 (50.00) 200 (52.91) 113 (45.56)
Post-Secondary 117 (18.69) 61 (16.14) 56 (22.58)
Head of HH Marital Status
Married or Partnered 402 (64.22) 240 (63.49) 162 (65.32)
Not Married or Partnered 35.78 (35.78) 138 (36.51) 86 (34.68) *** p<0.001, ** p<0.01, * p<0.05 denotes chi-square test significance
Sample Characteristics: DQI-I and Variety Subcomponent Scores
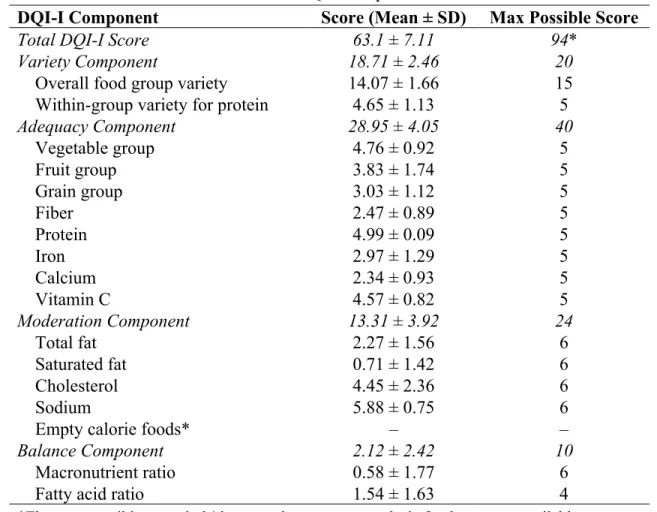
Table 2 (below) contains the mean total DQI-I and sub-component scores for the overall
sample. The mean total DQI-I score was 63.1 ± 7.11 out of a maximum of 94. The mean variety
score was 18.71 ± 2.46 out of 20. The mean adequacy score was 28.95 ± 4.05 out of 40. Mean
adequacy sub-scores for were highest for fruit, protein, and vitamin C and lowest for iron, fiber,
and calcium. The mean moderation score was 13.31 ± 3.92 out of 24. While mean sub-scores for
sodium and cholesterol moderation were high, mean sub-scores for moderation of total fat and
saturated fat were 2.27 ± 1.56 and 0.71 ± 1.42 out of 6, respectively. The mean score for balance
was 2.12 ± 2.42 out of 10.
Table 2. Mean DQI-I component scores
DQI-I Component Score (Mean ± SD) Max Possible Score
Total DQI-I Score 63.1 ± 7.11 94*
Variety Component 18.71 ± 2.46 20
Overall food group variety 14.07 ± 1.66 15
Within-group variety for protein 4.65 ± 1.13 5
Adequacy Component 28.95 ± 4.05 40
Vegetable group 4.76 ± 0.92 5
Fruit group 3.83 ± 1.74 5
Grain group 3.03 ± 1.12 5
Fiber 2.47 ± 0.89 5
Protein 4.99 ± 0.09 5
Iron 2.97 ± 1.29 5
Calcium 2.34 ± 0.93 5
Vitamin C 4.57 ± 0.82 5
Moderation Component 13.31 ± 3.92 24
Total fat 2.27 ± 1.56 6
Saturated fat 0.71 ± 1.42 6
Cholesterol 4.45 ± 2.36 6
Sodium 5.88 ± 0.75 6
Empty calorie foods* – –
Balance Component 2.12 ± 2.42 10
Macronutrient ratio 0.58 ± 1.77 6
Fatty acid ratio 1.54 ± 1.63 4
Table 2. Socioeconomic factors and dietary variety Socioeconomic Variables
Variety Score of less than 20
Variety Score
of 20 / 20 Total
n (row %) n (row %) n (row %)
n 170 (27.16) 456 (72.16) 626 (100)
Geographic Area**
Urban 116 (23.87) 370 (76.13) 486 (100)
Rural 54 (38.57) 86 (61.43) 140 (100)
Household Food Security**
Food Secure 108 (23.38) 335 (75.62) 443 (100)
Food Insecure 62 (33.88) 121 (66.12) 335 (100)
Household Size*
5 members or less 118 (23.94) 375 (76.06) 493 (100)
More than 5 members 52 (39.10) 81 (60.90) 133 (100)
Head of HH Origin**
Migrant to Galapagos 134 (25.24) 397 (74.76) 531 (100)
Native to Galapagos 36 (37.89) 59 (62.11) 95 (100)
*** p<0.001, ** p<0.01, * p<0.05 denotes chi-square test significance
72% of the respondents achieved the highest possible variety sub-component score of 20.
Significant differences in chi-square tests for whether or not the highest possible variety score
was achieved are shown above in Table 2. In rural areas, the percentage of respondents not
achieving the highest variety score was approximately 39% in comparison to 24% in urban areas.
In food insecure households, the percentage of respondents not achieving the highest variety
score was approximately 34% in comparison to 23% in food secure households. In food insecure
households, the percentage not achieving the highest variety score was approximately 34%,
while it was 23% in food secure households. In households with more than 5 members, the
percentage not achieving the highest variety score was approximately 39% as compared to 24%
in households with five members or less. For respondents whose head of household was native to
the Galapagos, the percentage of less-than-highest variety scores was approximately 39% in
Table 3. Socioeconomic predictors of diet quality and adequacy
Socioeconomic Variables DQI-I Score Adequacy Score
Coef. (SE) Coef. (SE)
Urban/Rural # Island (ref. Urban # San Cristobal)
Rural # San Cristobal -3.02 (1.01) ** -2.32 (0.53) ***
Urban # Santa Cruz -0.96 (0.61) -0.65 (0.32) *
Rural # Santa Cruz -0.47 (0.86) -0.95 (0.45) *
Age Category (ref. older than 18)
Less than 5 0.67 (0.97) -0.44 (0.43)
5 – 12 1.84 (0.82) * 0.77 (0.32) *
12 – 18 1.47 (0.78) 0.23 (0.41)
Sex (ref. male)
Female -3.25 (0.53) *** -2.5 (0.28) ***
Race Category (ref. Mestizo)
Non-Mestizo -2.03 (0.76) ** -1.43 (0.4) ***
HH Food Security (ref. food secure)
Food Insecure -0.88 (0.57) -0.94 (0.3) **
Household Size (ref. less than 5)
More than 5 -1.67 (0.64) * -1.17 (0.34) **
Head of HH Origin (ref. migrant to Galapagos)
Native to Galapagos -3.39 (0.76) ** -1.1 (0.4) **
Head of HH Education (ref. primary or less)
Secondary -1.84 (0.6) ** -0.69 (0.32) *
Post-Secondary 0.03 (0.81) 0.79 (0.43)
Head of HH Marital Status (ref. married/partnered)
Not Married or Partnered -0.98 (0.53) -0.61 (0.28) *
Constant 67.49 (1.02) *** 32.44 (0.47) ***
Observations 617 608
R-squared 0.14 0.24
* p<0.05, ** p<0.01, *** p<0.001
Predictors of DQI-I and adequacy sub-component scores in the overall sample
Table 3 (above) shows the multiple linear regression results for the socioeconomic
predictors of total DQI-I scores and adequacy sub-component scores. Significant predictors of
lower DQI-I and adequacy scores at the individual level included being female and non-Mestizo.
Being in the 5 – 12 age group predicted higher DQI-I and adequacy scores. Significant predictors
Cristobal. Heads of households that were native to the Galapagos Islands, not married or
partnered, and educated at the secondary level in reference to primary or lower significantly
predicted lower DQI-I and adequacy scores. Living in either urban or rural Santa Cruz compared
to urban San Cristobal, being from a food insecure household, and having a head of household
that is unmarried or unpartnered significantly predicted lower adequacy scores.
Predictors of adequate intake of iron and calcium in children under 18
Table 4 (below) shows the mean adequacy scores for iron, and calcium. The mean scores
for adequate calcium for both males and females represented approximately 50% of the RDA for
calcium. Mean adequate iron intake scores for females were lower at 1.95 (representing 39% of
the RDA achieved) in comparison to 3.98 for males (representing 79% of the RDA achieved).
Table 4. Children’s mean scores for adequate iron and calcium
DQI-I Adequacy Score Male Female
Mean Score (SD) % RDA Mean Score (SD) % RDA
Iron 3.98 (0.89) 0.79 1.95 (0.67) 0.39
Calcium 2.46 (0.97) 0.49 2.52 (0.97) 0.50
*Maximum DQI-I component score for each is 5 points
Table 5 (below) shows the multiple linear regression results for the predictors of the
percentage of the recommended daily intake of iron and calcium achieved. The RDA for iron
achieved was significantly associated with the sex and age group interaction. In comparison to
males over age 18, significant age-sex interaction predictors of a lower achieved percentage of
the iron RDA included being female and in the age groups of younger than 5 (negative 51%), 5 –
12 (negative 42%), and 12 – 18 (negative 38%). Males under age 5 predicted lower adequacy of
iron as well (negative 9%).
(negative 5%), and living in household that either has more than five members (negative 6%), is food insecure (negative 6%), or is located in rural in reference to urban San Cristobal (negative
13%).
Table 5. Children’s predictors of adequate iron and calcium intake
Socioeconomic Variable
% of Iron RDI % of Calcium RDI Coef. (Robust
SE) Coef. (Robust SE)
Urban/Rural # Island (ref. Urban # San Cristobal)
Rural # San Cristobal -0.03 (0.03) -0.13 (0.03) ***
Urban # Santa Cruz 0 (0.02) -0.02 (0.04)
Rural # Santa Cruz -0.02 (0.03) -0.02 (0.02)
Sex # Age Category (ref. 12–18 # Male)
Male # Less than 5 -0.09 (0.03) ***
Male # 5 – 12 -0.01 (0.03)
Female # Less than 5 -0.51 (0.03) *** Not included
Female # 5-12 -0.42 (0.03) ***
Female # 12-18 -0.38 (0.03) ***
Race Category (ref. Mestizo)
Non-Mestizo -0.03 (0.02) -0.07 (0.03) *
HH Food Security (ref. food secure)
Food Insecure -0.05 (0.02) ** -0.06 (0.02) **
Household Size (ref. less than 5)
More than 5 Not included -0.06 (0.02) *
Head of HH Origin (ref. migrant to Galapagos)
Native to Galapagos -0.05 (0.02) 0.05 (0.03)
Head of HH Education (ref. primary or less)
Secondary -0.02 (0.02) 0 (0.02)
Post-Secondary 0.02 (0.03) 0.06 (0.03)
Head of HH Marital Status (ref. married/partnered)
Not Married or Partnered Not included -0.05 (0.02) **
Constant 0.87 (0.03) *** 0.55 (0.03)
R-squared 0.68 0.15
Observations 345 340
Discussion
Diet Quality in the Overall Sample
In this study, women had lower dietary quality and adequacy. Poor dietary adequacy
appears to explain much of the decrease in total DQI-I scores for women. The largest sex
differences for adequacy components existed for iron, due to the higher recommended intakes for
women due to menstruation. Identifying with ethnicity other than Mestizo was associated with
poorer dietary quality and adequacy. The majority of non-Mestizo respondents identified as
Indigenous. This finding corresponded to a study which found that women from the indigenous
Mah Meri ethnic group had lower diet quality compared to women from non-indigenous in
Malaysia (Chong, Appannah, & Sulaiman, 2019).
Having an unmarried or unpartnered head of household was negatively associated with
dietary adequacy. Chong et. al (2019) also found that single, divorced, or widowed aboriginal
women from the Mah Meri ethic group in Malaysia were associated that poorer diet quality.
Alkerwi et al. (2015) found that living alone in Luxembourg were associated with poorer dietary
diversity and suggested that less family support and financial resources possibly contribute to
poorer diet for unmarried or unpartnered women. Being in the 5 – 12 age group was associated
with better diet quality and adequacy. Previous research on Isabela and San Cristobel islands in
Galapagos has found that mothers prefer to be thinner, but desire for their children to be larger
(Pera, Katz, & Bentley 2019; Waldrop, Page, & Bentley 2016). While this parenting norm could
contribute to possible overweight or obesity, the focus on ensuring that children are eating
enough food to be “large” likely contributes to the higher diet quality and adequacy in the 5 – 12
The household wealth index used in ENSANUT-ECU was not a significant predictor of
diet quality, but heads of households with secondary in comparison to primary or lower had
significantly lower diet quality in both the overall and child groups. While the education system
is uniform across Ecuador, the uniqueness of the Galapagos context may not map well with the
household wealth index conceptualized to capture wealth nationally. However, household food
insecurity was negatively associated with dietary quality and adequacy. Household food security
status was associated with whether a perfect variety score was achieved. Additionally,
households with more than five members were associated with poorer diet quality and adequacy.
They also had twice the percentage of respondents achieving a less than perfect variety score
than households with less than five members.
Several other studies have found that diet quality is negatively associated with food
insecurity in low income households (Leung et al, 2015; Heut et. al, 2012; Darmon &
Drewnowski, 2015). In the United States, data from the 2001– 2002 NHANES database showed
that food-insecure households had lower estimated diet costs, while higher socioeconomic status
groups had higher diet quality and higher estimated energy-adjusted diet costs (Ryden &
Hagfors, 2011). Freire et al. (2018) found that barriers to healthy diets in Galapagos include
price, availability, and quality of fresh produce, in addition to as easy access to industrialized
processed and ultra-processed foods.
Respondents with heads of households that were native to the Galapagos had
significantly lower diet quality and adequacy. Additionally, these respondents had a higher
percentage of respondents achieving a less than perfect variety score than those with a married or
partnered head of household. This finding suggests that migrants to the Galapagos were perhaps
there. Interventions that aim to improve nutritional health in Galapagos should consider the
differences between those native to Galapagos versus those who migrate to Galapagos.
Adequacy of Iron and Calcium for Children
Adequate iron intake has been linked to healthy cognitive development in children in the
nutritional epidemiology literature, while poor calcium intake has been linked with stunting
(Lozoff 1988; Pollitt 1993; Stuijvenberg et al., 2015). While sex was not associated with
differences in adequate intake of calcium, being female was negatively associated with adequate
iron intake. The multiple linear regression model predicted lower achieved percentage of the iron
RDA for women in all age groups, with younger women faring worse than older women. Boys
younger than 5 also had lower iron adequacy. Educational interventions that aim to increase iron
intake should focus on mothers and children.
While race was not associated with iron intake, respondents who were non-Mestizo had
less adequate intake of calcium. As was the case with diet quality in the analysis of the overall
sample, food insecure households were negatively associated with lower adequate intake of iron
and calcium. In multiple linear regression, rural San Cristobal in particular predicted 13% lower
achieved percentage of the RDA for calcium. Additionally, households that had more than 5
members, and those with an unmarried or unpartnered household head were associated with
lower calcium adequacy. These findings aligned with the findings of previous studies mentioned
Strengths and Limitations
This study contributed to the small, but increasing amount of research on human health in
Galapagos. The DQI-I allowed for a nuanced assessment of diet quality that extended beyond
just examining variety or adequacy of certain nutrients or food groups. A limitation to this study
was that the 24-hour dietary recall method used in ENSANUT-ECU is only a “best estimate” of
dietary intake and therefore does not reflect accurate intake. Bias is also likely with this method
because respondents can easily over- or -under-report dietary intake. Furthermore, the data may
be biased because only a single 24-hour dietary recall was used instead of multiple iterations of
24-hour recalls, which helps reduce the bias due to recall difficulties and the potential variation
of diet from day to day.
Additionally, the cross-sectional nature of the study does not allow for cause and effect
relationships to be determined. Data on empty calorie foods, a unique sub-component of the
DQI-I that would have been interesting to examine, were not available for this study. Lastly,
these data may not reflect the current reality on the islands because data ENSANUT-ECU were
Conclusion
As Galapagos continues to rapidly change, pressures on human health will continue to
increase. While the findings in this study are align with findings in similar studies around the
world, residents face unique challenges due to the isolation of the islands. Food systems in
Galapagos are impacted by the tourism industry and land and biodiversity regulations. A study
that modeled food supply system dynamics estimated that by 2037 the 95% of the agricultural
food supply will be imported from mainland Ecuador (Sampedro et al., 2015). Policies
promoting and incentivizing local agricultural growth have been suggested as potential solutions
to the nutritional and health issues the islands are facing. For local interventions, Friere et al.
(2018) suggests promoting family, community, and school gardens in combination with a
multi-faceted education program aimed at parents and children.
Ecuador has demonstrated its progressive stance on nutritional health through its support
of a World Health Assembly resolution that sought to promote breastfeeding and decrease
harmful marketing of infant formula (New York Times, 2018). However, the United States
threats to remove military support from Ecuador over its support for the resolution highlighted
the power imbalances at play within global health policy. Policy-level interventions, such as ones
that tax sugar-sweetened beverages or promote warning labels against unhealthy foods, may face
similar roadblocks. As long as Galapagos overwhelmingly depends on imports, processed foods
will continue to reign dominant residents’ diets. Friere et. al (2018) recently described Galapagos
as a “window on the world” in regards to the processes contributing to the rise in the global
prevalence of obesity. To further this analogy, I argue that the steps that Galapagos takes to
address their changing food systems dual burden of OWT/NCD and UWT/ID can provide
Appendix 1. DQI-I scoring breakdown Component Score Scoring criteria
Total 0-100
Variety 0–20
Overall food group variety 0–15 1 serving from each food group/d = 15 (meat/poultry/fish/eggs; dairy/ Any 1 food group missing/d = 12 beans; grain; fruit; vegetable) Any 2 food groups missing/d = 9 Any 3 food groups missing/d = 6 4 food groups missing/d = 3 None from any food groups = 0 Within-group variety for 0–5 3 different sources/d = 5
protein source (meat, poultry, 2 different sources/d = 3 fish, dairy, beans, eggs) From 1 source/d = 1
None = 0
Adequacy 0-40
Vegetable group 0–5 ≥ 3–5 servings/d = 5, 0 servings/d = 0 Fruit group 0–5 ≥ 2–4 servings/d = 5, 0 servings/d = 0 Grain group 0–5 ≥ 6–11 servings/d = 5, 0 servings/d = 0 Fiber 0–5 ≥ 20–30 g/d = 5, 0 g/d = 0
Protein 0–5 ≥ 10% of energy/d = 5, 0% of energy/d = 0 Iron 0–5 ≥ 100% RDA/d 5, 0% RDA/d = 0
Calcium3 0–5 ≥ 100% RDA/d 5, 0% RDA/d = 0 Vitamin C 0–5 ≥ 100% RDA/d 5, 0% RDA/d = 0
Moderation 0–30
Total fat 0–6 ≤ 20% of total energy/d = 6 > 20–30% of total energy/d = 3 > 30% of total energy/d = 0 Saturated fat 0–6 ≤ 7% of total energy/d = 6
> 7-10% of total energy/d = 3 > 10% of total energy/d = 0 Cholesterol 0–6 ≤ 300 mg/d = 6
> 300–400 mg/d = 3 > 400mg/d = 0
Sodium 0–6 ≤ 2400 mg/d = 6
> 2400–3400 mg/d = 3 > 3400 mg/d = 0
Empty calorie foods* 0–6 ≤ 3% of total energy/d = 6 > 3-10% of total energy/d = 3 > 10% of total energy/d = 0
Overall balance 0–10
Macronutrient ratio 0–6 55 ~ 65:10 ~ 15:15 ~ 25 = 6 (carbohydrate:protein:fat) 52 ~ 68:9 ~ 16:13 ~ 27 = 4
50 ~ 70:8 ~ 17:12 ~ 30 = 2 Otherwise = 0
Fatty acid ratio 0–4 P/S = 1 ~ 1.5 and M/S = 1 ~ 1.5 = 4
(PUFA:MUFA:SFA) Else if P/S = 0.8 ~ 1.7 and M/S = 0.8 ~ 1.7 = 2
Otherwise 0
Sources
Alkerwi, A., Vernier, C., Sauvageot, N., Crichton, G. E., & Elias, M. F. (2015). Demographic
and socioeconomic disparity in nutrition: Application of a novel Correlated Component
Regression approach. BMJ Open, 5(5). doi:10.1136/bmjopen-2014-006814
Chong, S., Appannah, G., & Sulaiman, N. (2019). Predictors of Diet Quality as Measured by
Malaysian Healthy Eating Index among Aboriginal Women (Mah Meri) in Malaysia.
Nutrients, 11(1), 135. doi:10.3390/nu11010135
Darmon, N.; Drewnowski, A. (2015). Contribution of food prices and diet cost to socioeconomic
disparities in diet quality and health: A systematic review and analysis. Nutr. Rev, 73,
643–660.
Doak CM, Adair LS, Monteiro C, Popkin BM. (2000). Overweight and underweight coexist
within households in Brazil, China and Russia. J Nutr. 130:2965–2971
Doak CM, Adair LS, Bentley M, Monteiro C, Popkin BM. (2005). The dual burden household
and the nutrition transition paradox. Int J Obes. 29:129–136.
Fernald LC, Neufeld LM. (2007) Overweight with concurrent stunting in very young children
from rural Mexico: prevalence and associated factors. European journal of clinical
Freire, W. B., Waters, W. F., Román, D., Jiménez, E., Burgos, E., & Belmont, P. (2018).
Overweight, obesity, and food consumption in Galapagos, Ecuador: a window on the
world. Globalization and health, 14(1), 93. doi:10.1186/s12992-018-0409-y
Freire WB, Silva KM, Ramirez MJ, Waters WF, Larrea AP. (2014) The double burden of
undernutrition and excess body weight in Ecuador. Am J Clin Nutr.; 100(suppl):1636S–
43S.
Freire, WB, Ramírez-Luzuriaga, MJ, Belmont, P, Mendieta, MJ, Silva-Jaramillo, KM, Romero,
N, Sáenz, K, Piñeiros, P, Gómez, L and Monge, R (2013), Encuesta Nacional de Salud y
Nutrición ENSANUT-ECU 2011-2013. Tomo I. Quito, Ecuador.
Freire W, Ramirez-Luzuriaga M, Belmont P. (2015) Tomo I: Encuesta Nacional de Salud y
Nutrición de la población ecuatoriana de cero a 59 años, ENSANUT-ECU 2012. Revista
Latinoamericana de Políticas y Acción Pública Volumen 2, Número 1-mayo 2015.
2(1):117.
Gerber, M (2001). The comprehensive approach to diet: a critical review. J. Nutr. 131(suppl.
11): 3051S–3055S.
Griffiths PL, Bentley ME. (2001). The nutrition transition is underway in India. J Nutr.
Hébert, J. R., Hurley, T. G., Steck, S. E., Miller, D. R., Tabung, F. K., Peterson, K. E., . . .
Frongillo, E. A. (2014). Considering the Value of Dietary Assessment Data in Informing
Nutrition-Related Health Policy. Advances in Nutrition, 5(4), 447-455.
doi:10.3945/an.114.006189
Huet, C.; Rosol, R.; Egeland, G.M. (2012). The prevalence of food insecurity is high and the diet
quality poor in Inuit Communities. J. Nutr, 142, 541–547.
INEC (Instituto Nacional de Estadística y Censo). Censo de población y vivienda Galápagos.
Quito: INEC. 2015. http://www.ecuadorencifras.gob.ec/
censo-de-poblacion-y-vivienda-galapagos/Accessed 23 Aug 2018.
Jacobs, A. (2018, July 08). Opposition to Breast-Feeding Resolution by U.S. Stuns World Health
Officials. Retrieved from
https://www.nytimes.com/2018/07/08/health/world-health-breastfeeding-ecuador-trump.html
Kant, A. K. (1996). Indexes of overall diet quality: a review. J. Am. Diet. Assoc. 96: 785–791.
Kim, S., Haines, P. S., Siega-Riz, A. M., & Popkin, B. M. (2003). The Diet Quality
Index-International (DQI-I) Provides an Effective Tool for Cross-National Comparison of Diet
Quality as Illustrated by China and the United States. The Journal of Nutrition, 133(11),
Larrea C. Demografía y estructura social en Galápagos: 1990-2008 (Demography and social
structure in Galapagos: 1990-2008). (2008) Quito: Universidad Andina Simon Bolivar.
http://repositorio.uasb.edu.ec/bitstream/
10644/855/1/LARREAC-CON0007-GALAPAGOS.pdf
Lee J, Houser RF, Must A, de Fulladolsa PP, Bermudez OI. (2010). Disentangling nutritional
factors and household characteristics related to child stunting and maternal overweight in
Guatemala. Econ Hum Biol. 8(2):188-196.
Leung, C.W., Epel, E.S., Ritchie, L.D.,Crawford, P.B., Laraia, B.A. (2015). Food insecurity is
inversely associated with diet quality of lower-income adults. J. Acad. Nutr. Diet., 114,
1943–1953.
Lozoff, B. (1988). “Behavioral alterations in iron deficiency.” Advances in Pediatrics 35 : 331–
60.
Ma, Y., Olendzki, B. C., Pagoto, S. L., Hurley, T. G., Magner, R. P., Ockene, I. S., … Hébert, J.
R. (2009). Number of 24-hour diet recalls needed to estimate energy intake. Annals of
epidemiology, 19(8), 553–559. doi:10.1016/j.annepidem.2009.04.010
Mariscal-Arcas, M., Romaguera, D., Rivas, A., Feriche, B., Pons, A., Tur, J., & Olea-Serrano, F.
adaptation of the Diet Quality Index-International (DQI-I). British Journal of Nutrition,
98(6), 1267-1273. doi:10.1017/S0007114507781424
Page R, Bentley M, Waldrop J. (2013). People live here: maternal and child health on Isla
Isabela, Galápagos.Science and Conservation in the Galapagos Islands: Springer.
141-153.
Pera, M. F., Katz, B. N., & Bentley, M. E. (2019). Dietary Diversity, Food Security, and Body
Image among Women and Children on San Cristobal Island, Galapagos. Maternal and
Child Health Journal. doi:10.1007/s10995-018-02701-4
Parque Nacional Galapagos Ecuador (2011). http://www.galapagospark.org.
Patterson, R. E., Haines, P. S. & Popkin, B. M. (1994) Diet Quality Index: Capturing a
multidimensional behavior. J. Am. Diet. Assoc. 94: 57–64.
Popkin, B. M., Adair, L. S., & Ng, S. W. (2012). Global nutrition transition and the pandemic of
obesity in developing countries. Nutrition reviews, 70(1), 3-21.
Pollitt, E. (1993). “Iron deficiency and cognitive function.” Annual Review of Nutrition 13 : 521–
Rehm CD, Monsivais P, Drewnowski A. (2011). The quality and monetary value of diets
consumed by adults in the United States. Am J Clin Nutr, 94:1333–1339.
Ryden PJ, Hagfors L. (2011). Diet cost, diet quality and socio-economic position: how are they
related and what contributes to differences in diet costs? Public Health Nutr, 14:1680–
1692.
Sampedro C, Pizzitutti F, Quiroga D, Walsh SJ, Mena CF (2018). Food supply system dynamics
in the Galapagos Islands: agriculture, livestock and imports. Renewable Agriculture and
Food Systems 1–15. https://doi.org/10.1017/S1742170518000534
Stuijvenberg, M. E., Nel, J., Schoeman, S. E., Lombard, C. J., Plessis, L. M., & Dhansay, M. A.
(2015). Low intake of calcium and vitamin D, but not zinc, iron or vitamin A, is
associated with stunting in 2- to 5-year-old children. Nutrition, 31(6), 841-846.
doi:10.1016/j.nut.2014.12.011
Tzioumis E, Adair LS. (2014). Childhood dual burden of under- and overnutrition in low- and
middle-income countries: a critical review. Food Nutr Bull. 2014;35(2):230-243.
Waldrop, J., Page, R., & Bentley, M. (2016). Perceptions of body size in mothers and their
young children in the Galapagos Islands. Journal of Maternal and Child Health, 20,
Walsh SJ, McCleary AL, Heumann BW, Brewington L, Raczkowski EJ, Mena CF. (2010).
Community expansion and infrastructure development: implications for human health
and environmental quality in the Galápagos Islands of Ecuador. Journal of Latin
American Geography, 9(3):137-159.
Walsh SJ, Mena CF. (2013). Perspectives for the study of the Galapagos Islands: Complex
systems and human–environment interactions. Science and conservation in the