Title:
The Effect of
CYP3A4
Polymorphisms on Tacrolimus Clinical Pharmacology and
Clinical Outcomes Among UNC Allogeneic Hematopoietic Stem Cell Transplant Patients
Mehak Aggarwal1, Chad Torrice2 Tejendra Patel2, Daisy Zhu2, Eric Weimer3, J. Ryan Shaw4, John Ptachcinski4, Maurice Alexander4, Daniel J. Crona2,4-5
1 Research and Scholarship Program, Eshelman School of Pharmacy, University of North
Carolina, Chapel Hill, North Carolina
2 Division of Pharmacotherapy and Experimental Therapeutics, Eshelman School of Pharmacy, University of North Carolina, Chapel Hill, North Carolina, University of North Carolina, Chapel Hill, North Carolina
3 McLendon Laboratories, UNC Hospitals and Clinics, University of North Carolina, Chapel Hill,
North Carolina
4 UNC Hospitals and Clinics, Department of Pharmacy, University of North Carolina, Chapel Hill,
North Carolina
5 Lineberger Comprehensive Cancer Center, University of North Carolina, Chapel Hill, North
Carolina
Running Title: CYP3A4 polymorphisms and tacrolimus clinical pharmacology
Funding Support
This study was funded with Crona Laboratory start-up funds generously provided by the UNC Eshelman School of Pharmacy.
Conflicts of Interest The authors on this pharmacogenetics study have no conflicts of interest to disclose.
Key Words: CYP3A4, single nucleotide polymorphisms, tacrolimus, pharmacokinetics, bone marrow transplant
Abstract Words: 488 Total Words: 6905 Figures: 5
ABSTRACT
Introduction: Acute Graft vs Host Disease (aGVHD) is a life-threatening, T-cell mediated immune reaction that may occur in allogeneic hematopoietic stem cell transplant (HSCT) patients. Tacrolimus is the cornerstone of aGVHD prophylaxis regimens for allogeneic HSCT patients, however it is a narrow therapeutic index drug. Tacrolimus is primarily metabolized through the CYP3A4 and CYP3A5 enzymes in the liver, and its concentrations could be impacted by two polymorphisms in CYP3A4 (CYP3A4*22, CYP3A4*1b) which may in turn impact onset and severity of aGVHD in allogeneic HSCT patients. Currently, the effect of these SNPs on tacrolimus trough concentrations and incidence and severity of aGVHD in allogeneic HSCT patients is unknown. The primary objective of this pharmacogenetics research study was to determine whether genetic variations in CYP3A4 influence steady-state tacrolimus concentrations, and are associated with risk of developing aGVHD in allogeneic HSCT patients.
Methods: This is an observational, retrospective study where we analyzed 274 BMT patients who received their first allogeneic HSCT at the UNC health systems and received oral tacrolimus for aGVHD prophylaxis from January 2011 to May 2016 were identified through the UNC BMT database and 253 were retrospectively analyzed for incidence and severity of aGVHD. Genotyping for CYP3A4*22 and CYP3A4*1b was performed using TaqMan assays and RT-PCR on DNA collected for HLA-matching prior to transplant. Multivariate analyses will be performed
Results: There was an approximate 60:40 ratio of males to females, and a 12% Black population represented in this study. Patients with two copies of the CYP3A4*1b variant allele (the CC homozygous genotype) had lower mean tacrolimus trough concentrations (4.06+2.06) than patients with the TT homozygous genotype (6.82+0.64, P=0.009). Patients with the CT genotype had lower tacrolimus trough concentrations than those with the TT genotype (3.9+0.95 vs 6.82+0.95, P=0.14). For CYP3A4*22, patients with the AA or AG genotypes experienced higher tacrolimus trough concentrations (8.43+2.54) than patients with the GG genotype (6.3+0.59, P=0.14). Of the 253 patients analyzed, 116 patients experienced some manifestations of aGVHD and the most commonly targeted organ amongst them was the skin (68.9%). The second most targeted organ was the gastrointestinal tract (30.3%) and hepatic aGVHD was observed least frequently (0.8%).
INTRODUCTION
Acute Graft versus Host Disease (aGVHD) is a potentially life-threatening complication that impacts approximately 40% of patients who have undergone allogeneic hematopoietic stem cell transplants (HSCT).1 In allogeneic HSCT, patients receive stem cells from an HLA-matched donor who may be related or unrelated to the patient. However, when donor-transplanted immune cells identify cells from the recipient as foreign, a T cell-mediated immune reaction takes place, which leads to the occurrence of GVHD.2,3Acute GVHD typically occurs within the first 100 days after transplant, and impacts the skin, liver and GI tract. 4 It can present as a maculopapular rash, elevated total bilirubin and/or diarrhea. Severity of aGVHD is classified as Grade I-IV using the Glucksberg Grading System, with Grade IV being the most severe form of the disease, and predictive of poorer outcomes. 5,6 Approximately 10% of patient deaths within the first 100 days are attributable to GVHD.7 aGVHD can be prevented in allogeneic HSCT patients by providing patients with optimal immunosuppressive therapy prior to HSCT.
Tacrolimus is a calcineurin inhibitor that is a cornerstone immunosuppressive therapy for the prevention of aGVHD in allogeneic HSCT patients.3 Tacrolimus binds to FK-binding protein-12 (FKBP-12) and prevents the activation of the nuclear factor of activated T-cell (NFAT) family of transcription factors, consequently reducing the transcription of pro-inflammatory factors like interleukin-2 and the subsequent activation of effector T-cells (Figure 1).3 For appropriate immunosuppression, it is important to maintain tacrolimus trough concentrations within a therapeutic range of 5-10 ng/mL.8–10 This can present a challenge to clinicians because tacrolimus is a narrow therapeutic index drug, and its concentration could be influenced by many clinical/demographic factors (e.g., age, race, hepatic function, concomitant medications, and possibly germline genetics). Due to these factors, tacrolimus has large inter-patient pharmacokinetic variability and requires stringent monitoring for therapeutic and toxic concentrations. Traditionally, this is achieved through therapeutic drug monitoring, but this is a reactive approach, and achieving target trough concentrations can often take days to weeks.9,10 Inadequate immunosuppression can lead to aGVHD, which could ultimately lead to death in severe cases.10 Conversely, supratherapeutic tacrolimus concentrations can also lead to severe adverse effects (e.g., nephrotoxicity, neurotoxicity and electrolyte imbalances).11
Tacrolimus is metabolized primarily by the cytochrome P450 enzymes in the liver, specifically CYP3A4 and CYP3A5. Although CYP3A5 is a major metabolizing enzyme for tacrolimus, a significant portion of its metabolism is mediated by CYP3A4.12–15 Therefore, CYP3A4 single nucleotide polymorphisms (SNPs) and their subsequent effect on tacrolimus concentrations, may play an important role too, especially if the patient has a CYP3A5 poor metabolizer genotype (i.e., CYP3A5*1/*1). There are two SNPs in CYP3A4 that may impact tacrolimus concentrations in allogeneic HSCT patients: (1) rs35599367 occurs in an intronic region of CYP3A4, leads to a C>T base change, and is referred to as CYP3A4*22, and (2) rs2740574 occurs in the promoter region of CYP3A4, leads to a A>G base change and is referred to as CYP3A4*1b. Evidence from previous studies indicates that rs35599367 (CYP3A4*22) could be the most clinically relevant variant of CYP3A4.16
METHODS Study Design
This was a single-center, retrospective observational cohort study of allogeneic HSCT patients that evaluated the associations between two CYP3A4 variants (CYP3A4*22 and CYP3A4*1b) and two clinical phenotypes. The primary objective of this pharmacogenetics study was to evaluate associations between the two SNPs and steady state tacrolimus trough concentrations. The secondary objectives were to evaluate associations between the two SNPs and severity and time to onset of aGVHD. The primary endpoint of the study was initial steady state tacrolimus trough concentrations, while the secondary endpoints of the study were incidence, severity and time to onset of aGVHD.
Study Population Identification
A total of 295 patients who underwent an allogeneic HSCT between January 2011 and May 2016 at UNC Medical Center were identified from the UNC Bone Marrow Transplant Program database. To qualify for this study, patients were required to be 18 years or older, received their first (or only) allogeneic HSCT at UNC Medical Center, received long-term follow up care at UNC, and received oral tacrolimus for aGVHD prophylaxis starting on Day -3 (3 days before transplant). Eighteen patients were excluded because they were receiving their second allogeneic HSCT, 23 were excluded because they did not provide written consent, and one was excluded due to insufficient DNA for genotyping (Figure 2).
Clinical Data Extraction
Clinical and demographic data for these patients was collected from the current UNC Health System electronic medical record (EPIC) and the legacy electronic medical record used prior to March 2014 (WebCis), as well as the UNC Bone Marrow Transplant Program database. Demographic data included: age at the time of transplant, sex, and self-reported race. Clinical data that was collected included: height, weight at the time of transplant, baseline Liver Function Tests (LFTs), baseline serum creatinine, diagnosis for which transplant was indicated, HLA match/mismatch, transplant type (allogeneic related or unrelated), source of transplanted cells (peripheral blood or bone marrow), conditioning regimen intensity (reduced intensity versus myeloablative), Karnofsky score (0-100), and date of transplant. Tacrolimus data that was collected included: date tacrolimus was initiated, initial dose, trough concentrations at goal, date first target trough concentration was achieved (5-10 ng/mL), and dose when at target trough concentration. Tacrolimus has a half-life of 12 hours, and it takes five half-lives to achieve a steady state serum concentration. Since tacrolimus was initiated on Day -3, Day 0 was deemed an appropriate time point for steady state tacrolimus trough measurements.17
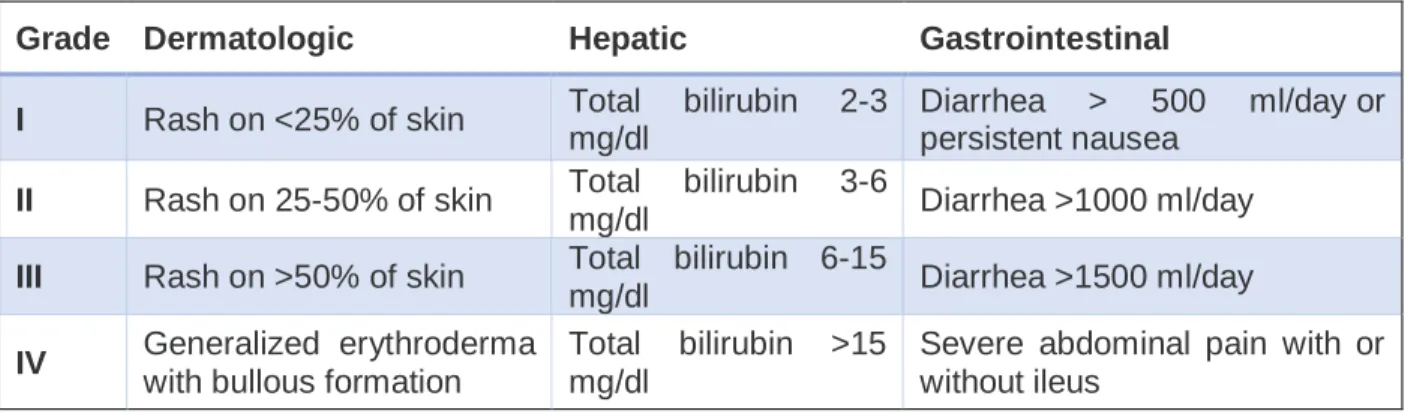
The incidence, severity of aGVHD (Table 1) and time to aGVHD onset were also collected for each patient. Grade I aGVHD is characterized by a rash over <25% of the body, bilirubin 2-3 mg/dL and/or diarrhea of 500-1000 ml/day. Grade II aGVHD is characterized by a rash over 25-50% of the body surface, an elevated bilirubin of 3-5mg/dL and diarrhea 1000-1500 mL/day. Grade III aGVHD is characterized by a rash covering >50% body surface, a bilirubin 6-15mg/dL and diarrhea >1500ml/day. Finally, the most severe form, Grade IV aGVHD, is characterized by bullae formation, ulcerative dermatitis, bilirubin>15mg/dL and severe abdominal pain with or without ileus.5,8
biopsies were all factored to assist with Grading. The date, organ and severity of the first reaction were recorded, followed by information regarding subsequent progressive reactions.
Of all the data points collected, initial steady state tacrolimus trough concentrations were used as the primary endpoint and evaluated for association with the two CYP3A4 variants. Incidence and severity of aGVHD, and time to onset of first aGVHD episode were assessed as secondary endpoints. Subgroup analyses were conducted based on organ affected by aGVHD (dermal, gastrointestinal or hepatic), number of patients with Grade II aGVHD or higher, and number of patients with Grade III aGVHD or higher. Other clinical and demographic variables that were assessed as covariates include race, age, sex, baseline liver function tests, baseline serum creatinine, conditioning regimen, diagnosis, matched related donor vs matched unrelated donor, HLA match, and concomitant medications,
Measurement of Tacrolimus Blood Concentrations
All tacrolimus concentrations from blood were quantified at the UNC McLendon laboratories. Whole blood samples were quantified using liquid chromatography (LC) tandem mass spectrometry (MS/MS). Whole blood samples were treated with a protein precipitant reagent containing internal standard. The samples were centrifuged and chromatographed using a Waters Alliance 2795 Separations Module and Waters Xbridge C18 2.5 uM, 4.6x50 mm column. MS/MS detection was performed in multiple reaction monitoring mode using ion transitions. The reference range for the analytical performance was 5-10 ng/mL, and the maximum dilution factor for sample measurement was x10.
Genotyping Study Population
DNA was obtained from UNC McLendon Labs (n=253), or directly from patient via buccal swab (n=1) (Genotek Inc, Murrieta, CA). For DNA obtained from McLendon Labs, patients had already provided samples for HLA-matching prior to their allogeneic HSCT. DNA obtained from the buccal swab sample was extracted using the Genotek prepIT L2P kit. DNA samples were quantified by measuring absorbance at 260 nm using a spectrophotometer (NanoDrop, Wilmington DE), and using the Quantifluor ONE dsDNA system (Promega, Madison, WI) in the UNC Center for Pharmacogenomics and Individualized Therapy at the UNC Genetic Medicine Building. Then, DNA concentrations were diluted to 50 ng/µL.
Genotyping for rs35599367 and rs2740574 was performed using TaqMan assays (Applied Biosystems, Foster City, CA) and RT-PCR (QuantStudio 6, Applied Biosystems, Foster City, CA). A total of 120ng of patient DNA was loaded onto 384-well plates with the TaqMan probes and the TaqMan Genotyping Mastermix (Applied Biosystems, Foster City, CA) that contains VIC and FAM fluorescent reporter dyes to distinguish the reference base pair to the alternate base pair. Water and TaqMan Mastermix were used as negative controls. All patient samples were run in duplicate. For samples with ambiguous results (n=9), DNA will be amplified using PCR in the Crona Laboratory, and will be sent for Sanger sequencing to clarify the genotype. To avoid other sources of bias, reagents (e.g., Taq polymerase, TaqMan Mastermix and TaqMan probes) were acquired from the same manufacturer and had the same lot numbers. All the experiments were conducted by the same technician and on the same instrument to limit bias, and every plate contained control samples.
Statistical Analyses
Hardy-Weinberg Equilibrium (HWE) testing was first performed on the genotype data as an assay control, and to compare observed versus expected minor allele frequencies. Each of the two SNPs was considered to be within HWE if P>0.01. Univariate analyses of CYP3A4*22 and CYP3A4*1b versus mean trough concentrations was assessed individually using linear regression (i.e., the ANOVA test if SNPs are assessed in an additive genetic model, and t-test when assessed in a dominant/recessive model) since the data was found to be normally distributed. Then Dunnet’s correction was performed to evaluate pairwise comparisons of the three groups. Chi-square (or Fisher’s Exact Test when appropriate) were used to evaluate differences in incidence and severity of composite (all organs) aGVHD among CYP3A4*1b and CYP3A4*22 genotypes.
Because some patients experienced aGVHD in more than one organ and some patients experienced no aGVHD, each event was treated as an individual observation, and not as an individual patient. Therefore, each data point was analyzed as either the presence or absence of aGVHD. If the condition was considered present, it was further characterized for severity of disease. Univariate models of CYP3A4*22 and CYP3A4*1b and time to develop aGVHD were assessed individually using log-rank test, which will also generate Kaplan Meier curves. Multivariate time to event analyses were then performed using a Cox Proportional Hazards Regression model to generate hazard ratios (HR) with 95% confidence intervals and p-values. An additive model of inheritance was assumed for CYP3A4*1b. We utilized a dominant model for CYP3A4*22, that combined the AA and AG genotypes because we observed only one AA genotype. All the statistical analyses performed in this study were conducted using SAS v9.4 (Cary, NC), and all figures were created using GraphPad Prism v6 (GraphPad, La Jolla, CA).
RESULTS
Patient Demographic and Baseline Characteristics
A total of 253 patients were consented and enrolled in the study. Of the 253 enrolled study patients, 245 were included in these analyses: 9 patients were excluded for inconclusive genotype calls, while 3 patients were excluded due to inconclusive aGVHD information.The median age at time of allogeneic HSCT was 52 (range 19-76), 145 men were enrolled versus 107 women (an approximately 60:40 ratio). The reported racial distribution included 211 White patients (84%), 30 Black patients (12%) and 11 were classified as “other” (4%, which included Asian, Hispanic, Native American and Pacific Islander). Acute myeloid leukemia (AML) was the most common diagnosis (40%) that led to an allogeneic HSCT, and myelodysplastic syndrome (MDS) and acute lymphoblastic leukemia (ALL) were the second most common diagnosis (~15%). A majority of the patients received their transplant from an unrelated donor (n=165, 65%) versus a matched related donor (n=87, 35%). A total of 131 patients received myeloablative conditioning regimen (52%), while 121 patients received a reduced intensity conditioning regimen (48%). Table 2 includes a complete synopsis of all relevant baseline clinical and demographic characteristics for the study cohort.
Patient CYP3A4*1b and CYP3A4*22 Genotyping
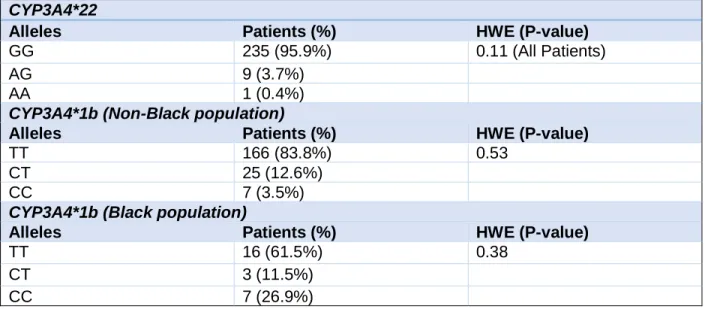
performed correctly. Once stratified by race, CYP3A4*1b was found to be in HWE (P=0.36 for Black patients, and P=0.53 for non-Black patients). Table 3 includes a complete synopsis of all relevant genotyping data for the study cohort.
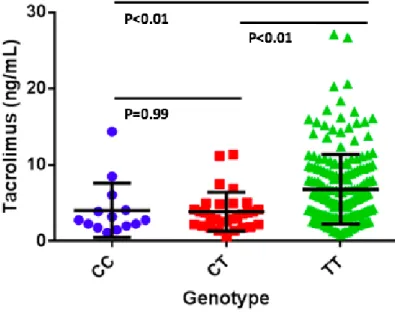
CYP3A4 Genotype Associations with Tacrolimus Trough Concentrations
For CYP3A4*1b, patients with two copies of the variant allele (the CC homozygous genotype) had significantly lower mean tacrolimus trough concentrations than those with the TT homozygous genotype (4.06+2.06 ng/ml versus 6.82+0.64 ng/ml; P=0.009). Patients with the CT heterozygous genotype also had significantly lower mean tacrolimus trough concentrations as compared to patients with the TT genotype (3.90+0.96 versus 6.82+0.64 ng/ml); P=0.0003), but no difference in steady state mean tacrolimus trough concentrations were observed between patients with CC and CT genotypes (P=0.99) (Figure 3). For CYP3A4*22, there was a trend for patients with two copies of the variant allele (the GG homozygous genotype) to have lower tacrolimus trough concentrations that patients with the AA or AG genotype (6.30+0.59 ng/ml versus 8.43+2.54 ng/ml) however this was not significant (P=0.14) (Figure 3).
CYP3A4 Genotype Associations with aGVHD
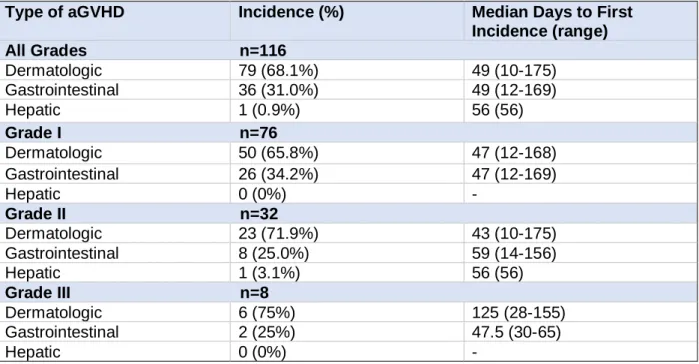
Approximately 50% of patients experienced some form of aGVHD and the most commonly targeted organ amongst them was the skin (68.1%). The second most targeted organ was the gastrointestinal tract (31.0%). Hepatic aGVHD was observed least frequently in terms of aGVHD first incidence; however, select patients did develop hepatic aGVHD (0.9%) after their other organs were affected (Table 4).
There were 7 incidences of Grade II or higher aGVHD, regardless of organ affected, among patients with the CC allele for their CYP3A4*1b genotype, 13 incidences in patients with the CT allele and 94 incidences in patients with the TT allele. When assessing for Grade III or higher aGVHD, there were 4 incidences in the CC allele group, 6 in the CT allele group and 34 in the TT allele group. However, significant differences in the incidence of Grade II+ and Grade III+ aGVHD were not observed among the CYP3A4*1b genotypes(P=0.94 and P=0.59, respectively; Table 5).
When looking at patients with the CYP3A4*22 AA or AG allele, there were 3 total incidences of Grade II or higher aGVHD, and 100 incidences in the GG allele group. Of these incidences, two were grade III or higher in the AA or AG allele, and 41 in the GG allele group, When comparing the incidence of Grade II or higher and Grade III or higher aGVHD to CYP3A4*22 alleles, no significant differences were observed (P=0.44 and P=0.67, respectively; Table 5).
Time to event analyses for all-grade aGVHD, Grade II+ aGVHD, and Grade III+ aGVHD by CYP3A4*1b and CYP3A4*22 genotype were performed. An additive model was used for the time to first incidence of aGVHD with TT as the referent group for the CYP3A4*1b genotypes. For the CYP3A4*22 genotypes and time to event analyses, a dominant model was used with GG as the referent group. Significant differences were not observed between CYP3A4*1b and time to all-grade aGVHD (hazard ratio [HR 0.54], 95% confidence intervals [CI] 0.31-1.22; P=0.38), time to Grade II+ aGVHD (HR 0.53, 95% CI 0.26-1.46; P=0.40), time to Grade III+ aGVHD (HR 0.98, 95% CI 0.24-4.08; P=0.94) (Figure 5). Similarly, significant differences were also not observed between CYP3A4*22 and time to all-grade aGVHD (HR 0.71, 95% CI 0.28-1.97; P=0.55), time to Grade II+ aGVHD (HR 0.71, 95% CI 0.23-2.45; P=0.63), and time to Grade III+ aGVHD (HR 2.04, 95% CI 0.38-19.9; P=0.32) (Figure 6).
DISCUSSION
optimize tacrolimus dosing to better achieve proper immunosuppressive effects of tacrolimus, and to potentially mitigate the incidence and severity of aGVHD or tacrolimus induced-toxicities.
Previous studies have associated germline SNPs in CYP3A4 and CYP3A5 with tacrolimus trough concentrations in the solid organ transplant setting, but these data from solid organ transplants cannot be directly extrapolated to HSCT patients because HSCT patients also develop chemotherapy-related complications like mucositis, renal dysfunction, and veno-occlusive disease that may alter the bioavailability and clearance of tacrolimus.18CYP3A4*22 has been extensively studied in solid organ transplant patients; however, its clinical significance in allogeneic HSCT patients has not yet been established.16,19,20 CYP3A4*22 appears to cause alternative RNA splicing, resulting in reduced production of full length CYP3A4 mRNA, and ultimately increased formation of a nonfunctional protein. An association between this SNP and supratherapeutic concentrations of tacrolimus has been observed in kidney transplant patients experienced.21CYP3A4*1b has also been associated with decreased CYP3A4 activity which may also lead to higher tacrolimus steady-state concentrations.19
In the current study of HSCT patients, there was a significant association observed between CYP3A4*1b and tacrolimus trough concentrations where patients with the CC or the CT genotype had significantly lower steady state tacrolimus trough concentrations on Day 0 as compared to patients with the TT genotype. This is consistent with the hypothesis that patients with the variant allele (T>C) would have lower tacrolimus trough concentrations.22 This suggests that patients with at least on C allele at rs2740574 may require higher initial doses of tacrolimus to achieve goal trough concentrations (5-10ng/ml). However, there was no significant association noted between CYP3A4*22 and tacrolimus trough concentrations. This could be attributed to the fact that only one AA genotype was observed and to see significance, we may need a population with a higher observed frequency for the alternate genotype.
There were no significant associations observed between CYP3A4*1b or CYP3A4*22 and the incidence of all-grade aGVHD or more severe aGVHD (Grade II+ or Grade III+ aGVHD), or the time to aGVHD. Expected trends were observed when looking at CYP3A4*22 genotypes and steady state tacrolimus concentrations. Patients with the GG genotype had lower steady state trough concentrations and higher incidence of Grade II or higher aGVHD, whereas patients with the AA or AG genotype had lower incidence of aGVHD. However, the reverse was observed when observing CYP3A4*1b, where patients with the TT allele had slightly higher tacrolimus steady state concentrations but higher incidence of aGVHD.
These observations about tacrolimus steady-state trough concentrations and aGVHD may have not reached our a priori determined threshold for significance due to the small population size, combined with a low minor allele frequency (particularly for CYP3A4*22). Other reasons for this could be the duration of time after transplant that was evaluated. Traditionally, aGVHD has been evaluated with the most scrutiny within the first 100 days of allogeneic HSCT. Therefore, analyses should be conducted using 100 days as a cut point (and possibly 60 days as well because of the high incidence of dermatologic aGVHD occurring within 60 days). Finally, most patients present with the mild form of the disease (Grade I) and therefore they may receive stringent monitoring and early interventions for the treatment of this first incidence that we do not observe the natural progression of the reaction as it relates to genotype. For validation of this result, both prospective and multi-institutional studies may be more benefit to compare the practice standards, and how aGVHD is diagnosed, managed and recorded in the EMR.
the underlying biology of aGVHD, it may not yield results that are directly applicable to implementing genotype-guided precision dosing of tacrolimus.
Another strength of this study lies in the demographics of the participants enrolled on the study. Unlike what was observed in a previous study from the City of Hope Hospital in California where Black patients were under-represented (<4%), approximately 12% of our patient population was Black.25 The MAF of CYP3A4*1b (T allele) is 0.24 in Black population, but the T allele is actually the major allele in the White population (MAF 0.97). Thus, since the C allele is associated with lower tacrolimus trough concentrations, Black patients may benefit most from genotyping as they are at higher risk for subtherapeutic initial tacrolimus trough concentrations. The higher percentage of Black population in this study gave us a higher probability of seeing the CC genotype in this population. Also, there was an almost 50:50 ratio of male to females, so this gives a better representation of the population allowing for better applicability into larger studies.
One major limitation of this study is its retrospective design. Because the events had already occurred, there was no control over variables like dose adjustments, the extent of provider documentation and information collected, and administration of interacting medications. Also, since the clinical/demographic data was collected from two databases (UNC’s EMR EPIC, and the UNC BMT database), there were some inconsistencies in how clinical data was documented, especially since diagnosis, severity, and date of onset of aGVHD can be subjective.26 Harris et al. published a guidance document in January 2016 on how aGVHD should be assessed to include the extent of target organ involvement. However, measurements such as diarrhea output (based on volume) are not feasible to acquire in an outpatient setting, and the majority of our patients experienced gastrointestinal aGVHD once they were discharged from the hospital.
Another limitation is that some patients followed up once weekly, whereas other patients followed up twice weekly. Therefore, some patients had more clinical aGVHD data than other patients, which could have potentially affected the recorded date of an aGVHD event (which could have affected our time to event analyses). Furthermore, we did not correct p-values in this study for multiple comparisons, and there is always a need in pharmacogenetics studies to correct for multiple comparisons to limit the likelihood of false positives due to type I error. However, we plan to conduct these analyses in the future. And, it is ideal for results from pharmacogenetics studies to be validated in independent, external cohorts of patients. We recognize this, and will be mindful of a plan for obtaining validation data from an external cohort as we plan our prospective studies.
Data from this study is ultimately important for two reasons. This data can be used to develop a population pharmacokinetic model to test alternative tacrolimus dosing strategies and provides preliminary data for a prospective genotype-guided tacrolimus dosing trials in allogeneic HSCT patients. The CYP3A4*1b genotype testing is warranted in these studies as patients with the CC or CT genotype had lower tacrolimus trough concentrations and may require higher doses upon initiation of tacrolimus. CYP3A4*22 may also play a key role in the steady state tacrolimus trough concentration and should be evaluated for different tacrolimus dosing trials using a larger study population, particularly to evaluate the effect of the AA genotype on tacrolimus trough concentrations. Using the data from this study and future studies, we may be able to develop personalized tacrolimus dosing strategies in allogeneic HSCT patients, based on genotype and clinical factors to achieve goal tacrolimus trough concentrations by Day 0, and prevent the incidence and reduce the severity of aGVHD.
ACKNOWLEDGEMENTS
REFERENCES
1. Ferrara JL, Levine JE, Reddy P, Holler E. Graft-versus-host disease. Lancet. 2009;373(9674):1550-1561. doi:10.1016/S0140-6736(09)60237-3.
2. Liewer S, Perkins J. Hematopoietic Stem Cell Transplantation. In: DiPiro JT, Talbert RL, Yee GC, Matzke GR, Wells BG, Posey LM, eds. Pharmacotherapy: A Pathophysiologic Approach, 10e. New York, NY: McGraw-Hill Education; 2017.
http://accesspharmacy.mhmedical.com/content.aspx?aid=1138173519.
3. Zeiser R, Blazar BR. Acute Graft-versus-Host Disease — Biologic Process, Prevention, and Therapy. N Engl J Med. 2017;377(22):2167-2179. doi:10.1056/NEJMra1609337.
4. Holtan SG, Pasquini M, Weisdorf DJ. Acute graft-versus-host disease: a bench-to-bedside update.
Blood. 2014;124(3):363 LP-373. http://www.bloodjournal.org/content/124/3/363.abstract. 5. Glucksberg H, Storb R, Fefer A, et al. Clinical manifestations of graft-versus-host disease in
human recipients of marrow from HL-A-matched sibling donors. Transplantation. 1974;18(4):295-304.
6. Rowlings PA, Przepiorka D, Klein JP, et al. IBMTR Severity INDEX FOR GRADING ACUTE GRAFT-VERSUS-HOST DISEASE: RETROSPECTIVE COMPARISON WITH GLUCKSBERG GRADE. Br J Haematol. 1997;97(4):855-864. doi:10.1046/j.1365-2141.1997.1112925.x. 7. D’Souza A, Zhu X. Current Uses and Outcomes of Hematopoietic Cell Transplantation (HCT):
CIBMTR Summary Slides, 2016. 2016. http://www.cibmtr.org.
8. UNC Health Care Graft-Versus-Host Disease Policy, Policy Number BMT 0031.
9. McCune JS, Bemer MJ. Pharmacokinetics, Pharmacodynamics and Pharmacogenomics of Immunosuppressants in Allogeneic Haematopoietic Cell Transplantation: Part I. Clin Pharmacokinet. 2016;55(5):525-550. doi:10.1007/s40262-015-0339-2.
10. Nash RA, Antin JH, Karanes C, et al. Phase 3 study comparing methotrexate and tacrolimus with methotrexate and cyclosporine for prophylaxis of acute graft-versus-host disease after marrow transplantation from unrelated donors. Blood. 2000;96(6):2062-2068.
http://www.ncbi.nlm.nih.gov/pubmed/10979948. Accessed August 6, 2018.
11. Bauer LA. Tacrolimus. In: Applied Clinical Pharmacokinetics, 3e. New York, NY: McGraw-Hill Medical; 2015. http://accesspharmacy.mhmedical.com/content.aspx?aid=1106304380.
12. Fan B, Qiu K, Jiang Y, et al. Prograf produces more benefits for CYP3A5 low expression patients in early stage after kidney transplantation. Biomed Pharmacother. 2017;88:738-744.
doi:10.1016/j.biopha.2017.01.101.
13. Zong Y-P, Wang Z-J, Zhou W-L, et al. Effects of CYP3A5 polymorphisms on tacrolimus pharmacokinetics in pediatric kidney transplantation: a systematic review and meta-analysis of observational studies. World J Pediatr. 2017;13(5):421-426. doi:10.1007/s12519-017-0035-4. 14. Hamadeh I, Zhang Q, Steuerwald NM, et al. Tacrolimus Pharmacogenetics and Steady State Drug
Concentrations in Cancer Patients Undergoing Allogeneic Stem Cell Transplantation. Blood. 2017;130(Suppl 1):1939 LP-1939. http://www.bloodjournal.org/content/130/Suppl_1/1939.abstract. 15. Pasternak AL, Zhang L, Hertz DL. CYP3A pharmacogenetic association with tacrolimus
pharmacokinetics differs based on route of drug administration. Pharmacogenomics. 2018;19(6):563-576. doi:10.2217/pgs-2018-0003.
16. Wang D, Sadee W. CYP3A4 intronic SNP rs35599367 (CYP3A4*22) alters RNA splicing.
Pharmacogenet Genomics. 2016;26(1):40-43. doi:10.1097/FPC.0000000000000183. 17. Prograf (tacrolimus) [Package Insert]. Deerfield, IL: Astellas Pharma US, Inc; 2012.
18. Jacobson PP. Factors affecting the pharmacokinetics of tacrolimus (FK506) in hematopoietic cell transplant (HCT) patients. Bone marrow Transplant. 10AD;28(8):753-758.
doi:10.1038/sj.bmt.1703224.
19. Rodríguez-Antona C, Sayi JG, Gustafsson LL, Bertilsson L, Ingelman-Sundberg M. Phenotype– genotype variability in the human CYP3A locus as assessed by the probe drug quinine and analyses of variant CYP3A4 alleles. Biochem Biophys Res Commun. 2005;338(1):299-305. doi:10.1016/j.bbrc.2005.09.020.
20. Staatz CE, Goodman LK, Tett SE. Effect of CYP3A and ABCB1 Single Nucleotide Polymorphisms on the Pharmacokinetics and Pharmacodynamics of Calcineurin Inhibitors: Part II. Clin
Pharmacokinet. 2010;49(4):207-221. doi:10.2165/11317550-000000000-00000.
2011;57(11):1574-1583. doi:10.1373/clinchem.2011.165613.
22. Shi W-L, Tang H-L, Zhai S-D. Effects of the CYP3A4*1B Genetic Polymorphism on the Pharmacokinetics of Tacrolimus in Adult Renal Transplant Recipients: A Meta-Analysis. PLoS One. 2015;10(6):e0127995-e0127995. doi:10.1371/journal.pone.0127995.
23. Wang J. CYP3A polymorphisms and immunosuppressive drugs in solid-organ transplantation.
Expert Rev Mol Diagn. 2009;9(4):383-390. doi:10.1586/erm.09.11.
24. Hesselink DA, Bouamar R, Elens L, van Schaik RHN, van Gelder T. The Role of Pharmacogenetics in the Disposition of and Response to Tacrolimus in Solid Organ
Transplantation. Clin Pharmacokinet. 2014;53(2):123-139. doi:10.1007/s40262-013-0120-3. 25. Khaled SK, Palmer JM, Herzog J, et al. Influence of Absorption, Distribution, Metabolism, and
Excretion Genomic Variants on Tacrolimus/Sirolimus Blood Levels and Graft-versus-Host Disease after Allogeneic Hematopoietic Cell Transplantation. Biol Blood Marrow Transplant.
2016;22(2):268-276. doi:10.1016/j.bbmt.2015.08.027.
26. Harris AC, Young R, Devine S, et al. International, multi-center standardization of acute graft-versus-host disease clinical data collection: a report from the MAGIC consortium. J Am Soc Blood Marrow Transplant. 2016;22(1):4-10. doi:10.1016/j.bbmt.2015.09.001.
TABLES AND FIGURES
Table 1. Acute Graft Versus Host Disease (aGVHD) Grading Severity. Severity for dermatologic, hepatic, and gastrointestinal aGVHD is based on the original Glucksberg criteria and is the criteria outlined in the UNC Bone Marrow Transplant protocol.5,8
Grade Dermatologic Hepatic Gastrointestinal
I Rash on <25% of skin Total bilirubin 2-3 mg/dl
Diarrhea > 500 ml/day or persistent nausea
II Rash on 25-50% of skin Total bilirubin 3-6
mg/dl Diarrhea >1000 ml/day
III Rash on >50% of skin Total bilirubin 6-15
mg/dl Diarrhea >1500 ml/day
IV Generalized erythroderma
with bullous formation
Total bilirubin >15 mg/dl
Table 2. Patient Baseline Characteristics. Baseline demographic and clinical data was collected through the UNC electronic medical records (EPIC and WebCis). Median values are represented with ranges in parentheses. Percentages are included for representation of the population.
Variable Value
Age (year) at transplantation, median (range) 51.6 (19-76) Sex
Male 145 (57.6%)
Female 107 (42.4%)
Diagnosis
Acute Myeloid Leukemia 102 (40.4%) Myelodysplastic Syndrome 40 (15.9%) Acute Lymphoblastic Leukemia 39 (15.4%) Non-Hodgkin's Lymphoma 22 (8.7%) Myeloproliferative Disorder 10 (4%) Chronic Myeloid Leukemia 10 (4%) Hodgkin's Lymphoma 9 (3.6%) Chronic Lymphoblastic Leukemia 7 (2.8%) Severe Anaplastic Anemia 5 (2%) Chronic Myelomonocytic Leukemia 5 (2%)
Multiple Myeloma 3 (1.2%)
Donor Type
Matched Unrelated Donor 165 (65.4%) Matched Related Donor 87 (34.6%) Stem Cell Source
Peripheral Blood Stem Cells 237 (94.0%)
Bone Marrow 14 (5.6%)
Cord 1 (0.4%)
Conditioning Regimen
Myeloablative Conditioning 131 (52.0%) Reduced Intensity Conditioning 121 (48.0%) Race
White 211 (83.7%)
Black 30 (11.9%)
Other 11 (4.4%)
Baseline Liver Function
AST 33 (5-206)
ALT 51 (12-209)
Total Bilirubin 0.58 (0.1-2.5) Baseline Renal Function
Table 3. Frequency of CYP3A4*22 and CYP3A4*1b Single Nucleotide Polymorphisms. Observed genotype frequencies for each SNP. Minor Allele Frequency (MAF) for CYP3A4*22 is 2-5%, and MAF for CYP3A4*1b is 3-12% in Non-lack patients and 76% in Black patients. Hardy Weinberg Equilibrium (HWE) analyses were performed to ensure observed frequencies match the expected ones, and was a genotyping quality control measure.
CYP3A4*22
Alleles Patients (%) HWE (P-value)
GG 235 (95.9%) 0.11 (All Patients)
AG 9 (3.7%)
AA 1 (0.4%)
CYP3A4*1b (Non-Black population)
Alleles Patients (%) HWE (P-value)
TT 166 (83.8%) 0.53
CT 25 (12.6%)
CC 7 (3.5%)
CYP3A4*1b (Black population)
Alleles Patients (%) HWE (P-value)
TT 16 (61.5%) 0.38
CT 3 (11.5%)
Table 4. First Incidence of aGVHD by Severity. Of the patients who experienced an acute GVHD reaction, first incidence is represented by target organs overall and by the severity of the reaction
Type of aGVHD Incidence (%) Median Days to First
Incidence (range)
All Grades n=116
Dermatologic 79 (68.1%) 49 (10-175) Gastrointestinal 36 (31.0%) 49 (12-169)
Hepatic 1 (0.9%) 56 (56)
Grade I n=76
Dermatologic 50 (65.8%) 47 (12-168) Gastrointestinal 26 (34.2%) 47 (12-169)
Hepatic 0 (0%) -
Grade II n=32
Dermatologic 23 (71.9%) 43 (10-175) Gastrointestinal 8 (25.0%) 59 (14-156)
Hepatic 1 (3.1%) 56 (56)
Grade III n=8
Dermatologic 6 (75%) 125 (28-155)
Gastrointestinal 2 (25%) 47.5 (30-65)
Table 5. Incidence of aGVHD by Grade and CYP3A4 genotypes. Recorded incidences of Grade II or higher aGVHD and Grade III or higher aGVHD, as a composite of all organs, for CYP3A4*1b and CYP3A4*22 genotypes. Each number represents an individual observation, and not an individual patient, because some patients experienced aGVHD in more than one organ and some patients experienced no aGVHD.
CYP3A4*1b Grade II+ aGVHD (n=242)
Allele Yes No P-Value
CC 7 77 0.94
CT 13 167
TT 94 1094
Grade III+ aGVHD (n=242)
Allele Yes No P-Value
CC 4 38 0.59
CT 6 84
TT 34 560
CYP3A4*22 Grade II+ aGVHD (n=242)
Allele Yes No P-Value
AA or AG 3 24 0.44
GG 100 1298
Grade III+ aGVHD (n=242)
Allele Yes No P-Value
AA or AG 2 25 0.67
Figure 5. Time to Event Analyses for aGVHD and CYP3A4*1b. Kaplan-Meier plots show the percentage of patients who experienced all-grade aGVHD (left panel), Grade II or higher aGVHD (middle panel), or Grade III or higher aGVHD (right panel) during the first 180 days post-allogeneic HSCT for each CYP3A4*1b genotype.
Figure 6. Time to Event Analyses for aGVHD and CYP3A4*22.
Kaplan-Meier plots show the percentage of patients who experienced all-grade aGVHD (left panel), Grade II or higher aGVHD (middle panel), or Grade III or higher aGVHD (right panel) during the first 180 days post-allogeneic HSCT for each CYP3A4*22 genotype.