in Paper or PDF Format. A Master’s paper for the M.S. in I.S. degree. November, 2000. 60 pages. Advisor: Gary Marchionini
This study describes an eye tracking experiment conducted at the Interaction Design Lab of UNC-CH. This experiment focuses on identifying and analyzing user behavior and patterns when processing numeric table data in paper or PDF format. Eight sets of eye data were collected using the ASL 504 eye tracking system, and raw data were analyzed using EYENAL and FIXPLOT software.
Statistical literacy and familiarity with tables is an important factor in determining users’ search performances. For both formats, table column and row headings account for nearly half of users’ visual attention during search as measured by fixation duration. In large tables, PDF files do not appear to be appropriate for browsing and searching, and footnotes seem hard to use. Simple manipulations over table data are helpful for users to get a better understanding of statistical tables.
Headings:
Eye tracking
Eye movement patterns Statistical tables Tabular data
EYE TRACKING STUDY ON IDENTIFYING AND ANALYZING USER BEHAVIOR - EYE MOVEMENTS, EYE FIXATION DURATION
AND PATTERNS - WHEN PROCESSING NUMERIC TABLE DATA IN PAPER OR PDF FORMAT
by Airong Xu
A Master’s paper submitted to the faculty of the School of Information and Library Science of the University of North Carolina at Chapel Hill
in partial fulfillment of the requirements for the degree of Master of Science in
Information Science.
Chapel Hill, North Carolina November, 2000
Approved by:
TABLE OF CONTENTS
CHAPTER 1: INTRODUCTION ... 1
CHAPTER 2: BACKGROUND INFORMATION... 4
Why Tables ... 4
Displaying Government Statistical Data on the Web ... 5
Problems on How People Read Tables ... 6
Eye Movements Measurement Techniques ... 7
CHAPTER 3: METHODOLOGY... 11
Facilities... 11
The Eye-tracking Environment ... 12
How the Eye Tracker Works... 12
Difficulties with Interpreting Eye Movements ... 13
Subjects ... 14
Tables and Tasks ... 15
Procedure ... 17
CHAPTER 4: RESULTS ... 19
Subject Demographics ... 19
Subject General Information... 19
Computer Literacy ... 20
Familiarity with Tables ... 21
Expert and Non-Expert ... 22
Post-test Survey... 22
Data Analysis Results ... 24
Make FIX, AOI, FSQ files... 24
Image Capture and Fixation Plots ... 24
Search Patterns for Different Kinds of Tasks ... 25
Scroll vs. Non-scroll ... 27
Paper vs. PDF Format ... 29
Total Search Time ... 30
Average Number of Fixations... 32
Mean Duration ... 33
Table Headings ... 34
CHAPTER 5: DISCUSSION AND RECOMMENDATIONS... 35
CHAPTER 6: FUTURE STUDIES AND ACKNOWLEDGEMENT... 39
Future Studies ... 39
Acknowledgement ... 39
BIBLIOGRAPHY... 40
Appendix 1: AA-IRB Application ... 42
Appendix 2: The Eye-Tracking Study Process Flow Chart ... 44
Appendix 3: Consent Form for Table Browser Interfaces: Eye-tracking Study ... 45
Appendix 4: Pre -test Demographic Questionnaire ... 47
Appendix 6: Notes for PDF Test... 50
Appendix 7: Questions ... 51
Appendix 8: Post-Tasks Survey... 52
CHAPTER 1: INTRODUCTION
It has been said that eyes are the windows to the soul. Eye positions and movements are the result of the internal information processing performed by the brain and visual
system. Eye fixation refers to a person’s point of regard as he/she looks at a still target in a visual field. Eye fixations are primarily distinguished from saccades and other types of very small eye movements (jitters), which occur during fixation.
The eyes are rarely still, and generally can’t move smoothly over visual fields. Saccades - rapid conjugate eye movements - occur when a person changes fixation from one point to another. Saccades typically cover 15 to 20 degrees, and take between 30 and 120 msec. Total latency is of 100 to 300 msec in response to a visual stimulus. The delay between saccadic eye movements is 100 to 200 msec, and after a saccade, the eyes will fix on an object between 200 to 600 msec. Even during a fixation, people think they are looking at an object steadily, the eyes still engage in small motions within one degree. The jitter motions include high frequency tremor and drift from a fixation; the drift is then corrected by a micro saccade, which preve nts creating a fixed image on the retina, because the stationary image will fade from view after a few seconds (Pritchard, 1961).
Other types of eye movements are nystagmus (smooth pursuit motions), vergence, and torsional rotation (Jacob, 1995), which may be very useful for other studies or
CHAPTER 2: BACKGROUND INFORMATION
Why Tables
There are various forms of presenting statistical information to the public, such as tabular, textual, and graphic forms. Among these forms, tables provide a convenient method to represent masses of numerical data in a straightforward tabular form. As Washburne concluded, the form or method of presentation is a significant factor in the comprehension of statistical data, and tables are better in helping people recall specific values (Washburne, 1927). Later studies suggested that short, simple tables are better than long, detailed tables in presenting numerical data to people who are not familiar with statistical presentation in tabular methods, but for people who have knowledge or
experience in using such methods, short and long tables may be used equally effectively to present the statistical information (Feliciano, et al. 1963).
Tables are widely used in our day-to-day lives. For example, people are usually familiar with nutritional labels on cereal boxes, stock price tables on newspaper, and time
in table format to facilitate citizens’ usage. Agencies such as the Bureau of Labor Statistics, Bureau of Transportation Statistics, and National Center for Health Statistics provide a variety of data, including employment and unemployment data, annual income, financial data, tax data, information on the Nation's transportation systems, health
resources data, and many more.
Displaying Government Statistical Data on the Web
to use, as stated in Coll’s cognitive match interface design principle (Coll & Coll, 1989), which argues that the system should be able to interact with users in a manner that parallels the flow of the user’s own thought processes. Furthermore, previous surveys showed that many users of such online software systems are casual and naïve users (Hyland, Hasan & Fuentes, 1996). Interface designs that allow such users to explore and manipulate data rather than simply posing well-organized queries are appropriate
alternatives. The various levels of statistical knowledge and information literacy of individual citizens result in a wide range of problems related to how they read table data.
Problems on How People Read Tables
The problems on how people read tables might be classified into three categories: user, data and media (Marchionini, 1999). The user problems include user cognitive style and user literacy, such as computer literacy, statistical literacy, understandability of
Eye Movements Measurement Techniques
The eyes do not move randomly, research has shown that eye fixations indicate what people are working on (Just & Carpenter, 1980). People gaze at certain object in conjunction with other activities, such as manipulation, and “eye gaze contains
information about the current task and the well-being of the individual.” (Sibert & Jacob, 2000). So eye gaze can be used as reliable indices of the point of visual attention. Eye tracking system measures the visual gaze direction – the absolute locus in space at which the user’s eyes are pointed (Jacob, 1991). Since both eyes point together, it is OK to track only one eye. Eye tracking is the most detailed measurement of eye movements, and it has been widely used in physiology studies on reading and human computer interaction studies.
Many techniques (Young & Sheena, 1975) have been used for the detection of eye
movement. Earlier measurement techniques require the subjects be constrained somehow from moving, such as EOG (electrooculography) and eye coil. The new generation of eye trackers eliminates subject’s immobilization by measuring eye gaze in a head- free condition. The ASL 504 eye-tracking system used in this study doesn’t require the subjects’ heads to be fixed by distinguishing head movements form eye mo vements.
visualization of the eye). However, the setup is slow due to skin preparation, light adaptation and careful application of electrodes. Although vertical recording is possible, it may be confounded by eye blinks. EOG is more useful for measuring relative eye movements than absolute position, it can cover eye movements up to + 70 deg (Wolf & Knemeyer, 1969), although linearity turns out to be considerably worse when eye excursion is greater than 30 deg, especially in the vertical (Young & Sheena, 1975).
Contact lens with coil (Eye Coil) is an extremely accurate method if the subjects are willing to put contact lens on their eye with a little wire coming out of it. This method is practical only for laboratory studies, it has good vertical recording and linearity
capabilities. The combination with sclera coil contact lenses can record 3D eye or head movements (i.e. horizontal, vertical and torsional movements). But all contact lens cause discomfort, and there is a small risk of corneal abrasion from the contact lens. It seems that the eye coil technology is most suitable for animal research, not for wide spread investigation on the normal population.
Infrared reflection (IR) generally works by quantifying the difference between the amount of infrared light reflected by the sclera between a sensor pair. IR has less noise than EOG, set up is fast and calibration is needed. The problem with IR is that it only works well with the eyes close from center, and linearity is also a major problem.
participant without requiring any head position measurement or stabilization. Computer based systems can track head motions and have auto focus function. This method is comfortable; data is in a form easy for processing, and linearity is improved. The limitation is speed, which is at most 60 samples/sec, and accuracies are not so good as contact lens (Young & Sheena, 1975).
Eye tracking studies have been done mainly in three areas: in human factors studies for the military; in research on psycho logical processes and cognitive research dealing with reading; and in bioengineering helping disabled people in communication (Bolt, R.A.). More than 120 years ago, Javal discovered that the eye made a series of discrete jumps (saccades) connected by pauses (fixations) when studying young children’s eyes during reading (Mackworth, 1974). From then on, subsequent psychological research focused on the jumps rather than the pauses. In the recent a few decades, there has been much research interest on the fixations and how they related to underlying cognitive processes (Tichomirov & Posnyanskaya, 1966). Also, eye-tracking techniques have been used in human computer interaction studies, such as using eye-gaze as input to facilitate interaction between user and the computer, help user run software applications and manage other devices simply by looking at certain menu options on the screen
CHAPTER 3: METHODOLOGY
Facilities
In this study, the Applied Science Laboratories (ASL) model 504 eye tracking system was used to study people’s information processing behavior on table data, with a specific emphasis on browsing and searching tasks.
The eye-tracking equipment includes the following components:
• ASL Model 5000 Eye Tracker Control Unit and plug in power supply
• Pan/Tilt optics eye camera optics module (Sony video camera)
• Remote scene camera (Costas)
• Eye tracker interface PC
• Flock of Birds Head tracker electronics unit, magnetic transmitter, head mounted sensor & halo
• Two black and white video monitors (eye monitor and scene monitor)
• Scan-Do 1024 Video Scan Converter (resolution up to 1024x768 in 16 million colors, replaces remote scene camera)
• Dell Pentium II 400MHz PC, 19" monitor, Windows NT 4.0, SILS Lab Software Setup
• Cables
• Software
a. The E5000 EYEPOS software package to operate the eye tracker and record data.
b. EYENAL data analysis software, which can convert binary data files to ASCII, and ACCESS software to access binary data files from user written C programs.
The Eye-tracking Environment
The user sits at a conventional desk with a 19- inch computer monitor, mouse and keyboard. In order to minimize the subject’s ability to shift and fidget, we use a
stationary wooden chair. The pan/tilt optics module sits on a plastic holder right in front of the monitor. The room lights are dimmed in order to prevent the user’s pupil from being too small, and to reduce the monitor reflection. Also, this experiment requires the room lights in the test room not to directly irradiate on the computer monitor, so we placed one table lamp on the left side of the subject and another table lamp behind the subject.
How the Eye Tracker Works
between the center point of the pupil and the corneal reflection, which are displayed as a set of cross hairs superimposed on the system’s eye monitor. The pan/tilt optics module provided with the system can be positioned 18 to 40 inches from the subject’s eye. The module consists of an eye camera with a ring of near infrared LEDs (Light Emitting Diode) around the lens opening. The LEDs emit an illumination beam that is trained on the retina; the optics module lens captures the light that is reflected back, resulting in a brightly lit image of the pupil. The optics module also captures the reflection of the illumination beam from the surface of the cornea - the corneal. An auto- focusing lens system in the module focuses a telephoto image of the eye onto a solid-state video sensor (eye camera). The pan/tilt mechanism can rotate both the illumination source and eye imaging components in azimuth and elevation to follow the eye as the subject moves about. In addition, a magnetic head tracker is used in conjunction with the eye tracker to provide position data when the eyes are closed. The eye-tracking data may be recorded digitally on the eye tracker interface PC, which servers as the user interface with the eye tracker and a digital data-recording device, or exported to an external device.
Difficulties with Interpreting Eye Movements
It is often complex and time-consuming to interpret eye movements due to the great deal of noise introduced by individual and equipment variability. In an eye-tracking
describe the subjects’ focus of attention. Evidence shows that there is difference in reading strategies between poor readers and good readers. The differences also exist between novice and experts in reading text and graphics. Vonder Embse (1987) found that expert viewed graphs with a smaller number of longer fixations while novices used a larger number of short fixations.
Subjects
10 subjects were selected from the University of North Carolina’s student body, based on email advertisements. Subject included people with statistical experience and those with no statistical experience. Additional subject data collected included age, sex,
computer/software literacy and frequency of using statistical tables. Martha Crosby and Jan Stelovsky’s discovered that both expertise and cognitive style play a significant role in computer users’ comprehension, fixation duration and patterns (Crosby & Stelovsky, 1990). It was hypothesized that these user characteristics would contribute to their browsing and analyzing patterns. The participants were paid $25 for participation.
A pre-test questionnaire given at the beginning of the study elicited subject
Tables and Tasks
Four tables were used in the test, two population tables, and two life expectancy tables. The population tables present statistical data on the growth, distribution, and
characteristics of the U.S. population. The source of these data is the Bureau of the Census. The life tables show the life expectancy and survivorship by age, race, and sex, they are current abridged life tables for the U.S. based on age-specific death rates in 1996. The data used to prepare the abridged U.S. life tables for 1996 are final mortality statistics for 1996 and the July 1, 1996, population estimates by the U.S. Bureau of the Census. Table 3 used in the test is a life expectancy table, which contains data for expectation of life at every single year of age (from 0 to 85), by race and sex. Estimated average length of life in years, by race and sex are shown in life table 5. Table 14 is about resident population by age and sex, from 1980 to 1997. Table 26 has the resident population data ordered by states from 1970 to 1997.
There were three levels of tasks.
Task level 1: simple searching questions. Questions:
1. (table 3) In 1996 how many more years was a 50-year-old woman expected to live?
2. (table 14) In 1997 what was the resident population of all females?
Task level 2: requires the user to perform trend analysis in the data. Questions:
1. (table 3) Across all groups, what happens to the difference in life expectancy between males and females as people age?
2. (table 5) What happened to the difference in age expectancy of males and females between 1929 and 1996?
Task level 3: requires the user to perform a simple calculation and compare information from separated columns, or requires the user to pay attention to the footnote.
Questions:
1. (table 14) In 1990, by what amount in the total population has the data been adjusted?
2. (table 26) Compared to the population information from 1997, which two states have decreased in population size since 1970?
PDF files were displayed on the monitor. The paper versions were pasted on the
monitor’s screen filter, which is almost an inch above the monitor. Usually, people read paper 12-14 inches from their eyes, but during this study, they sat at a fixed chair and their eyes were 28 inches away from the filter. We enlarged the font of the paper data by 50% to partially compensate. Since we don’t have a Frame Grabber installed, the
PrintScreen key was used to capture a screen shot for each table. This was easy when dealing with PDF files, for paper versions, a more detailed adjustment was required. First, one PDF copy for each paper version was made with exactly the same font size; second, each PDF file was captured then stored as bit map files for further usage in drawing fixation plots; third, during the test, the PDF file for each paper version was opened, then the paper was pasted right above the PDF file on the screen filter.
Procedure
The steps for the eye tracking process can be grouped into three sets. The eye-tracking process flow chart is attached in Appendix 2.
Calibration of the system’s components: (needs to be done only once for any given
physical setup of the components)
1. Setting up calibration target points 2. Set and check calibration target points 3. MHT pan/tilt tracking calibration
• Transmitter to optics calibration
Subject setup and calibration: (must be done for each subject used with the system) Before the subject calibration, give a few minutes for the subjects to read the instruction notes, and ask any questions. Let them get familiar with the table layout and other general information, such as selecting tables, zooming in and out. More information about instruction notes can be found in Appendix 5 and 6.
1. Set the offset value between the subject’s eye and the sensor attached to the headband. Obtain an eye image on the eye monitor.
2. Pupil and corneal reflection discrimination 3. MHT pan/tilt tracking
4. Subject eye calibration and calibration test
Data recording:
1. Select “New” from File menu 2. Enter file name “ xxx.eyd “
3. Select “Begin” form File menu, type number (0-9) to insert event marks, or use “Event Mark” form File menu.
4. Type “S” to suspend, “R” to resume 5. Select “Close” to stop.
CHAPTER 4: RESULTS
10 subjects participated in this eye-tracking study, including four females and six males. One female subject’s eye couldn’t be tracked because of the strong reflection of her glasses, she didn’t participate in the question answering part. Another subject’s eye data has been discarded due to too much noise. Thus, 8 of the 10 subject data were deemed usable for the purposes of this study. The results will be addressed in detail in the following sections.
Subject Demographics
Subject General Information
Computer Literacy
All the subjects use computers daily. As reflected in Table 1, all of subjects said they have used computers for Email, Word Processing, database, and Web surfing. Four subjects (50%) have used it for games, six subjects (75%) have used it for multimedia applications, and five subjects (62.5%) have used it for programming.
Application Number of Valid Respondents
Percent of Valid Responses
Email 8 100%
Word Processing 8 100%
Web Surfing 8 100%
Games 4 50%
Database 8 100%
Multimedia 6 75%
Programming 5 62.5%
Total 8 100%
Table 1. Responses to Pre-test Question 2, “What applications do you use?”.
Statistical Literacy
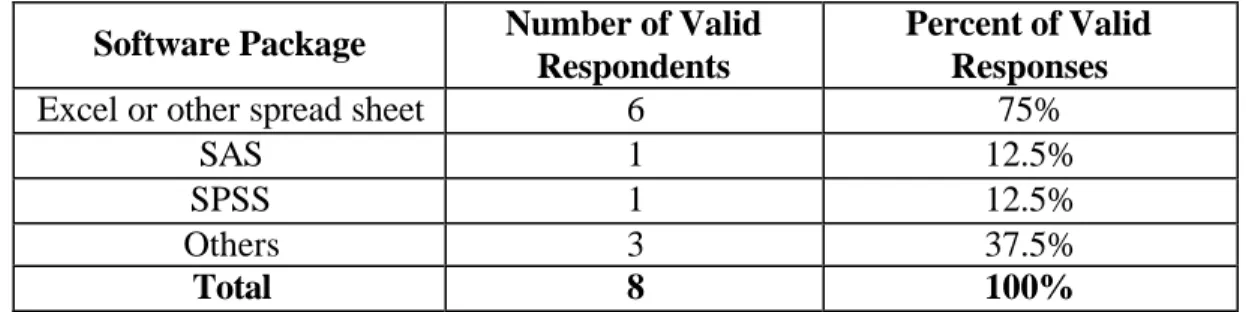
Table 2 illustrates the responses from subjects regarding their statistical software usage. A majority of the subjects said they have used “Excel or other spread sheet”. However, only one subject has ever used SAS, one has ever used SPSS, and the number of people who have others statistical software skills counts 37.5% of the total number of subjects.
Software Package Number of Valid Respondents
Percent of Valid Responses
Excel or other spread sheet 6 75%
SAS 1 12.5%
SPSS 1 12.5%
Others 3 37.5%
Total 8 100%
Table 2. Responses to Pre-test Question 4,
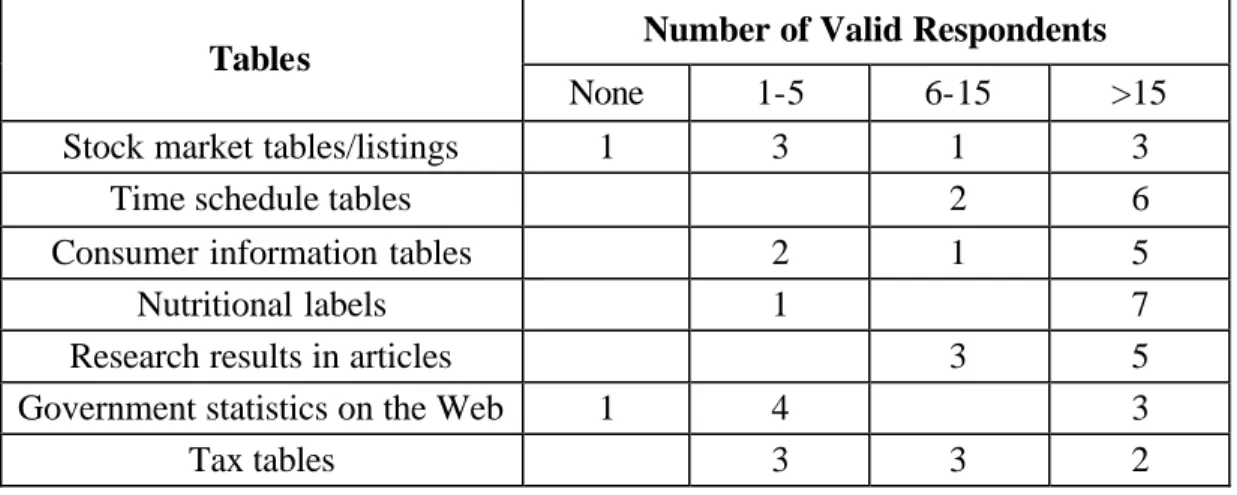
Familiarity with Tables
The frequency of table usage can be seen in Table 3, from left to right, the scale can be explained as: no table knowledge, very limited table knowledge, moderate table
knowledge and familiar with tables. It is clear that most of the subjects are very familiar with time schedule tables, nutritional labels and research result tables.
Number of Valid Respondents Tables
None 1-5 6-15 >15
Stock market tables/listings 1 3 1 3
Time schedule tables 2 6
Consumer information tables 2 1 5
Nutritional labels 1 7
Research results in articles 3 5
Government statistics on the Web 1 4 3
Tax tables 3 3 2
Table 3. Responses to Pre-test Question 5, “Please tell us how many times you have used the following tables (including both paper and electronic formats).”.
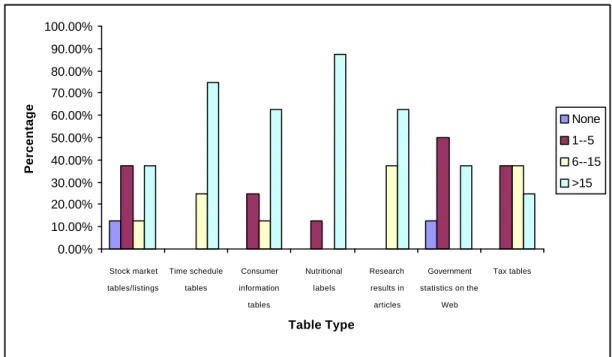
0.00% 10.00% 20.00% 30.00% 40.00% 50.00% 60.00% 70.00% 80.00% 90.00% 100.00% Stock market tables/listings Time schedule tables Consumer information tables Nutritional labels Research results in articles Government
statistics on the
Web Tax tables Table Type Percentage None 1--5 6--15 >15
Figure 1. Subject percentage on table usage.
Expert and Non-Expert
In this study, subjects have very similar computer literacy background. We classified subjects who had taken statistical courses and are familiar with using tables as experts (or experienced users), while regarding those who hadn’t taken any statistical courses and have relatively little knowledge in using tables as non-experts (or inexperienced users).
Post-test Survey
eight participants were tested on paper, while others were tested on electronic PDF files. No difficulties were found about reading on paper, most of the problems were related to the PDF files.
Three participants said they had problems with large tables when using the PDF format. They felt large tables were hard to use, and they thought it would be much easier to use in paper, especially for large tables. One participant mentioned that big tables were hard to scroll which made the searching slow, also she said it was a little bit difficult for her to scroll side to side, she would prefer just to scroll up and down instead of in both
directions. Another participant thought the screen jumping was annoying, according to his opinion, the screen reset (repainting) is always a problem with reading PDF files, because people have to wait until the repainting has been finished, then can they locate their position. He also talked about the loss of column and row headings when scrolling; in this case, he had to look for a landmark to go back. Two participants said that the purple headings on the PDF files made reading easy. One participant thought that a PDF file is not suitable for online reading because the screen limit with long datasets would cause problems. She also talked about the difficulties she has encountered when looking for the answer to question 8 (the comparison of two states that has decreased in
population size), she suggested that if data were pre-sorted (either ascending or
paper instead of electronic PDF files. Even an expert who has lots of experience on tables, spread sheets and Web applications thinks that side scrolling is tricky, and information is not shown until scrolling stops.
Three participants of those who used PDF files said that the footnotes were hard to read (Question 6), because they were not ordered clearly, and not easily accessible. In order to read the whole line they had to scroll side to side.
Data Analysis Results
Make FIX, AOI, FSQ files
EYENAL Program was used to make eye fixation files and the AOI (area of interests) files using the raw eye data. Eye fixations were computed by FIX function. Point of gaze must continuously remain within a small area for some minimum time, which is usually assumed to be about 100 msec, and the minimum motion is usually assumed to be about 1 degree visual angle.
Image Capture and Fixation Plots
electronic PDF format. Eye fixation points were labeled by a sequence of numbers. The lines showed saccades from one fixation point to another.
Search Patterns for Different Kinds of Tasks
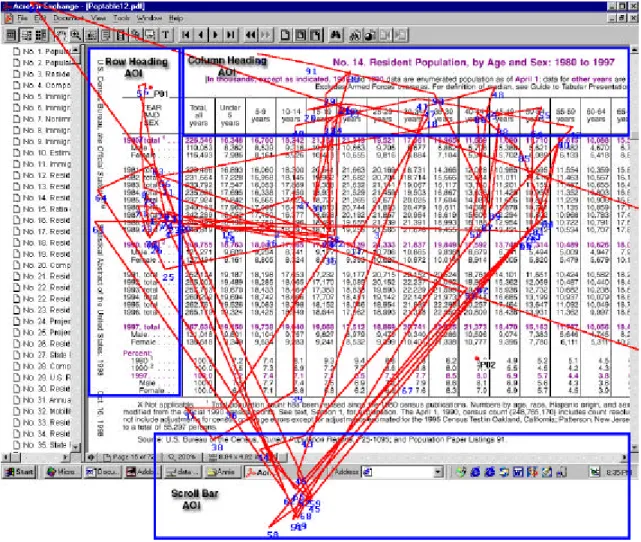
Appendix 9 includes a full set of fixation plots (PDF) for the 8 questions in three task levels. For task level 1, as reflected on Figure 2, it is obvious that there are several areas of visual attention on the flat table file: column heading, row heading and area around the target answer. There were obvious back and forth eye movements between column headings and the target area, and between row headings and the target area.
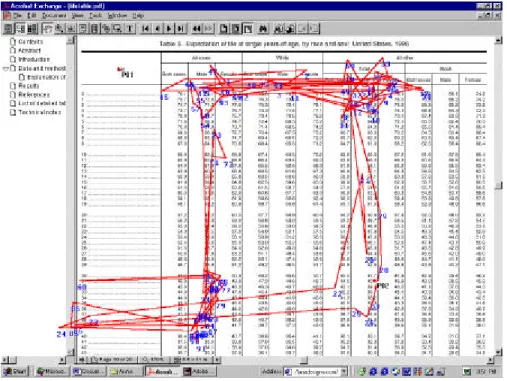
Figure 2. A fixation plot showing the scan paths and area of interests (AOI) for question 7 in PDF format (no scrolling).
Figure 3. A fixation plot that shows the scan paths when the subject was searching the answer for question 2 in PDF format without scrolling.
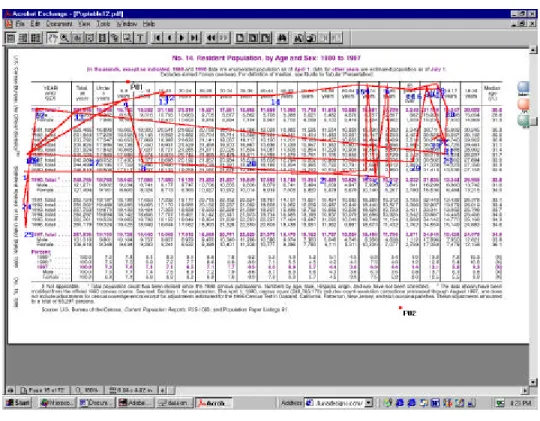
For task level 3 - column comparison, Figure 4 shows a different search pattern, there were two columns of visual attention, connected by a series of back and forth saccades.
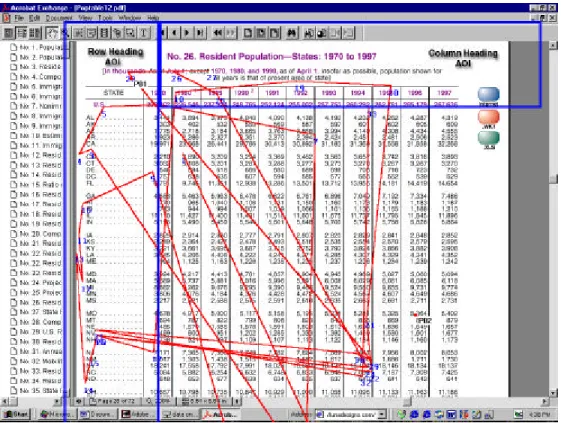
Scroll vs. Non-scroll
The answer for question 5 was 18 columns away from the row headings, which requires that the subjects’ eyes move accross the whole table to get the target answer. The Area Of Interests (AOIs) in Figure 5 includes: row heading, column heading and the scroll bar area. The AOIs are shown with dark borders in the plot.
Comparing Figure 5 and Figure 6, the differences between the two plots are obvious. When the subject wanted to manipulate the PDF file, such as move the horizontal scroll bar, he had to pay extra attention to the scroll bar area at the bottom of the page. First he had to locate the scroll bar then adjust it. After he moved the horizontal bar to the right, the table’s row heading might be invisible, therefore, he must go back using the scroll bar again. In this case, by analyzing the raw eye data using the EYENAL AOI Program and the Fixation Sequence Program, we know that the time the subject spent on the scroll bar area accounts for 9% of the total fixation duration. And the total number of eye fixations and total search time were greater and longer than for people who didn’t use the scroll bar, respectively.
Paper vs. PDF Format
The two subjects tested in paper format were both experts, thus, the data genereated by the two experts were compared only with the data collected from the other two experts who participated in the PDF test. Thus, there are no data on differences between nonexperts on paper and the PDF format.
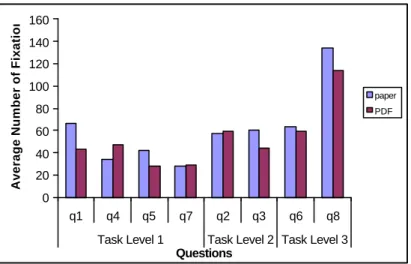
As shown in Figure 7, 8, 9, without scrolling, there is no obvious difference between subjects who read table data in paper and PDF in terms of search time and the number of fixations; while, for mean fixation duration, as shown in Figure 9, paper format resulted in shorter mean fixation duration than PDF file. In a word, subjects who used the scroll bar when reading PDF tables showed different eye movement pattern and longer search time in comparison with those using paper format. No statistical tests of significance were computed due to the small sample size.
0 100 200 300 400 500 600
Subject #17 Subject #31 Subject #32 Subject #13
Paper Test PDF Test
Test Type
Total Test Time (seconds)
0 20 40 60 80 100 120 140 160
q1 q4 q5 q7 q2 q3 q6 q8
Task Level 1 Task Level 2 Task Level 3
Questions
Average Number of Fixations
paper PDF
Figure 8. Average number of fixations for the four expert subjects, grouped by task levels.
0 0.1 0.2 0.3 0.4 0.5 0.6 0.7 0.8 0.9 1
q1 q4 q5 q7 q2 q3 q6 q8
Task Level 1 Task Level 2 Task Level 3
Questions
Mean Fixation Duration
paper
Figure 9. Mean fixation duration for the four expert subjects, grouped by task levels.
Total Search Time
0 100 200 300 400 500 600 700 800 900 1000
Subject #17 Subject #31 Subject #32 Subject #13 Subject #16 Subject #21 Subject #25 Subject #26
Expert Subjects Non-Expert
Total Test Time
Figure 10. Total search time for the eight subjects, grouped by statistical experience level (expert vs. non-expert).
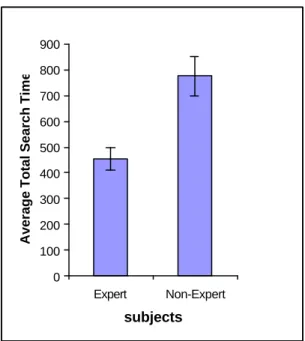
The data in Figure 10 were used as inputs to further analyze the differences between experts and non-experts based on average search time. Figure 11 shows the results. It is clear that experts spent much less time to finish all the search tasks.
0 100 200 300 400 500 600 700 800 900 Expert Non-Expert subjects
Average Total Search Time
Figure 11. Average total search time for expert and non-expert.
Figures 12 displays the comparison of experts with non-experts with respect to average total search time. The difference between the two groups becomes bigger as the task level increases. This means that the more difficult the questions are, the more obvious the difference is. For task level 1, inexperienced subjects spent 23.6% more time than experienced subjects in searching. For task level 2, the number is bigger, 63.5% more time than experienced subjects in searching. As for task level 3, it is 135.1%.
0 50 100 150 200 250 300
Task level 1 Task level 2 Task level 3
Task Levels
Search Time (in seconds)
Expert
Non-Expert
Figure 12. Mean search time for d ifferent tasks.
Average Number of Fixations
0 50 100 150 200 250 300
Q1 Q4 Q5 Q7 Q2 Q3 Q6 Q8
task level 1 task level 2 task level 3
Questions
Average number of fixations
Figure 13. Average number of fixations for each question. *
Mean Duration
In this eye tracking study, a total of 6735 eye fixations were collected. Based on this eye fixation data, Figure 14 shows the mean fixation duration for the three tasks with the highest value for task level 2. Trend analysis requires comparison and simple calculation during the searching process, thus increasing the eye fixation duration.
0 0.1 0.2 0.3 0.4 0.5 0.6 0.7
task level 1 task level 2 task level 3
tasks
mean duration
Table Headings
As shown in Figure 15, for task level 1 and 2, in spite of table format (Paper/PDF), all subjects spent a relatively high percentage (39.4% - 49.9%) of the total fixation durations on reading table headings. Task 3 is not included in this analysis because of different search criteria. This result demonstrates the importance of headings in anchoring people in a data set.
0 10 20 30 40 50 60 70
q1 q4 q5 q7 q2 q3
task level 1 level 2
Task Questions
Percentage
Figure 15. Percentage of mean total fixation duration on table headings (including column headings and row headings) for task level 1 and 2.
NOTES:
CHAPTER 5: DISCUSSION AND RECOMMENDATIONS
Although the results of this study are interesting, we should be cautious in projecting the results to large populations because of the limitation of this eye-tracking study: the sample number is rather small, and the subjects were not randomly selected from the general population. Another problem is that eye-tracking itself is problematic, eye data is low- level data. To get a full understanding of e-tables we need to know not only the unconscious eye movements but also users’ cognitive reflection and explanation of their information needs for processing, methods such as verbal expression (think aloud) were not used in this study. Additionally, in this study, tasks were limited using a fairly small selection of tables. Also subjects recruited were those who have interests in eye-tracking test, so the selection is artificial, the questions assigned to them did not reflect their real searching needs or interests.
expert and non-expert (as measured by if the subjects have taken a statistical course and their familiarity with tables) becomes more and more obvious as the task level increases.
Though it is reasonable to see most of the eye fixations are on the column headings, row headings and search areas, a surprising finding of this study is that table column and row headings caught an average of 44.3% of the visual attention (ranging from 39.4% to 49.9% for 8 questions as measured by eye fixation duration) of the whole search process, for both the experts and non-experts. Also the obvious back and forth eye movements indicate that people have to reference column or row headings from time to time when performing certain searching tasks. This result tells us that the importance of locating table headings during information-seeking process, it also suggests that locking the table headings, or highlighting the desired column or row could save time on searching table data.
format. They prefer to use paper instead of PDF file for reading big tables. Most subjects felt it was OK to scroll up and down using the mouse wheel, but not the vertical scroll bar, because the scroll bar could lead to the jumping to another page, they would lose the whole table.
Only one test question required the subjects to look at the footnote. The feedback from subjects was that footnotes for a large table are hard to use for two reasons. First, the footnotes are not ordered clearly; second, accessibility is another issue since side-to-side scrolling also caused difficulties. For very long tables, scrolling down to find the footnote at the bottom was very inconvenient and slowed down search time.
According to these findings, we notice that the PDF file is not appropriate for browsing and searching in large tables because large tables contain more columns and rows than can be displayed on a single screen. Scrolling when using large tables can cause more subsequent problems, such as requiring the user to spend additional time on locating scroll bars, and the possibility of losing column or row headings. Without these
headings, users will run into difficulties in identifying the meaning of a particular cell.
CHAPTER 6: FUTURE STUDIES AND
ACKNOWLEDGEMENT
Future Studies
The study aimed to get some baseline knowledge about how people read online table data. Further eye-tracking studies will be carried out on how people read table data through specialized table browser interfaces. Hopefully, a clearer understanding of the human behavior on table browsing and searching will help us improve the table
browser’s interface design, and make table browsers better tools for citizens accessing and manipulating desired table data.
Acknowledgement
BIBLIOGRAPHY
Bolt, R.A. The Human Interface: Where People and Computers Meet. Lifetime Learning
Publications, Belmont, California, 1984.
Coll R.A. and Coll J.H., Cognitive match interface design: base concept for guiding the development of user friendly computer application packages. J. Medical Systems, Vol. 13, No. 4 227-235, 1989.
Crosby M. and Stelovsky J. Using enhanced eye monitoring equipment to relate subject differences and presentation material. From Eye to Mind: Information Acquisition
in Perception, Search and Reading, R. Groner, G. d’Ydewalle, R. Parham (Eds.),
Elsevier Science Publisher B.V. North-Holland, 1990.
Feliciano, G.D., Powers, R.D., and Bryant, E. K. The presentation of statistical
information. Audio Visual Communication Review, Vol. 11, No. 13 (1963), 32-39. Hutchinson, T.E., White, K.P., Martin, W.N., Reichert K.C. and Frey L.A. Human-
Computer Interaction Using Eye-Gaze Input. IEEE Transactions on System, Man
and Cybernetics. Vol. 19, No. 6, 1989.
Hyland, P.N., Hasan, H., and Fuentes, A. Supporting casual or naïve users of externally derived statistical data. In J. Grundy & M. Apperley (Eds.), Proceeding of
OZCHI’96 (268-269). Los Alamitos, CA: IEEE, 1996.
Jacob R.J.K. The use of eye movements in human-computer interaction techniques: What you look at is what you get. ACM Transactions on Information Systems, Vol. 9, No. 3, April 1991, 152-169.
Jacob R.J.K. Eye tracing in advanced interface design. In W.Barfield and T. Furness (eds.). Virtual environments and advanced interface design. Oxford University Press, Oxford, 1995.
Just, M.A. and Carpenter, P.A. Eye fixations and cognitive processes. Cognitive
Psychology 8, 1976, 441-480.
Mackworth, N. The line of sight approach to children’s reading and comprehension. In S. Wanat, H. Singer, & M. Kling (Eds.), Extracting Meaning from Written
Marchionini, G and Greene S. Spring 1997. Public access and use of government statistical information. NSF Government Information Workshop White Paper. http://ils.unc.edu/~march/govinfo_paper.html
Marchionini, G. Revised Statement of Work: Citizen Access to Government Statistical Data. http://istweb.syr.edu/~tables/Revised_SOW.pdf.
Mu, X. Java Table Browser: Transportation and Presentation of Large Statistical Tables Over Network. Master paper, School of Information and Library Science, UNC-CH, May 2000.
Pritchard, R.M. (1961) Stabilized images on the retina, Sci. Am., 204, 72-78.
Sibert L.E. and Jacob R.J.K. Evaluation of eye gaze interaction. Proceedings of the CHI
2000 conference on Human factors in computing systems, 2000, 281-288.
Tichomirov, G.K. and Poznyanskaya, E. D. An investigation of visual search as a means of analyzing heuristics. Voprosy Psikhologii, 1966, 12, 39-53.
Vonder Embse, C. B. An eye fixation study of time factors comparing expert land novices when reading and interpreting mathematical graphs. UMI Dissertation
Abstracts International, 1987.
Ware C. and Mikaelian H.H. An Evaluation of an Eye Tracker as a Device for Computer Input. Online at ACM Digital Library.
Washburne, J. N. An Experimental Study of Various Graphic, Tabular and Textual Methods of Presenting Quantitative Information. Journal of Educational
Psychology, 18: 361-376, 1927.
Wolf, W., and Knemeyer, M. Eye movement instrumentation. Presented at the American Education Research Association Convention, February 1969.
Appendix 1: AA-IRB Application
Table Browser Interfaces: Eye-tracking Study
Dr. Gary Marchionini
1. Project Description
a. The purpose of this research is to conduct eye-tracking studies on how people process tables, an ASL 504 eye-tracking system will be used to measure subjects’ eye movement when they process table data.
b. Participants will primarily include members of the UNC-CH community who are interested in participating in the eye-tracking study. Initially, participants will be given a brief questionnaire regarding their experience with both statistics and with statistical information seeking in online environments. A copy of this is in Appendix B. After the interview, participants will be asked to complete a series of tasks that involve finding information that is available in tables that are presented to the participants. The tasks will vary from simple information finding, to comparing and contrasting information, to basic analysis of information. Only a subset of tasks will be selected from the list of tasks in Appendix D. The participants will be presented with PDF files in flat table format. All instructions and tasks will be made available to the
participants in a written format. Instructions will also be given verbally by the investigator. Responses to the tasks will be recorded by the eye-tracking system. The investigator will also take time measurements during completion of tasks by participants. The study will last approximately 1 hour.
2. Participants
a. Participants will vary in age and gender. There will be approximately 10 participants.
b. Participants will be selected based on statistical experie nce, both lack of and expertise in statistics.
c. Participants will be recruited through fliers and list serve email messages. d. Participants will be provided with an inducement of $25.
3. Are participants at risk?
Participants are not at risk. Eye-tracking equipment will be used in the study, it uses a camera positioned more than one foot from the subject to track eye movement and operates at a level at least an order of magnitude lower than what is considered to be safe.
4. Minimizing Risk: Not applicable.
Illegal activities are not involved. 6. Is deception involved?
Deception is not involved.
7. What are the anticipated benefits to participants and/or society?
The proposed empirical studies will lead to better understanding of how human process table data. A second benefit will be the development of effective and efficient user interfaces for processing table data.
8. How will prior consent be obtained?
Participants will be presented a written informed consent form which they will be asked to sign. A copy of this is available in Appendix A.
9. Describe security procedures for privacy and confidentiality.
All transcripts and paperwork will be stored in a locked file cabinet at the School of Information and Library Science, not to be released. No information identifying a subject will be associated with the stored data. The subjects’ privacy and
Appendix 2: The Eye-Tracking Study Process Flow Chart
Set event mark (optional)
Investigator asks a question
Participant searches for answer
Participant answers the question
Data recording suspends
Y N N Y Change table? End of the test? Go to next question
New segment begins
Change table. Go to next question New segment begins Welcome!
!
Participant signs the consent form
Pre-test Questionnaire
Participant reads notes
Begin to record data Subject calibration
Participant signs the payment form
Thank you! Data recording resumes Data recording resumes
Stop data recording
Appendix 3: Consent Form for Table Browser Interfaces:
Eye-tracking Study
Purpose of this Study
We are inviting you to take part in a research study on how people process tables. We will conduct eye-tracking studies of online table usage. Dr. Gary Marchionini is the Principal Investigator of this research project.
The eye-tracking methods
The pan/tilt optics module provided with the system is positioned more than one foot from your eyes. The module consists of an eye camera with a ring of near infrared LEDs around the lens opening. The LEDs emit an illuminatio n beam that is trained on the retina; the optics module lens captures the light that is reflected back, resulting in a brightly lit image of the pupil. The optics module also captures the reflection of the illumination beam from the surface of the cornea - the corneal reflection. In addition, a magnetic head tracker is used in conjunction with the eye tracker to provide position data when the eyes are closed. The system measures the separation between the pupil and the corneal reflection and calculates the point of gaze.
Number of Participants
There will be approximately 10 participants.
What Will Happen During the Study
As a participant you will be asked questions regarding your experience with statistics and searching for statistical information in an electronic environment. After this you will be asked to complete a series of information finding and question answering tasks. To accomplish this you will be presented with PDF files in flat table format on a computer screen. The investigator will give you verbal instructions, and will ask you 8 questions one by one. During your searching, you can ask the investigator to repeat the question as often as you like. Once you have completed the tasks, the investigator will ask you a few questions regarding your experience with the tasks and your comments about the eye-tracking system.
Your Privacy is Important
We will make every effort to protect your privacy. Any information obtained in the study will be recorded with a participant number, not your name. Since we will be making efforts to protect your privacy, we ask you to agree that we may use any information we get from this research study in any way we think is best for publication or education. If you have any questions regarding this study, please contact Dr. Gary Marchionini (966-3611, [email protected]).
Risks and Discomforts
estimates for far- infrared exposure is 10 mW/sq.cm (David Sliney of US Army Environmental Hygiene Agency and Myron Worbarsht of Duke University Medical Center) and our ASL device uses between 0.1 and 0.3 mW/sq. cm on average. The head tracker receiver is positioned 12-24 inches from the transmitter that produces a magnetic field between one-eighth and one-quarter (depending on head position) of the normal earth field of 0.6 gauss (manufacturer specifications). This configuration of eye and head tracker supplied by ASL Laboratories has found wide applications in government, university, and corporate laboratories.
Your Rights
You will be paid $25 for your participation in the eye-tracking study, which should last approximately 1 hour. You are free to refuse to participate or to withdraw from the study at any time without penalty and witho ut jeopardy. You will be paid for the time you have completed.
Institutional Review Board Approval
The Academic Affairs Institutional Review Board (AA-IRB) of the University of North Carolina at Chapel Hill has approved this study. If you have any concerns about your rights in this study you may contact the Chair of the AA-IRB:
David A. Eckerman, Chair CB# 4100, 201 Bynum Hall UNC-CH
Chapel Hill, NC 27599-4100 962-7761
I have had the chance to ask any questions I have about this study, and they have been answered for me.
I have read the information in this consent form, and I agree to be in the study. I understand I will get a copy of this consent form after I sign it.
___________________________________ ________________________
Appendix 4: Pre-test Demographic Questionnaire
Your answers to the following questions will help the study researchers to analyze the test results.
Participant ID ____________
Age ____ Gender Male _____
Female _____ Do you wear glasses or contacts? Yes _____
No _____
To control for different levels of computer/software and statistical literacy, please help us with the following information:
1. How often do you use a computer?
Never Occasionally Monthly Weekly Daily 2. What applications do you use? (Please check all that apply)
Email Word Processing Web Surfing Games Database Multimedia Programming
3. Have you ever taken a statistical course? Yes No
If yes, when did you take it, choose all that apply:
High School College Graduate Study Professional Training 4. Please select any statistical software package(s) you have used:
We’d like to know how often you use statistical tables. Please check the response that best represents your experience.
5. Please tell us how many times you have used the following tables (including both paper and electronic formats):
Stock market tables/listings
None 1 - 5 6 – 15 >15
Time schedule tables (e.g. bus, airline, class schedule)
None 1 - 5 6 – 15 >15
Consumer information tables (e.g. cost comparison tables)
None 1 - 5 6 – 15 >15
Nutritional labels (e.g. cereal box)
None 1 - 5 6 – 15 >15
Research results in articles
None 1 - 5 6 – 15 >15
Government statistics on the Web (e.g. health, demographic tables)
None 1 - 5 6 – 15 >15
Tax tables
None 1 - 5 6 – 15 >15
6. Have you used Fedstats (www.fedstats.gov)? Yes No
7. How often have you used data in tables from government Web sites? Never Occasionally Monthly Weekly Daily 8. How often have you used statistical tables on the Web?
Appendix 5: Notes for Paper Test
Before we begin data collection, consider the following:
1. Please don’t move the chair, adjust your body position in the chair so that you feel comfortable. Although it’s not necessary that you remain absolutely still, please don’t move your head too much.
2. Get familiar with the table the layout and other general information.
3. Most of the questions are directly related to table data, some questions need simple comparison or analysis; one or two questions may need you to pay attention to the table footnote.
4. There are a total 8 questions. The investigator will ask you questions one by one. During your searching, you can ask the investigator to repeat the question as often as you like. When you find the answer, please say it directly.
5. Please don’t point to the screen using your finger, because this will prevent the optics module from working properly.
Appendix 6: Notes for PDF Test
Before we begin data collection, consider the following:
1. Please don’t move the chair, adjust your body positio n in the chair so that you feel comfortable. Although it’s not necessary that you remain absolutely still, please don’t move your head too much.
2. Get familiar with the table layout and other general information on tables in electronic PDF format. Please use the wheel on the mouse to scroll up and down instead of the scroll bar during the session. Use the table of contents on the left side of the screen to select a table; use the “window” menu on the menu bar to toggle from the life tables to population tables.
3. Most of the questions are directly related to table data, some questions need simple comparison or analysis; one or two questions may need you to pay attention to the table footnote.
4. There are a total 8 questions. The investigator will ask you questions one by one. During your searching, you can ask the investigator to repeat the question as often as you like. When you find the answer, please say it directly.
5. Please don’t point to the screen using your finger, because this will prevent the optics module from working properly.
Appendix 7: Questions
Start time:
1. (Life table #3) In 1996 how many more years was a 50-year-old (or 40-year-old) woman expected to live?
2. (Life table #3) Across all groups, wha t happens to the difference in life expectancy between males and females as people age?
3. (Life table #5) What happened to the difference in age expectancy of males and females between 1900 and 1996?
4. (Population table #14) In 1997 what was the resident population of all females?
5. (Population table #14) In 1988 what was the resident population of the 15-19 (or 14-17) years age group?
6. (Population table #14) In 1990, by what amount in the total population has the data been adjusted?
7. (Population table #26) What was the population of Utah (or New Jersey) in 1994?
8. (Population table #26) Compared to the population information from 1997, which two states have decreased in population size since 1970?
Appendix 8: Post-Tasks Survey
1. Is this test your first experience with eye tracking, how do feel about it?
2. Did you have any problems using the tables?
3. What suggestions could you give us to improve the performance of the eye-tracking study?
Appendix 9: An Example Set of Fixation Plots (PDF)
Figure 20. Fixplot for