Liver fat and sex hormone binding globulin affect insulin resistance in perimenopausal women: The Study of Women Across the Nation (SWAN).
By
Kylie Kavanagh
A Master’s Paper submitted to the faculty of the University of North Carolina at Chapel Hill
In partial fulfillment of the requirements for the degree of Master of Public Health in
the Public Health Leadership Program.
Chapel Hill
2011
___________________________ Advisor signature/printed name
Second Reader Signature/printed name
Coauthors that contributed by student advising, and data collection were Mark A. Espeland1, Kim Sutton-Tyrell2, and Rachel P. Wildman3
1
Wake Forest University School of Medicine, Department of Biostatistical Sciences 2
University of Pittsburgh, Department of Epidemiology 3
Albert Einstein College of Medicine, Department of Epidemiology and Population Health Running title: Liver fat, SHBG and hyperinsulinemia in women.
Address for Correspondence: Kylie Kavanagh
Department of Pathology Section on Comparative Medicine and Lipid Sciences Wake Forest University Health Sciences
Medical Center Blvd.
Winston-Salem, NC 27127 U.S.A.
Phone: (336) 713-1475 FAX: (336) 716-1515
Email: [email protected]
Formatted for Obesity (Nature Publishing Group) Figures: 2
Tables: 5
Abstract
Liver fat is recognized as a separate and important contributor to metabolic disease development. The liver is an insulin responsive tissue that contributes significantly to both whole body insulin sensitivity and availability of sex steroids through the production of sex hormone binding globulin (SHBG). Our objective was to describe the relationship between ectopic liver fat, insulin resistance, and hormonal profile in perimenopausal women. The Study of Women Across the Nation (SWAN) is a cross sectional multiethnic population of women recruited from multiple geographic areas during their perimenopausal years for longitudinal evaluation. A subset of women from SWAN (n=208) were evaluated from the Pittsburgh site as part of the SWAN-Heart study. Women had computed tomography scans to quantify visceral and subcutaneous adipose tissue, and liver fat. Adiposity measures, blood pressure, and menopausal stage, based on cycle irregularity, were recorded. Blood samples were collected and measured for hormonal and metabolic endpoints. We found in this overweight but healthy cohort that liver fat and SHBG were unaffected by menopausal stage or race. Both endpoints remained significantly associated with insulin after adjustment for adiposity. SHBG and liver fat had interactive effects on measured insulin concentration. Other sex hormones were not significantly associated with metabolic endpoints. Only liver fat accounted for differences in insulin across increasing SHBG quartiles, suggesting ectopic liver fat modifies SHBG. Both higher liver fat and lower SHBG have consequences for insulin sensitivity and the role of liver fat in modifying SHBG should be explored.
Introduction
Metabolic syndrome (MS) describes the clustering of obesity, insulin resistance and cardiovascular risk. Each component has been associated with the accumulation of ectopic fat in the liver [1], and ultimately fatty liver, also referred to as non-alcoholic fatty liver disease, is associated with atherosclerotic burden [2]. Aside from increasing cardiovascular morbidity and mortality, progressive accumulation of fat deposition in the liver can result in more serious liver disease, such as non-alcoholic steatohepatitis, cirrhosis, and neoplasia [3]. Fatty liver has been considered the hepatic manifestation of MS [3]; however it has been recently recognized that ectopic liver fat accumulation has an independent role that determines insulin resistance and cardiovascular risk biomarkers included in the MS definition [4-6]. This causative relationship increases the significance of epidemiological data which suggests that prevalence of fatty liver in the United States ranges from 33 – 46% of the population [7, 8]. Incidence data is sparse but one healthy cohort prospectively followed reported that 22 of 144 subjects developed fatty liver at some point in the 8.5 year follow up period [9].
Prevalence of liver fat and its consequences for MS and cardiovascular health generally increases with adipose accumulation [1, 7, 8], which is generally known to increase with aging. Weight change resultant of menopause in aging women is well documented, and is specifically related to increasing visceral adipose tissue (VAT) [10]. Visceral fat is also considered an ectopic fat depot that is highly associated with fat in the liver [11]. The Study of Women Across the Nation (SWAN) is a community-based study of women undergoing the menopausal
Results from SWAN have indicated an important relationship between sex hormone binding globulin (SHBG) and MS components [10, 13, 14]. In these reports, SHBG had a stronger relationship with obesity and metabolic disease endpoints than did estrogen or testosterone [13, 14]. SHBG is a carrier protein produced by the liver with a main function to transport sex steroids, but has potential insulin sensitizing effects independent of its transport function [15, 16]. Recently, the predictive capacity of SHBG in diabetes development has been reported in both men and women, generating new interest in this protein as a marker for the development of metabolic disease [17-19]. Sex hormones are known to change over the menopausal transition whereas SHBG remains relatively constant making it additionally attractive as a biomarker for disease [20, 21]. SHBG regulation is closely tied to liver fat, and factors that promote liver lipogenesis [22-24]. Our aim for this study was to extend previous findings regarding sex steroids and SHBG by evaluating, in a subset of the SWAN, the investigated specific relationships between liver fat, SHBG and glycemic endpoints in
perimenopausal women who are at risk for future development of MS and diabetes development. Public Health Relevance
Cardiovascular disease risk is the primary cause of death in women living in westernized societies. The menopausal transition is a period where the trajectory for risk of cardiovascular disease increases significantly, suggesting that the alterations in sex hormones towards a more androgenic profile (lower estrogen, lower SHBG) may be mechanistically involved in
determinant [27] and most public health and medical advice to aging women is directed at weight reduction and decrease in waist circumference. However, it has been recently shown that abdominal obesity alone may not increase the risk of cardiovascular disease if not accompanied by metabolic abnormalities, and this ‘healthy obese’ state may represent up to 30% of the United
States population [28, 29].
Liver fat represents a storage depot for adipose tissue that may increase without clinical signs or measurable changes in waist circumference. As mentioned above, excessive liver fat is now estimated to have very high prevalence rates in both men and women [7, 8]. In animal models of menopause, differences in liver fat and cardiovascular disease are present after hormone therapy or placebo therapy, despite no differences in body weight [30]. To prevent cardiovascular disease risk in perimenopausal women, assessment of liver fat rather than
measures of more generalized adiposity, may improve prediction of who is at risk and who may benefit most from hormone replacement therapy. SHBG has already been suggested as a
biomarker for diabetes risk [17, 18, 31]. SHBG has also been related to liver lipogenesis [24] and has a known role in determining the hormonal milieu during the menopausal transition. As current obesity rates are so high, targeting therapy by defining what may predict future events in the ‘healthy obese’ versus the ‘unhealthy obese’ has public health relevance regarding cost
savings.
Methods and Procedures
design and recruitment have been previously published [32]. Briefly, SWAN is being conducted at 7 sites: Boston, MA; Chicago, IL; the Detroit area, MI; Los Angeles, CA; Newark, NJ; Pittsburgh, PA; and Oakland, CA. A total of 3302 women aged 42–52 years were enrolled from 1996 to 1997. The current data were derived from the SWAN Heart Study, an ancillary study of SWAN, which was designed to characterize the natural history of subclinical atherosclerosis during the menopausal transition. SWAN Heart was conducted at the Pittsburgh and Chicago SWAN sites and was initiated 4 years after the SWAN baseline enrollment, with enrollment into SWAN Heart occurring across calendar years 2000–2005. To be eligible for SWAN Heart, participants must have undergone a carotid ultrasound scan at a previous SWAN visit or, if they had not, were required to meet the following criteria: have at least one intact ovary and an intact uterus, no evidence of clinical atherosclerosis (myocardial infarction, angina, intermittent claudication, cerebral ischemia, or revascularization), and no reported use of menopausal
institutional review boards of the participating institutions approved this study, and all women signed informed consent at all SWAN and SWAN Heart visits.
Liver fat, abdominal VAT and SAT measurement
Abdominal adipose tissue area was measured by using an electron beam CT scan, as described elsewhere [33]. Briefly, 6-mm transverse images were obtained with a c-150 Ultrafast CT Scanner (GE Imatron, San Francisco, CA). A selected slice between L4 and L5 was read by a single reader at the University of Pittsburgh. A pixel range of 230 to 2190 Hounsfield units (HU) was used to define fat. The area of adipose tissue was defined by using image analysis (AccuImage Diagnostics, South San Francisco, CA). A region-of-interest line was drawn at the interior of the abdominal musculature, along the fascial plane. Fat within this area was
considered to be visceral fat area (VAT). Subcutaneous fat (SAT) was calculated as the
Questionnaire data
Race, current smoking habits, and educational status were obtained from a self-reported questionnaire. Women were also asked about their menstrual bleeding patterns in the 12 months before recruitment, which were divided into the following categories: 1) pre- or early
perimenopausal (menstrual periods in the past 3 months, 2) late perimenopausal or
postmenopausal where there was > 3 months amenorrhea, 3) using MHT or 4) hysterectomized. MHT use was ascertained by self-reported use of birth control pills, estrogen pills, estrogen injection or patch, combination estrogen and progestin, or progestin pills.
Cardiometabolic risk factors
Fasting blood samples were assayed at Medical Research Laboratories (Lexington, KY), which is certified by the National Heart, Lung, and Blood Institute, Centers for Disease Control and Prevention Part II program, as previously described [36]. Serum total cholesterol, high density lipoprotein (HDL) cholesterol, and triglycerides (TG) were measured directly; and low density lipoprotein (LDL) cholesterol was calculated by using the Friedewald equation,
excluding women with concentrations of triglycerides >400 mg/dL. The homeostasis model assessment insulin resistance index (HOMA-IR) was calculated from fasting insulin and glucose as fasting insulin in μU/mL multiplied by fasting glucose in mmol/L and divided by 22.5. High
sensitivity C-reactive protein (CRP) levels were measured using an ultra-sensitive rate immunonephelometric method (BN 100, Dade-Behring, Marburg, Germany).
Hormonal assessments
Phlebotomy was performed in the morning after an overnight fast.Subjects were
analyzer (ACS-180; Bayer Diagnostics Corporation,Tarrytown, New York) using a double-antibody chemiluminescentimmunoassay with a solid-phase anti-IgG immunoglobulin
conjugatedto paramagnetic particles, antiligand antibody, and competitiveligand labeled with dimethylacridinium ester. The estradiolassay modifies the rabbit anti–estradiol-6 ACS-180 immunoassayto increase sensitivity, with a lower limit of detection (LLD)of 1.0 pg/mL (to convert to picomoles per liter, multiply by3.671). The testosterone assay modifies the rabbit polyclonalantitestosterone ACS-180 immunoassay, with an LLD of 2.19 ng/dL(to convert to nanomoles per liter, multiply by 0.0347). TheSHBG assay was developed at the central
laboratory at the Universityof Michigan, Ann Arbor, using rabbit anti-SHBG antibodies, withan LLD of 0.22 µg/mL (to convert to nanomoles per liter,multiply by 8.896). Duplicate estradiol assays were conductedwith results reported as the arithmetic mean for each subject,with a coefficient of variation of 3% to 12%. All other assayswere single determinations. Serum FSH concentrations were from a 2-site chemiluminescence immunoassay to the β subunit. Inter- and intra-assay coefficients of variation were 12.0% and 6.0%, respectively, and the lower limit of detection was 1.1 IU/L. The absolute concentrations of FSH are higher in this assay than values from many clinical laboratories, based on differences in the standards selected. An automated ACS:180-based chemiluminescent assay was developed using Bayer Diagnostics ACS:180 to determine the levels of dihydroepiandrosterone (DHEAS) in human serum.
Physical measures
circumference was measured with the participant wearing nonrestrictive undergarments, at the level of the natural waist, defined as the narrowest part of the torso as seen from the anterior aspect. For cases in which waist narrowing was difficult to determine, the measure was taken at the smallest horizontal circumference in the area between the ribs and the iliac crest. Waist to hip ratio (WHR) was calculated as the waist circumference divided by the largest horizontal
circumference below the waist. Statistical methods
Descriptive data was provided for all variables after checking that normality assumptions were met (mean ± SEM) or median and interquartile ranges were provided. Pearson’s correlation coefficients were generated for all continuous variables. Quartiles of liver fat and SHBG were generated, and trend tests were computed to study the relations in continuous variables across increasing quartiles. Partial correlation coefficients were computed after adjustment for
adiposity, or base model covariates which included menopausal status, education level, smoking, race, hormone replacement use, age and BMI. Significance was set at p <0.05 for all analyses. All statistical analyses were carried out using Statistica V9.1 (StatSoft Inc., Tulsa, OK).
Results
both correlated with all measures of adiposity (BMI, waist, WHR, VAT, and SAT; all p<0.001). Average liver attenuation was 56 HU which is comparable to liver assessments from cancer patients [34] and only 10% lower (more fatty) than healthy subjects [35] with a range that included very fatty livers and fat-free livers (5 – 77 HU). No differences in liver fat were seen with menopausal status (p=0.57) or race (p=0.16). Hormone profiles were variable as expected in the perimenopause. Women classified as pre- or early perimenopausal had significantly higher estrogen and lower FSH concentrations than late- or postmenopausal women (104 ± 12.3 vs. 44 ± 7.46 pg/mL and 36 ± 3.98 vs. 80 ± 4.85 nmol/mL, respectively; p<0.001 for both). SHBG concentrations did not differ by menopausal status (p=0.71) or race (p=0.97).
All measures of adiposity correlated significantly with liver fat (data not shown) and by trend across increasing quartiles of liver fat (Table 2). VAT had the highest association (r=-0.51, p<0.001; Figure 1A). BMI was also highly associated (r=-0.43, p<0.001; Figure 1B), however it should be noted that healthy fat-free livers were present in individuals of BMI > 40 kg/m2 and fatty liver was present in individuals that were only moderately overweight. Stage of menopause did not significantly predict the amount of VAT or liver fat measured (p=0.93 and 0.17,
respectively).
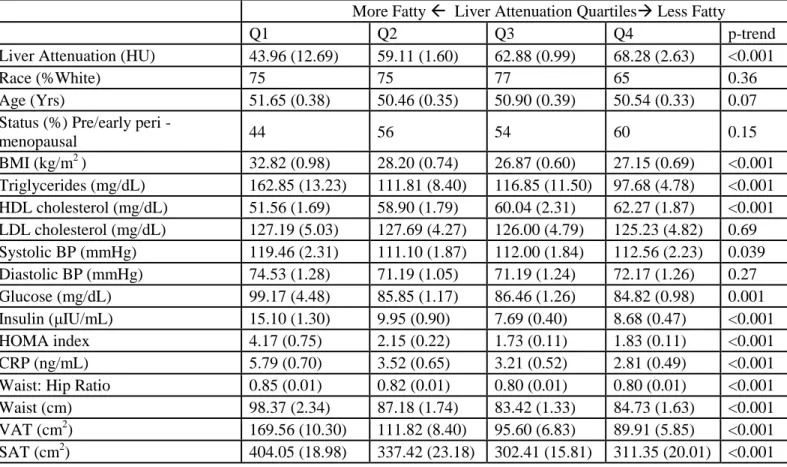
There is no agreed upon cutoff CT attenuation value for fatty liver diagnosis at present. When subjects are examined by quartile of liver fat (Table 2), it is likely that only the first quartile represents women with fatty liver, or liver predicted to have greater than 20% content as TG [34]. Most metabolic variables show a significant trend towards less healthy values with increasing liver fat, with the exception of age, LDL cholesterol and diastolic BP. Although LDL cholesterol remains unchanged across all quartiles, increasing liver fat is associated with
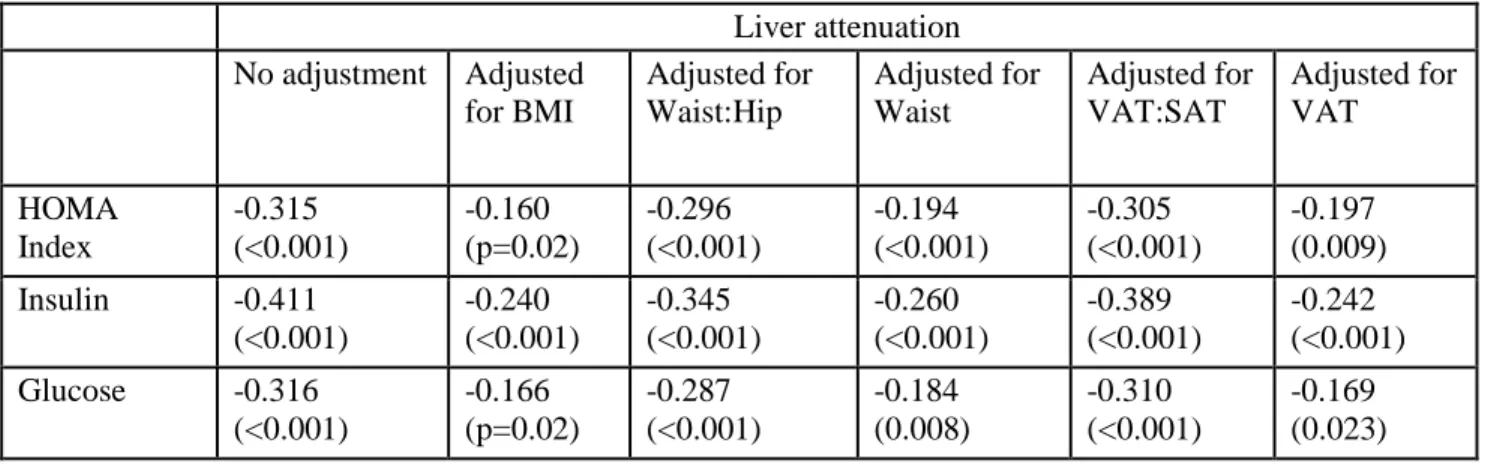
circulation. Further examination of the relationship between liver fat and glycemic endpoints (insulin, glucose and HOMA) demonstrate that liver fat is significantly associated with all measures even when measures of regional adiposity, including VAT, were accounted for (Table 3). Associations were strongest between liver fat and insulin, and BMI and VAT had the greatest modifying effects on the relationships of both insulin and glucose concentrations with liver fat.
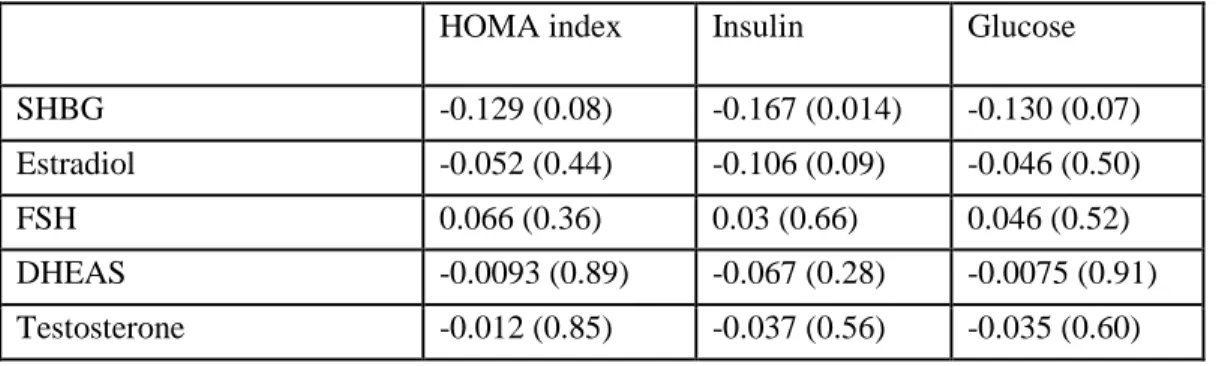
We next evaluated the relationship of endogenous sex hormones with glycemic endpoints (Table 4). After adjustment for variables known to affect metabolic health which included a measure of adiposity (BMI), only SHBG had a significant relationship with insulin (r=-0.17, p=0.01). Consistent with the hypothesis that SHBG is partly causative of metabolic disease, neither estrogen nor testosterone had a significant relationship with any metabolic endpoint after adjustment for covariates (p>0.05 for all). These sex steroids also did not differ across quartiles of liver fat (p>0.05 for all). FSH and estrogen had the expected inverse relationship (r=-0.37, p<0.05) present in women undergoing the menopausal transition. As liver fat and SHBG were both associated with insulin independently of adiposity, the interplay between these variables on insulin concentrations were examined by quartiles of liver fat and SHBG (Figure 2). Significant trends were present for both SHBG and liver fat but an interaction also appears present, with the combined effects of these two variables on insulin concentrations. Higher insulin concentrations are resultant from pancreatic compensation for tissue insulin resistance and are characteristic of a prediabetic state [37, 38]. Highest insulin concentrations were seen with lowest SHBG
concentrations and the fattiest livers and lower insulin concentrations were seen with fatty livers that had high SHBG.
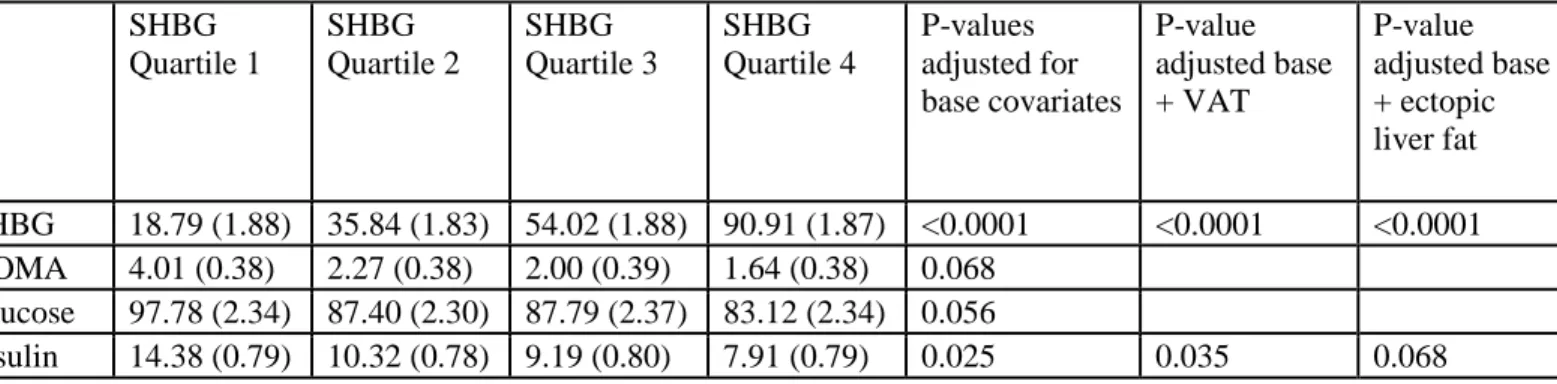
after adjustment for base covariates (p=0.025). We then looked at the modifying effects of metabolically important fat depots and found that only liver fat, and not VAT, attenuated this relationship (p=0.07).
Discussion
In this biracial sample of healthy perimenopausal women, we demonstrate the importance of ectopic liver fat in modulating metabolic disease risk factors. We report also for the first time the individual and combined effects of liver fat and endogenous hormonal profile on metabolic endpoints. The data demonstrates that circulating insulin concentrations is the endpoint most strongly affected by the interplay between liver fat and SHBG. SHBG levels, which were consistent across race and menopausal stage, were influenced by liver fat and determined resultant insulin concentrations. Elevated fasting insulin values are a consistent feature of
patients at risk for MS or prediabetes [39, 40] and normoglycemic persons who go on to develop overt diabetes [37, 38]. Increased insulin reflects early hepatic insensitivity, and changes in insulin secretory patterns that result of glucolipotoxicity, which over time progress to pancreatic failure.
differences were seen in insulin sensitivity. In a similar investigation where 20 obese patients were matched on VAT, individuals with high liver fat had dramatically lower hepatic and whole body insulin sensitivity [4]. In other investigations liver fat was found to be a highly significant and independent predictor of circulating insulin even after adjustment for BMI [11], and in a reverse association study, insulin and alanine transferase levels (representing liver injury) were found to be predictive of fatty liver [8]. Further supportive evidence is found in lipoatrophic humans and animal models, where other fat depots are absent, but ectopic fat in the liver is still present and insulin resistance is an important phenotype [43]. The liver is highly insulin
responsive, stimulating lipogenesis and fat storage within the hepatocyte as TG. In insulin resistance this lipogenic pathway is enhanced, leading to greater accumulation of fat and progression of hepatocellular dysfunction [44].
Our data supports this concept with differences in SHBG concentrations in healthy women being statistically accounted for by the amount of liver fat estimated to be present. A larger prospective study that quantified changes in liver fat, insulin sensitivity and SHBG in men and women also showed a strong correlation between the change in liver fat and change in SHBG concentration [15].
Accumulation of adipose tissue with the menopausal transition has been considered a central cause for increased cardiometabolic disease risk in aging women. Longitudinal data from SWAN has shown that the early stages of menopause is associated with increasing waist
insulin sensitivity [16]. In our study of healthy women, we did not see differences in specific fat depots or SHBG with menopausal stage, but significant relationships between fat depots and SHBG across all stages. Further, SHBG and liver fat were associated with circulating insulin. We propose that the menopausal transition may not result in changes in insulin sensitivity if adipose accumulation is avoided, as has been suggested by Guthrie et al. [39].
sensitivity continues over time until eventual consequences such as MS, diabetes, or steatohepatitis develops.
Concentrations of SHBG approximating 30% that of healthy controls (or a difference of 16-17 nmol/L) have been estimated as the difference between normal and insulin resistant or diabetic people [17, 19]. This represents the approximate difference between the lowest quartile of SHBG that we report and the overall SHBG average reported for the 3,302 women surveyed as part of the entire SWAN cohort [14]. Women in this lowest quartile were notably more insulin resistant as indicated by HOMA-IR, fasting insulin and glucose, than the rest of the women included in this study. The association between insulin resistance and SHBG, independent of body weight or BMI, is seen consistently in postmenopausal women and men [14, 20, 40]. Women have higher SHBG levels than men, and a larger absolute difference in SHBG
concentrations between healthy and diabetic subjects [17, 18]. This sex difference exists despite having similar amounts of liver fat when differences in VAT and SAT are present [11]. In a study of premenopausal or early perimenopausal women (mean age of 42 years) and men, liver fat also associated with insulin concentrations in a manner that is not sex specific [11]. So for a given level of hepatic steatosis, younger women have higher SHBG and protection from diabetes when higher estrogen concentrations are likely. However, as they progress through the
menopause, accumulation of liver fat initiates a downward cycle of SHBG and insulin
decreases in those who develop insulin resistance [21]. More research regarding the sequence of events regarding liver fat accumulation, SHBG decrease, and insulin sensitivity is warranted.
Limitations to our study include the relatively small sample size and limited ethnicities represented. The cross sectional study design does not allow causal relationships to be deduced. We also did not include alcohol or dietary factors in our models, both of which may have been a modifying factor for liver fat in this population of women. However a strength of the study includes the measurement of multiple fat depots in a well-characterized group of women undergoing the menopausal transition. Despite the relative good health of these women, we report that increasing liver fat specifically drives insulin resistance, as indicated by circulating insulin concentrations, and that this liver fat partially explains variation in SHBG, which also independently modulates insulin sensitivity. In conclusion, this data supports the hypothesis that increasing ectopic liver fat over the menopausal transition causes a decline in glycemic control which contributes to the increasing metabolic disease seen in aging, post-menopausal women. Public Health Implications
As awareness grows regarding the variability in metabolic health and related health risks that accompanies the definition of the obese state by BMI [28, 29, 53], understanding the
mechanisms by which health varies across levels of fatness is important. The changing
demographics of Western societies also show that aging women is the segment of the population that will experience the fastest growth, with significant longevity beyond the menopausal
which was then refined as abdominal obesity, and perhaps now ectopic liver fat will be the next iteration for understanding risk of metabolic disease.
Our data adds to the growing body of knowledge that suggests that liver fat specifically promotes reduction in SHBG and increases in insulin prior to the development of overt metabolic disease in perimenopausal women. Currently, few specific therapeutic options exist for the reduction of liver fat. However, those women found to be at risk by virtue of their fat distribution could be additionally counseled in lifestyle interventions, vitamin supplementation, and
potentially judiciously timed hormone therapy. In the future, directed therapies to reduce liver fat and/or increase SHBG may be available to prevent age-associated metabolic disease
development and increased risk of death with diabetes and cardiovascular disease in women.
Acknowledgements
The Study of Women’s Health Across the Nation (SWAN) has grant support from the NIH,
Department of Health and Human Services, through the National Institute on Aging, the National Institute of Nursing Research, and the NIH Office of Research on Women’s Health (grants NR004061, AG012505, AG012535, AG012531, AG012539, AG012546, AG012553,
AG012554, AG012495). The SWAN Heart Study is supported by the National Heart, Lung, and Blood Institute (grants HL065581, HL065591, and HL089862). Kavanagh is additionally
References
1. McKimmie, R.L., et al., Hepatic steatosis and subclinical cardiovascular disease in a cohort enriched for type 2 diabetes: the Diabetes Heart Study. Am J Gastroenterol, 2008. 103(12): p. 3029-35. 2. Sookoian, S. and C.J. Pirola, Non-alcoholic fatty liver disease is strongly associated with carotid
atherosclerosis: a systematic review. J Hepatol, 2008. 49(4): p. 600-7.
3. Bellentani, S., et al., Epidemiology of non-alcoholic fatty liver disease. Dig Dis, 2010. 28(1): p. 155-61. 4. Fabbrini, E., et al., Intrahepatic fat, not visceral fat, is linked with metabolic complications of obesity.
Proc Natl Acad Sci U S A, 2009. 106(36): p. 15430-5.
5. Magkos, F., et al., Increased whole-body adiposity without a concomitant increase in liver fat is not associated with augmented metabolic dysfunction. Obesity (Silver Spring), 2010. 18(8): p. 1510-5. 6. Nguyen-Duy, T.B., et al., Visceral fat and liver fat are independent predictors of metabolic risk factors
in men. Am J Physiol Endocrinol Metab, 2003. 284(6): p. E1065-71.
7. Szczepaniak, L.S., et al., Magnetic resonance spectroscopy to measure hepatic triglyceride content: prevalence of hepatic steatosis in the general population. Am J Physiol Endocrinol Metab, 2005. 288(2): p. E462-8.
8. Williams, C.D., et al., Prevalence of nonalcoholic fatty liver disease and nonalcoholic steatohepatitis among a largely middle-aged population utilizing ultrasound and liver biopsy: a prospective study. Gastroenterology, 2011. 140(1): p. 124-31.
9. Bedogni, G., et al., Incidence and natural course of fatty liver in the general population: the Dionysos study. Hepatology, 2007. 46(5): p. 1387-91.
10. Janssen, I., et al., Testosterone and Visceral Fat in Midlife Women: The Study of Women's Health Across the Nation (SWAN) Fat Patterning Study. Obesity (Silver Spring), 2009.
11. Westerbacka, J., et al., Women and men have similar amounts of liver and intra-abdominal fat, despite more subcutaneous fat in women: implications for sex differences in markers of cardiovascular risk. Diabetologia, 2004. 47(8): p. 1360-9.
12. Wildman, R.P., et al., Subcutaneous adipose tissue in relation to subclinical atherosclerosis and cardiometabolic risk factors in midlife women. Am J Clin Nutr, 2011.
13. Janssen, I., et al., Menopause and the metabolic syndrome: the Study of Women's Health Across the Nation. Arch Intern Med, 2008. 168(14): p. 1568-75.
14. Sutton-Tyrrell, K., et al., Sex-hormone-binding globulin and the free androgen index are related to cardiovascular risk factors in multiethnic premenopausal and perimenopausal women enrolled in the Study of Women Across the Nation (SWAN). Circulation, 2005. 111(10): p. 1242-9.
15. Peter, A., et al., Relationships of circulating sex hormone-binding globulin with metabolic traits in humans. Diabetes, 2010. 59(12): p. 3167-73.
16. Heinlein, C.A. and C. Chang, The roles of androgen receptors and androgen-binding proteins in nongenomic androgen actions. Mol Endocrinol, 2002. 16(10): p. 2181-7.
17. Ding, E.L., et al., Sex differences of endogenous sex hormones and risk of type 2 diabetes: a systematic review and meta-analysis. JAMA, 2006. 295(11): p. 1288-99.
18. Ding, E.L., et al., Sex hormone-binding globulin and risk of type 2 diabetes in women and men. N Engl J Med, 2009. 361(12): p. 1152-63.
19. Jayagopal, V., et al., The biological variation of testosterone and sex hormone-binding globulin (SHBG) in polycystic ovarian syndrome: implications for SHBG as a surrogate marker of insulin resistance. J Clin Endocrinol Metab, 2003. 88(4): p. 1528-33.
20. Akin, F., et al., SHBG levels correlate with insulin resistance in postmenopausal women. Eur J Intern Med, 2009. 20(2): p. 162-7.
21. Akin, F., M. Bastemir, and E. Alkis, Effect of insulin sensitivity on SHBG levels in premenopausal versus postmenopausal obese women. Adv Ther, 2007. 24(6): p. 1210-20.
22. Selva, D.M. and G.L. Hammond, Thyroid hormones act indirectly to increase sex hormone-binding globulin production by liver via hepatocyte nuclear factor-4alpha. J Mol Endocrinol, 2009. 43(1): p. 19-27.
23. Selva, D.M. and G.L. Hammond, Peroxisome-proliferator receptor gamma represses hepatic sex hormone-binding globulin expression. Endocrinology, 2009. 150(5): p. 2183-9.
25. Janssen, I., et al., Testosterone and visceral fat in midlife women: the Study of Women's Health Across the Nation (SWAN) fat patterning study. Obesity (Silver Spring), 2010. 18(3): p. 604-10.
26. Carr, M.C., The emergence of the metabolic syndrome with menopause. J Clin Endocrinol Metab, 2003. 88(6): p. 2404-11.
27. Carr, D.B., et al., Intra-abdominal fat is a major determinant of the National Cholesterol Education Program Adult Treatment Panel III criteria for the metabolic syndrome. Diabetes, 2004. 53(8): p. 2087-94.
28. Wildman, R.P., et al., Cardiovascular Disease Risk of Abdominal Obesity vs. Metabolic Abnormalities. Obesity (Silver Spring), 2011. 19(4): p. 853-60.
29. Wildman, R.P., et al., The obese without cardiometabolic risk factor clustering and the normal weight with cardiometabolic risk factor clustering: prevalence and correlates of 2 phenotypes among the US population (NHANES 1999-2004). Arch Intern Med, 2008. 168(15): p. 1617-24.
30. Kavanagh, K., et al., Estrogen decreases atherosclerosis in part by reducing hepatic
acyl-CoA:cholesterol acyltransferase 2 (ACAT2) in monkeys. Arterioscler Thromb Vasc Biol, 2009. 29(10): p. 1471-7.
31. Ding, E.L., et al., Plasma sex steroid hormones and risk of developing type 2 diabetes in women: a prospective study. Diabetologia, 2007. 50(10): p. 2076-84.
32. Sowers, M., Design, survey sampling and recruitment methods of SWAN: a multi-cetner, multi-ethnic community-based cohort study of women and the menopausal transition., in Menopause: biology and pathobiology., M.R. Lobos R, Kelsey JL, Editor. 2000, Academic Press: San Diego. p. 175 - 188. 33. Vega, G.L., et al., Influence of body fat content and distribution on variation in metabolic risk. J Clin
Endocrinol Metab, 2006. 91(11): p. 4459-66.
34. Kodama, Y., et al., Comparison of CT methods for determining the fat content of the liver. AJR Am J Roentgenol, 2007. 188(5): p. 1307-12.
35. Davidson, L.E., et al., Protocol for measurement of liver fat by computed tomography. J Appl Physiol, 2006. 100(3): p. 864-8.
36. Demerath, E.W., et al., Visceral adiposity and its anatomical distribution as predictors of the metabolic syndrome and cardiometabolic risk factor levels. Am J Clin Nutr, 2008. 88(5): p. 1263-71.
37. Tabak, A.G., et al., Trajectories of glycaemia, insulin sensitivity, and insulin secretion before diagnosis of type 2 diabetes: an analysis from the Whitehall II study. Lancet, 2009. 373(9682): p. 2215-21. 38. Hanley, A.J., et al., Insulin resistance, beta cell dysfunction and visceral adiposity as predictors of
incident diabetes: the Insulin Resistance Atherosclerosis Study (IRAS) Family study. Diabetologia, 2009. 52(10): p. 2079-86.
39. Guthrie, J.R., et al., Impaired fasting glycaemia in middle-aged women: a prospective study. Int J Obes Relat Metab Disord, 2001. 25(5): p. 646-51.
40. Jansson, P.A., et al., Endocrine abnormalities in healthy first-degree relatives of type 2 diabetes patients--potential role of steroid hormones and leptin in the development of insulin resistance. Eur J Clin Invest, 2002. 32(3): p. 172-8.
41. Hanley, A.J., et al., Elevations in markers of liver injury and risk of type 2 diabetes: the insulin resistance atherosclerosis study. Diabetes, 2004. 53(10): p. 2623-32.
42. Vozarova, B., et al., High alanine aminotransferase is associated with decreased hepatic insulin sensitivity and predicts the development of type 2 diabetes. Diabetes, 2002. 51(6): p. 1889-95. 43. Reitman, M.L., et al., Lipoatrophy revisited. Trends Endocrinol Metab, 2000. 11(10): p. 410-6. 44. Capeau, J., Insulin resistance and steatosis in humans. Diabetes Metab, 2008. 34(6 Pt 2): p. 649-57. 45. Crave, J.C., et al., Differential effects of insulin and insulin-like growth factor I on the production of
plasma steroid-binding globulins by human hepatoblastoma-derived (Hep G2) cells. J Clin Endocrinol Metab, 1995. 80(4): p. 1283-9.
46. Edlefsen, K.L., et al., The effects of postmenopausal hormone therapy on serum estrogen, progesterone, and sex hormone-binding globulin levels in healthy postmenopausal women. Menopause, 2010. 17(3): p. 622-9.
47. Peiris, A.N., et al., Relationship of androgenic activity to splanchnic insulin metabolism and peripheral glucose utilization in premenopausal women. J Clin Endocrinol Metab, 1987. 64(1): p. 162-9.
48. Vassilatou, E., et al., Increased androgen bioavailability is associated with non-alcoholic fatty liver disease in women with polycystic ovary syndrome. Hum Reprod, 2010. 25(1): p. 212-20.
50. Kanaya, A.M., et al., Glycemic effects of postmenopausal hormone therapy: the Heart and Estrogen/progestin Replacement Study. A randomized, double-blind, placebo-controlled trial. Ann Intern Med, 2003. 138(1): p. 1-9.
51. Margolis, K.L., et al., Effect of oestrogen plus progestin on the incidence of diabetes in postmenopausal women: results from the Women's Health Initiative Hormone Trial. Diabetologia, 2004. 47(7): p. 1175-87.
52. Blouin, K., et al., Effect of a six-week national cholesterol education program step 1 diet on plasma sex hormone-binding globulin levels in overweight premenopausal women. Metab Syndr Relat Disord, 2007. 5(1): p. 22-33.
53. Wildman, R.P., Healthy obesity. Curr Opin Clin Nutr Metab Care, 2009. 12(4): p. 438-43. 54. Sonnenschein, E. and J.A. Brody, Effect of population aging on proportionate mortality from heart
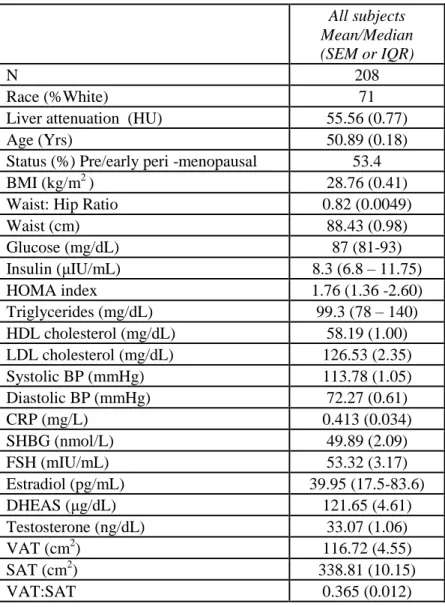
Table 1. Characteristics of the cohort.
All subjects Mean/Median (SEM or IQR)
N 208
Race (%White) 71
Liver attenuation (HU) 55.56 (0.77)
Age (Yrs) 50.89 (0.18)
Status (%) Pre/early peri -menopausal 53.4
BMI (kg/m2) 28.76 (0.41)
Waist: Hip Ratio 0.82 (0.0049)
Waist (cm) 88.43 (0.98)
Glucose (mg/dL) 87 (81-93)
Insulin (μIU/mL) 8.3 (6.8 – 11.75)
HOMA index 1.76 (1.36 -2.60)
Triglycerides (mg/dL) 99.3 (78 – 140) HDL cholesterol (mg/dL) 58.19 (1.00) LDL cholesterol (mg/dL) 126.53 (2.35) Systolic BP (mmHg) 113.78 (1.05) Diastolic BP (mmHg) 72.27 (0.61)
CRP (mg/L) 0.413 (0.034)
SHBG (nmol/L) 49.89 (2.09)
FSH (mIU/mL) 53.32 (3.17)
Estradiol (pg/mL) 39.95 (17.5-83.6)
DHEAS (μg/dL) 121.65 (4.61)
Testosterone (ng/dL) 33.07 (1.06)
VAT (cm2) 116.72 (4.55)
SAT (cm2) 338.81 (10.15)
Table 2. Metabolic characteristics and adiposity of subjects based on quartile of ectopic liver fat.
More Fatty Liver Attenuation Quartiles Less Fatty
Q1 Q2 Q3 Q4 p-trend
Liver Attenuation (HU) 43.96 (12.69) 59.11 (1.60) 62.88 (0.99) 68.28 (2.63) <0.001
Race (%White) 75 75 77 65 0.36
Age (Yrs) 51.65 (0.38) 50.46 (0.35) 50.90 (0.39) 50.54 (0.33) 0.07 Status (%) Pre/early peri
-menopausal 44 56 54 60 0.15
Table 3. Correlation coefficients (p-value) of liver fat with glycemic indices. Liver attenuation
No adjustment Adjusted for BMI Adjusted for Waist:Hip Adjusted for Waist Adjusted for VAT:SAT Adjusted for VAT HOMA Index -0.315 (<0.001) -0.160 (p=0.02) -0.296 (<0.001) -0.194 (<0.001) -0.305 (<0.001) -0.197 (0.009) Insulin -0.411
(<0.001) -0.240 (<0.001) -0.345 (<0.001) -0.260 (<0.001) -0.389 (<0.001) -0.242 (<0.001) Glucose -0.316
Table 4. Partial correlation coefficients (p-values) adjusted for menopausal status, education, smoking, race, hormone replacement use, age and BMI.
HOMA index Insulin Glucose
Table 5. Regression results for differences in glycemic indices by quartile of sex hormone binding globulin adjusted for base model covariates (menopausal status, education, smoking, race, hormone replacement use, age and BMI) and regional adipose tissue.
SHBG Quartile 1
SHBG Quartile 2
SHBG Quartile 3
SHBG Quartile 4
P-values adjusted for base covariates
P-value adjusted base + VAT
P-value adjusted base + ectopic liver fat
SHBG 18.79 (1.88) 35.84 (1.83) 54.02 (1.88) 90.91 (1.87) <0.0001 <0.0001 <0.0001 HOMA 4.01 (0.38) 2.27 (0.38) 2.00 (0.39) 1.64 (0.38) 0.068
Glucose 97.78 (2.34) 87.40 (2.30) 87.79 (2.37) 83.12 (2.34) 0.056
Figure Legends
Figure 1. Association of liver fat content as measured by computed tomography and visceral adipose tissue (A) and BMI (B).
Figure 2. Interaction of liver fat and sex hormone binding globulin on fasting insulin levels in healthy, overweight perimenopausal women.
A)
20
18
16
~ 1-1
.e
;::> 12
"=
.::> 10
~ 8
;:;
=
6... 4
Reducing Estrogen
across menopausal transition
1'Insulin release
~~---. ~~---. ~~---. ~~---. ~SHBG