Mammography: A
Pic-torial Essay
1
Etta D. Pisano, MD • Elodia B. Cole • Bradley M. Hemminger, MS
Martin J. Yaffe, PhD • Stephen R. Aylward, PhD • Andrew D. A.
Maidment, PhD • R. Eugene Johnston, PhD • Mark B. Williams, PhD
Loren T. Niklason, PhD • Emily F. Conant, MD • Laurie L. Fajardo, MD
Daniel B. Kopans, MD • Marylee E. Brown • Stephen M. Pizer, PhD
Digital mammography systems allow manipulation of fine differences in im-age contrast by means of imim-age processing algorithms. Different display algo-rithms have advantages and disadvantages for the specific tasks required in breast imaging––diagnosis and screening. Manual intensity windowing can produce digital mammograms very similar to standard screen-film mammo-grams but is limited by its operator dependence. Histogram-based intensity windowing improves the conspicuity of the lesion edge, but there is loss of detail outside the dense parts of the image. Mixture-model intensity win-dowing enhances the visibility of lesion borders against the fatty background, but the mixed parenchymal densities abutting the lesion may be lost. Con-trast-limited adaptive histogram equalization can also provide subtle edge in-formation but might degrade performance in the screening setting by en-hancing the visibility of nuisance information. Unsharp masking enhances the sharpness of the borders of mass lesions, but this algorithm may make even an indistinct mass appear more circumscribed. Peripheral equalization displays lesion details well and preserves the peripheral information in the surrounding breast, but there may be flattening of image contrast in the nonperipheral portions of the image. Trex processing allows visualization of both lesion detail and breast edge information but reduces image contrast.
Abbreviations: CLAHE = contrast-limited adaptive histogram equalization, HIW = histogram-based intensity windowing, MIW = manual in-tensity windowing, MMIW = mixture-model inin-tensity windowing
Index terms: Breast radiography, 00.1215 • Images, display, 00.1215 • Images, processing, 00.1215 • Radiography, digital, 00.1215 RadioGraphics 2000; 20:1479–1491
1From the Department of Radiology (E.D.P., B.M.H., S.R.A., R.E.J., M.E.B.), Lineberger Comprehensive Cancer Center (E.B.C.), and
Depart-ment of Computer Science (S.M.P.), University of North Carolina, 101 Manning Dr, Chapel Hill, NC 27514-4226; the DepartDepart-ment of Medical Im-aging, University of Toronto, Ontario, Canada (M.J.Y.); the Department of Radiology, Thomas Jefferson University, Philadelphia, Pa (A.D.A.M.); the Department of Radiology, University of Virginia, Charlottesville (M.B.W.); the Department of Radiology, University of Pennsylvania, Philadel-phia (E.F.C.); the Department of Radiology, Johns Hopkins University, Baltimore, Md (L.L.F.); and the Department of Radiology, Massachusetts General Hospital, Boston (D.B.K.). Recipient of a Certificate of Merit award for a scientific exhibit at the 1998 RSNA scientific assembly. Received October 5, 1999; revision requested November 12; final revision received February 7, 2000; accepted February 16. Supported in part by grant RO1-CA60193-05 from the National Cancer Institute; grant 282-97-0078 from the Office of Women’s Health, Department of Health and Human Ser-vices; grant DAMD 17-94-J-4345 from the U.S. Army Medical Research and Material Command; grant 7289 from the Canadian Breast Cancer Re-search Initiative; and grants RO1-CA6019, RO1-CA75145-01A1, and RO1-CA60183 from the National Cancer Institute. Address correspon-dence to E.D.P. (e-mail: [email protected]).
Introduction
The effectiveness of digital mammography in de-tection of breast cancer is currently under investi-gation. This imaging modality separates image acquisition and image display, thus allowing opti-mization of both.
In screen-film mammography, film serves as the medium for both image acquisition and dis-play. Screen-film mammography has limited de-tection capability for low-contrast lesions in dense breasts. This limitation poses a problem for the estimated 40% of women with dense breasts who undergo mammography (1). In this population, diagnosis often requires additional imaging, which results in more radiation expo-sure for the patient. When additional images fail to provide useful diagnostic information, a deci-sion must be made as to whether the suspicious regions require biopsy or short- or long-term fol-low-up. Because of the expense and risk associ-ated with additional radiation exposure and sur-gery, any method of image presentation that in-creases the diagnostic conspicuity of lesions in breast tissue, especially in dense tissue, would be a significant advance.
Digital mammography systems, unlike screen-film mammography systems, allow manipulation of fine differences in image contrast by means of image processing algorithms. As a result, very subtle differences between abnormal and normal but dense tissue can be made more obvious. In this article, we illustrate the appearances pro-duced by various image processing algorithms for display of digital mammograms and discuss how these algorithms may affect the ability of radiolo-gists to interpret the images.
Selected Mammographic Lesions
The four cases used in this article to demonstrate the image processing algorithms were selected to show the range of types of mammographic le-sions and the potential advantages and disadvan-tages of the different display algorithms. All of the digital mammograms shown in this article were acquired under research protocols approvedby the investigational review boards at the in-volved institutions.
The first case involves a partially obscured and partially circumscribed mass at screen-film mam-mography (Fig 1a), which proved to be a simple cyst at ultrasonography and needle aspiration. A digital mammogram of this case was acquired at the University of North Carolina, Chapel Hill, with a SenoScan full-field digital mammography unit (Fischer Imaging, Denver, Colo).
The second case involves two indistinct masses at screen-film mammography (Fig 2a, 2b). Both masses proved to be infiltrating ductal carcinomas with accompanying ductal carcinoma in situ at open surgical biopsy with needle local-ization. A digital mammogram of this case was acquired at Massachusetts General Hospital, Boston, with a Senographe 2000D full-field digi-tal mammography system (GE Medical Systems, Milwaukee, Wis).
The third case involves a palpable, spiculated mass at screen-film mammography (Fig 3a, 3b), which proved to be an infiltrating ductal carci-noma with associated cribriform and solid-type ductal carcinoma in situ at open surgical biopsy. A digital mammogram of this case was acquired at the University of North Carolina with the Fischer Imaging unit.
The fourth case involves a pleomorphic cluster of calcifications at screen-film mammography (Fig 4a), which proved to be atrophic breast tis-sue at stereotactically guided core biopsy. A digi-tal mammogram of this case was acquired at the University of Virginia, Charlottesville, with a Trex Digital Mammography System (Trex Medi-cal, Danbury, Conn).
Overview of the Digital
Mammography Systems
d. e. f. g.
Figure 1. (a) Photographic magnification of a craniocaudal screen-film mammogram shows a cyst. (b–g) Photo-graphic magnifications of a digital mammogram processed with MIW (b), HIW (c), MMIW (d), CLAHE (e), unsharp masking (f), and peripheral equalization (g) show the same lesion.
a. d.
b. e.
c. f.
Figure 3. (a) Me-diolateral oblique screen-film mammo-gram shows a spiculated mass in the axillary por-tion of the breast, which proved to be an infiltrat-ing ductal carcinoma with associated cribri-form and solid-type ductal carcinoma in situ at open surgical biopsy. (b) Photographic mag-nification of a shows the lesion. (c, d) Digital mammogram processed with unsharp masking (c) and photographic magnification of c (d) show the lesion.
a. c.
a. b. c.
d. e. f.
g. i.
the number of micrometers per pixel, the smaller the features that can be measured in the image produced. As for contrast resolution, the Fischer Imaging unit offers 12 bits/pixel, whereas the GE Medical Systems and Trex Medical units offer 14 bits/pixel. Increasing contrast gradation provides the opportunity to distinguish finer and finer density differences between features in the image. However, it may not always be possible for a hu-man observer to distinguish finer and finer grada-tions of gray owing to the limitagrada-tions of visual perception and display devices. Detailed descrip-tions of the image acquisition hardware are pro-vided elsewhere (2).
Image Processing Algorithms
Each manufacturer has developed image process-ing algorithms to use with its acquisition system. In addition, a number of algorithms have been developed by independent investigators for use with digital mammograms. The seven algorithms demonstrated in this article are manual intensity windowing (MIW), histogram-based intensity windowing (HIW), mixture-model intensity windowing (MMIW), contrast-limited adaptive histogram equalization (CLAHE), unsharp mask-ing, peripheral equalization, and Trex processing.Intensity windowing algorithms act on indi-vidual pixels within an image. A small portion of the full intensity range of an image is selected and then remapped to the full intensity range of the display device. This process allows selection of specific intensity values of interest. For ex-ample, intensity values that represent abnormal tissue and dense but normal tissue are selected to allow exaggeration of small differences in inten-sity values between the two objects, thus poten-tially increasing the conspicuity of any abnormal regions. The three versions of intensity window-ing demonstrated in this article are MIW, HIW, and MMIW. These algorithms differ in how in-tensity values of interest are selected.
Manual Intensity Windowing
MIW was performed by an expert mammography technologist, who interactively adjusted the con-trast levels as appropriate for each image using a
high-brightness monitor (model 1654; Orwin As-sociates, Amityville, NY) and an UltraSPARC 2200 workstation (Sun Microsystems, Mountain View, Calif). The goal of this algorithm is to manually reproduce the appearance of a screen-film mammogram.
Digital mammograms processed with MIW can be very similar to standard screen-film mammograms of the same patients (Figs 1b, 2c, 4b). In the second case, the center of the larger mass is very light on the image processed with MIW (Fig 2c). This appearance is due to the technologist’s selection of a window that allowed visualization of both lesions in the image. Both lesions were obvious to her trained eyes. To keep the smaller lesion from appearing less obvious or even disappearing completely, she windowed the larger lesion so that it was slightly lighter than ideal.
This case points out the obvious limitation of this interactive windowing algorithm: It is opera-tor dependent. A less experienced operaopera-tor might choose different windows that could obscure some of the visible disease.
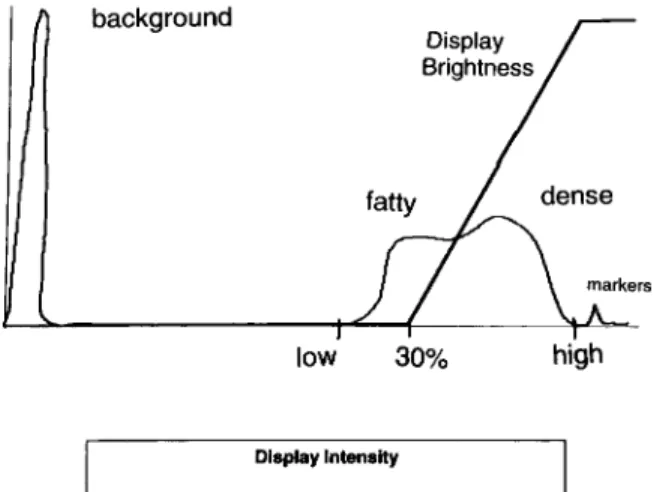
Histogram-based Intensity Windowing
intensity window range is automatically selected on the basis of the percentile position within the composite breast tissue class (ie, fatty, dense, and muscle) that allows windowing over the overall breast tissue present in that patient (Fig 5).
For example, if the patient’s breast is mainly fatty, the window selected will allow the full range of contrast across the part of the histogram repre-senting the fatty portions of the breast. If the breast is mixed fatty and dense, the window will be selected on the basis of the portions of the his-togram that represent those areas. In theory, this process should improve the detection of mammo-graphic features in comparison with fixed intensity windowing, which cannot adapt to individual im-ages. The adaptability of HIW to individual breast types makes it especially appropriate for digital mammograms because the breast tissue is always imaged with reasonable contrast, but the range of digital values containing the breast tissue can vary significantly depending on the acquisition param-eters.
This automated windowing algorithm was used in the first and fourth cases (Figs 1c, 4c). In the case of the cyst, note the improved conspicuity of the lesion edge in the digital mammogram (Fig 1c) compared with that in the screen-film mam-mogram (Fig 1a). Part of the difference in the vis-ibility of the lesion border and the accompanying benign calcifications is attributable to differences in positioning and compression. There is some loss of detail outside the dense parts of the HIW-processed image (Fig 1c) when compared with the screen-film image (Fig 1a) and the digital mammograms processed with other algorithms. This loss of detail might detract from use of this algorithm for screening.
Mixture-Model Intensity Windowing
MMIW provides region-specific intensity win-dow settings for mammograms. It operates by au-tomatically identifying the five major regions in a mammogram: background, uncompressed fat, compressed fat, dense tissue, and muscle. It identifies these regions using a combination of geometric (ie, gradient magnitude ridge traversal) and statistical (ie, Gaussian mixture modeling) techniques. Once these regions have been identi-fied, their histograms can be selectively analyzed to determine region-specific intensity window settings. In our selected cases, MMIW was used to determine intensity window settings specific to the dense regions in the mammogram (3).
The specific steps performed during MMIW are as follows: First, the major regions of a mam-mogram are labeled (Fig 6a). Since mammo-grams are formed by means of projection, these region labels reflect the prominent tissue present at that location, not the absolute quantities of the multiple tissues that affected x-ray absorption at each point. Second, the regions are segmented and the image is automatically cropped to reduce the portion of background (Fig 6b). With the re-gions identified, the intensity histogram of each region can be calculated. The mean and standard deviation of the intensities in each region are used to parameterize a sigmoidal intensity wdow function. These functions map recorded in-tensity to displayed inin-tensity for each region (Fig 6c). Application of the dense region–specific in-tensity window function to the entire image pro-duces the final processed image (Fig 6d). Each MMIW-processed image shown in this article was processed using its own MMIW-defined, dense region–specific intensity window function.
This algorithm enhances the visibility of the lesion borders against the fatty background (Figs 1d, 2d, 2e, 4d). However, the mixed parenchy-mal densities that abut the lesion are lost in some cases. This effect is most dramatic at the edges of the mammogram (Fig 2d). Clearly, if this type of statistical sampling of the image is used to deter-mine an optimal intensity window, an additional algorithm that enhances the visibility of the pe-riphery of the breast should be used to rescue in-formation that is lost at the low-density subcuta-neous regions of the breast.
Both HIW and MMIW might be useful on a workstation. At the touch of a button, radiolo-gists could request a processed digital mammo-gram that allows them to see through the densest portions of the breast. However, neither
algo-rithm would probably be acceptable for display of screening mammograms because information in the peripheral and fatty areas of the breast is not visible when these algorithms are applied.
Contrast-limited
Adaptive Histogram Equalization
CLAHE is a special class of adaptive histogram equalization. Adaptive histogram equalization maximizes the contrast throughout an image by adaptively enhancing the contrast of each pixel relative to its local neighborhood. This process produces improved contrast for all levels of con-trast (small and large) in the original image. For adaptive histogram equalization to enhance local contrast, histograms are calculated for small re-gional areas of pixels, producing local histograms.
a. b. d.
These local histograms are then equalized or remapped from the often narrow range of inten-sity values indicative of a central pixel and its closest neighbors to the full range of intensity val-ues available in the display.
CLAHE limits the maximum contrast adjust-ment that can be made to any local histogram (Fig 7). This limitation is useful so that the re-sulting image does not become too noisy. The size of the neighbor region is controlled by means of the region size parameter. Smaller regions can better enhance the contrast of smaller spatial scale structures. The CLAHE parameter settings (clip 4, region size 32 pixels squared) used in the sample digital mammograms shown in this article were selected on the basis of previous experi-ments (4). After CLAHE was applied, MIW was used so that the contrast of the resulting image more closely approximated that of standard screen-film mammograms.
In digital mammograms processed with CLAHE, lesions appear obvious relative to the background and the image detail is very good (Figs 1e, 4e). However, there is obvious graini-ness in the images. This grainigraini-ness is due to the enhanced visibility of both image signal and im-age noise with this algorithm. Again, this algo-rithm might be helpful in allowing radiologists to see subtle edge information, such as spiculation. It might degrade performance in the screening setting by enhancing the visibility of nuisance in-formation that could simulate calcifications.
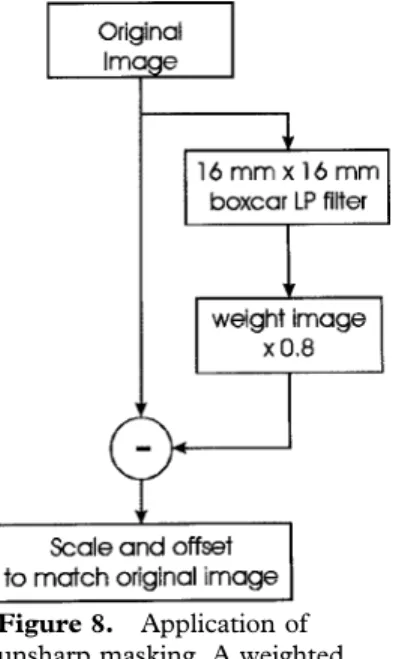
Unsharp Masking
With unsharp masking, a low-pass filtered ver-sion of the original image is created and the im-age values that result are subsequently multiplied by a weighting factor and subtracted from the original image (5). The final image preserves much of the detail of the original image, but large structures are presented with less contrast, thereby reducing the dynamic range required to display the image. In preliminary experiments, Figure 7. Clipping with CLAHE. Graphs show how CLAHE
redis-tributes the mapped intensities of the pixels in an image.
we tested a variety of low-pass filters using kernel sizes of 2–33 mm2. In addition, a variety of
weighting factors were tested. A boxcar filter with a window size of 16 mm2 and a weighting factor
of 0.8 was found to optimally compress dynamic range while preserving necessary structures in the breast and minimizing artifacts. A kernel size based on area was chosen so that comparison be-tween manufacturers was possible despite differ-ences in pixel size. The image data were then rescaled and an offset was added, as necessary, to approximately match the distribution of gray lev-els in the unprocessed and unsharp masked im-ages (Fig 8). MIW was then applied to the resul-tant image to adjust the contrast to levels more closely approximating those of standard screen-film mammograms.
With unsharp masking, the sharpness of the borders of mass lesions is enhanced, as is the in-tended effect of this algorithm (Figs 1f, 2f, 3c, 3d, 4f). The spiculations in the third case are es-pecially evident (Fig 3c, 3d). Of course, even an
indistinct mass can appear more circumscribed when this algorithm is applied (Fig 2f), obviously an undesirable outcome if this appearance were to lead to inappropriate patient follow-up instead of biopsy.
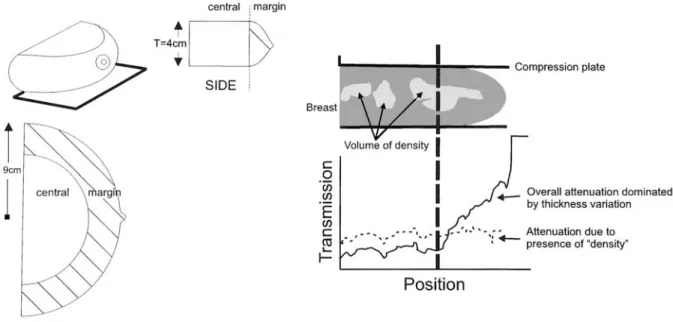
Peripheral Equalization
There are variations in the thickness of breast tis-sue under compression. The outer edges of the breast, which are thinner than the interior, are typically overpenetrated by x rays at image acqui-sition. Although a digital acquisition system should have adequate dynamic range to record this information precisely, the limited latitude of the laser film necessitates a compromise in image display. If the central parenchyma is presented with high contrast, then the peripheral tissue will appear very black on the film and may be difficult to distinguish visibly from the black film back-ground (Fig 9).
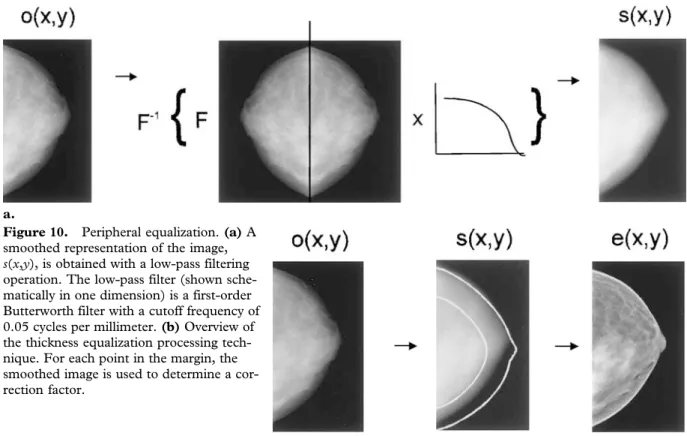
Peripheral equalization enhances visualization of tissue located near the periphery of the breast (6,7). In peripheral equalization, a low-pass spa-tial filter is applied to the image to create a blurred “mask” that represents primarily the coarsest variations in signal, which are related to variations in breast thickness. This mask is scaled from 0 to 1, and the mammogram is divided by means of the mask values on a pixel-by-pixel ba-sis (Figs 10a, 10b, 11). The algorithm is con-strained to act only on pixels that lie within the breast and where the breast thickness is chang-ing. There are also constraints placed on the total amount of enhancement to avoid disturbing arti-facts at the skin line. The result is that the digital values of pixels located near the periphery are changed so that the absolute intensities of the im-age become “flatter” across the mammogram.
The local contrasts between pixels located near each other, which represent compositional varia-tions in tissue, are not suppressed. In fact, be-cause the part of the dynamic range of the film required to represent thickness changes is no longer required, it is now possible to increase the overall contrast of the image if desired. For the images shown in this article, after peripheral equalization was applied, MIW was used to ad-just the resultant image contrast.
Details of both masses and calcifications are well depicted in images processed with peripheral equalization (Figs 1g, 4g). In addition, the pe-ripheral information in the surrounding breast is preserved (Fig 1g). This algorithm might be ef-fective in the screening setting because it pre-serves image features in all breast locations. However, there does appear to be some flattening of image contrast in the nonperipheral portions of mammograms when this algorithm is applied. a.
Trex Processing
Trex processing was developed by Trex Medical for use with the Trex Digital Mammography Sys-tem. This method uses a form of histogram-based unsharp masking.
The algorithm allows visualization of both le-sion detail and breast edge information (Fig 4h, 4i). However, there is some reduction of image contrast, which is evident when a Trex-processed version is compared with other processed ver-sions of the same image.
Conclusions
It is obvious from the images shown in this article that different digital image processing algorithms are likely to be useful for different tasks. Charac-terization of lesions and screening will most probably require a uniquely adapted image pro-cessing algorithm to provide the best presenta-tion for visualizapresenta-tion of different image features. In addition, different types of lesions, masses, and calcifications might benefit from specifically Figure 11. Profile of brightness as a function of posi-tion across a line of the original and corrected images. The vertical lines identify the margin. Note the reduc-tion in the range of levels in the corrected data as a re-sult of the adjustment in the margin.
proved diagnostic accuracy over that of conven-tional screen-film mammography. Development and assessment of image processing methods that allow detection and characterization of individual lesion types will be instrumental in the accep-tance of this new technology.
Acknowledgments: The unsharp masking algorithm was provided by A.D.A.M.; the peripheral equalization algorithm was provided by M.J.Y. and Gordon Mawdsley, PhD, University of Toronto, Ontario, Canada.
References
1. Shtern F. Digital mammography and related tech-nologies: a perspective from the National Cancer Institute. Radiology 1992; 183:629–630.
2. Feig SA, Yaffe MJ. Current status of digital mam-mography. Semin Ultrasound CT MR 1996; 17: 424–443.
3. Aylward SR, Hemminger BM, Pisano ED. Mixture modeling for digital mammogram display and analysis. In: Karssemeijer N, Thijssen M, Hendriks J, van Erning A, eds. Digital mammography Nijmegen, 1998. Dordrecht, the Netherlands: Kluwer Academic, 1998; 305–312.
4. Pisano ED, Zong S, Hemminger BM, et al. Con-trast limited adaptive histogram equalization image processing to improve the detection of simulated spiculations in dense mammograms. J Digit Imag-ing 1998; 11:193–200.
5. Chan HP, Vyborny CJ, MacMahon H, et al. Digital mammography ROC studies of the effects of pixel size and unsharp-mask filtering on the detection of subtle microcalcifications. Invest Radiol 1987; 22: 581–589.
6. Byng JW, Critten JP, Yaffe MJ. Thickness equaliza-tion processing for mammographic images. Radiol-ogy 1997; 203:564–568.