Bonnie S. Brzozowski. A Survey of Orange County Public Library Computer Users. A Master’s Paper for the M.S. in L.S. degree. July, 2007. 63 pages. Advisor: Evelyn Daniel
This study presents the results of a paper-based survey conducted at all four branches of
the Orange County Public Library System (OCPLS) in North Carolina. The goal of the
study was to gauge the adequacy in which OCPLS is bridging the digital divide, defined
as gaps in technological access among the American public, as well as offer OCPLS an
opportunity to gather feedback on existing policies and services. The collection of this
data could have provided OCPLS with justification for its continued funding; however,
the response rate was low and it is still unclear whether or not OCPLS is filling
technological gaps. Nonetheless, the value of this survey has been demonstrated
previously, and with slight alterations to the present study a higher response rate is likely.
Headings:
Microcomputers -- Patron use
Use studies -- Internet
Internet -- Public libraries
Digital divide
Information retrieval -- Social aspects
A SURVEY OF ORANGE COUNTY PUBLIC LIBRARY COMPUTER USERS
by
Bonnie S. Brzozowski
A Master’s paper submitted to the faculty of the School of Information and Library Science of the University of North Carolina at Chapel Hill
in partial fulfillment of the requirements for the degree of Master of Science in
Library Science.
Chapel Hill, North Carolina
July 2007
Approved by
_______________________________________
1
Table of Contents
List of Tables ... 2
Acknowledgements... 3
Introduction... 4
Literature Review... 6
Methodology ... 23
Results and Discussion ... 31
Conclusions... 47
References... 49
Appendix A: Paper-based survey of Orange County Public Library Users ... 52
Appendix B: Text of signage located near the public use computers at each OCPLS location... 57
Appendix C: Text of signage located at each OCPLS location circulation desk... 58
2
List of Tables
Table 1. Frequency of OCPLS Computer Use... 31
Table 2. Length of Time Respondents Waited for a Computer ... 32
Table 3. Respondent Experience When Using the Computer... 32
Table 4. Respondents Who Have Taken an OCPLS Computer Class... 33
Table 5. Respondents Who Have Requested Help with the Computers... 34
Table 6. Helpfulness of OCPLS Staff in Answering Respondents' Questions ... 34
Table 7. How Often Respondents Receive Items or Services They Want... 35
Table 8. Respondents' Rating of OCPLS Staff Customer Service ... 35
Table 9. Other Activities Performed by Respondents While at the Library... 36
Table 10. Computer Activities Performed by Respondents... 36
Table 11. Primary Reasons Respondents Use OCPLS Computers... 37
Table 12. Computer Skill Level of Respondents ... 38
3
Acknowledgements
I would first like to thank my advisor, Evelyn Daniel, for her excellent advising
and continuous encouragement throughout this process. Margot Malachowski, Branch
Manager at the Carrboro Cybrary, was instrumental in my selection of the topic for this
paper and I have considered and will consider her my mentor, friend, and colleague
before, during, and after the completion of this study. Thank you, Margot. I am also
extremely grateful to Susan G. Wexter who kindly allowed me to adapt my survey based
on the one she and her colleagues at Baltimore County Public Library created and
implemented. Not only did she allow it, but she was also enthusiastic and provided
valuable feedback. Finally, a huge thanks to the administration and staff members at the
Orange County Public Library System, particularly Brenda Stephens and Andrea Tullos,
for their cooperation and support in allowing me to utilize their resources and facilities to
4
Introduction
As an employee at the Carrboro Cybrary, a branch library within the Orange
County Public Library System (OCPLS), I observe the public use computer users and
have always noted the computer and Internet access gaps we fill. The Cybrary provides
access to a group that often does not have access elsewhere and greatly appreciates the
ability to ask and receive help from staff with basic computer and Internet questions (e.g.
how to fill out Internet forms, how to use the back button on a web browser, how to
interpret various Internet messages, etc.). However, no data exists on this population and,
while the power of observation is strong, it is also biased. I understood that the only way
to verify that the Cybrary and the rest of OCPLS were truly bridging technological access
gaps was to survey this population.
The purpose of the present study was to determine whether or not the Orange
County Public Library System (OCPLS) is adequately filling existing gaps in
technological access, often referred to as the digital divide. Clear-cut gaps in computer
and Internet access exist among the American public and most believe public libraries
should be filling these gaps (Public Agenda Foundation, Americans for Libraries
Council, & Gates Foundation, 2006). In order to determine the adequacy of OCPLS
computer and Internet services, a survey of OCPLS computer users was conducted. It
was expected that this survey would not only reveal the degree to which OCPLS is
bridging the digital divide, but also the degree to which computer users are satisfied with
5
users desire, and computer users’ satisfaction level with staff. Armed with this
knowledge OCPLS administrators and staff will be better able to evaluate existing
policies and services and create new ones, as well as justify OCPLS’s continued funding
6
Literature Review
Introduction
The digital age is upon us and the role of the public library in this new age is
constantly being questioned. It is not completely certain what the libraries of the future
will look like and some even anticipate the demise of libraries as we currently know
them. As stated in a report prepared by Public Agenda Foundation et al. (2006), “With
the advent of computers and search engines, digital libraries and the Internet, people ask
if libraries are essential and whether they should command priority in the competition for
public dollars” (p. 5). However, public libraries are certainly in a position to prove their
worth and place in the future by addressing the technological needs of the communities
that they serve and demonstrating to funding bodies the essential gaps in technological
access that they fill. In order to accomplish these aims, it is necessary that the roles the
American public expect national public libraries to play, current computer and Internet
adoption trends in national public libraries, gaps in technological access among the
American public, and public libraries’ budgetary and funding challenges be examined.
Public Expectations of Public Libraries
It has been reported (Public Agenda Foundation et al., 2006) that 64% of the
American public believe providing access to public computers should be a high priority
for public libraries (p. 48) and 45% believe providing wireless access at public libraries
7
Public Opinion (2003) also found that providing public use computers is ranked among
the top three expectations of their libraries.
Although the public names these as priorities for libraries, it is also apparent that
many are uncertain of the importance of libraries in the digital age. It has been reported
that in the wake of Internet access and in the face of major online booksellers and
increasing online information resources, a significant percentage believe that the public
library’s role will become less important (Public Agenda Foundation et al., 2006, p. 39).
It is obvious then that the public expects computer and Internet access via their
local public library, but it has been indicated that only 52% give their libraries a grade of
“A” or “B” for their provision of these services (Public Agenda Foundation et al., 2006,
p. 22). That leaves nearly half assigning libraries a bad grade for their provision of these
services. This is unfortunate as Bertot (2006) found that public Internet access has a
large impact on the provision of “education resources for K-12 students (63.6%), services
for job seekers (46.1%), computer and Internet training skills (38.0%), and access to and
assistance with local, state, and federal government electronic services (21.4%)” (p. 26).
If these provisions are inadequate, then the full impact of these excellent services may not
be completely realized. The below section explores the trends of computer and Internet
adoption among public libraries.
Technological Adoption Trends in Public Libraries
As of a 2006 report, 98.9% of public libraries were connected to the Internet and
98.4% of those libraries offered Internet access to the communities they serve (Bertot,
2006, p. 25). Once the margin of error is considered in the reporting of these two
8
and providing access to the Internet. The current percentage of connected public libraries
is particularly remarkable when it is considered that less than ten years ago only 20.9% of
public libraries were connected (Bertot, 2006, p. 10). A 2005 article in American
Libraries reported a similar dramatic shift in which it was discovered that in 1994 20.9%
of libraries were connected to the Internet, but in 2004 this percentage had jumped to
99.6% (Bertot, McClure, & Jaeger, 2005).
Although the overwhelming majority of public libraries are offering Internet
access, they are largely only offering it via public access computers for only 36.7% offer
wireless access. This low percentage has doubled, however, since 2004 when only
17.9% provided wireless. Because the present study focuses on a county library system
in North Carolina, it is of particular note that only 13.7% of North Carolina’s public
libraries provide wireless access (Bertot, 2006, p. 54); although, North Carolina has the
largest percentage of libraries that intend to adopt wireless within a year (Bertot, 2006, p.
48). It is possible that a full 61% of national public libraries may have wireless
provisions within the year if they follow up on current plans to incorporate this service
(Bertot, 2006, p. 25).
The majority of national public libraries have 12 or fewer public access computers
available for public use. The average number of computers in these libraries is 10.7, with
rural public libraries only having an average of 7.1. Only 20.7% of these libraries feel
that this number of computers is adequately filling patron demands; however, 45.4% of
libraries do not have any existing plans to purchase additional computers (Bertot, 2006, p.
2). Libraries in North Carolina constitute one of the highest state percentages with plans
9
inadequacy, these numbers reflect a dramatic increase since 1994 in the number of public
computers available at libraries (Bertot, 2006, p. 10).
The average age of public library computers is 2-3 years old with those libraries
providing computers less than a year old making up the lowest number of public access
computers (Bertot, 2006, p. 33). 72.8% of public libraries do plan to replace some of
their computers within the next two years (Bertot, 2006, p. 35). Costs and space
constraints are the most severe restrictions preventing the addition of new computers and
the upgrading of currently owned computers (Bertot, 2006, p. 36).
Public libraries in the state are open and providing computer access an average of
47.4 hours per week (Bertot, 2006, p. 52). In terms of how sufficiently the computers are
meeting patron demands in North Carolina during operating hours, Bertot’s (2006)
extremely comprehensive report indicates that 16.4% of NC public libraries said they
have fewer public computers than patrons who want to use them at any given time during
operating hours; 55.2% said that there are only certain times when there are not enough
public computers for patrons; and 28.4% said that they have enough computers for all
patrons at any given time (p. 77).
Yet another factor considered and reported on in Bertot’s (2006) report, is
connection speed in public libraries. While this was addressed, Bertot (2006) notes:
“It is time to move beyond connectivity type and speed questions and consider issues of
adequacy, quality, and the range of networked services that should be available to the
public from public libraries” (p. 12-13). He argues that considering the number of
computers a library can provide, the IT support the library receives, and a host of other
10
connectivity (p. 16). Nonetheless, it was determined that most libraries have a
connection speed of 769kbps (kilobytes per second) or greater (p. 15). Additionally, the
majority of national libraries claimed their connection speeds were adequate for their
patrons with 53.5% asserting it is adequate all of the time, 29.4% asserting it is sufficient,
and 16.1% asserting it is inadequate (p. 25).
Another important factor to address when considering computer and Internet
adoption in public libraries is staff training and the availability of computer and Internet
training to patrons. If staff and patrons alike are untrained and unskilled in use of
computers and the Internet, than the adoption of these technologies in libraries is only of
benefit to those with prior experience using them. Just as training exists for use of
various library services and tools, so should training exist for these new services and
competent staff is essential. However, a study conducted by Gordon, Moore, & Gordon
(2004) and cited in a Gates Foundation report (2004) found that slightly less than 40% of
public libraries do not offer technological training to staff members (p. 29). This number
becomes even more alarming when it is considered that almost two thirds of public use
computer users typically ask for help with the computers when they have a problem
(Gates Foundation, 2004, p. 21). However, 80% of patrons claim that the assistance with
computers received from librarians while in the library is satisfactory, seeming to indicate
that a lack of staff training may not be affecting these services in a dramatic way.
Alternatively, this could be indicative of patrons having low expectations of the type of
computer support they can expect from librarians.
The most current statistic on computer and Internet training availability to patrons
11
reported that they were unable to provide any technological training to patrons. This
percentage decreased by 10% since 2004 (p. 17). In North Carolina, only 16.3% of
public libraries offer no form of information technology training (Bertot, 2006, p. 95).
These statistics point to strengths and weaknesses in the adoption of computer and
Internet access into the range of already existing traditional public library services.
Clearly, wireless access adoption has occurred in a minority of public libraries, although
many do plan to adopt this service within the next year, and North Carolina’s wireless
adoption percentage is particularly low compared to the national percentage. Laptop
users whom may take advantage of this service are being underserved. Bringing these
users into libraries may make them aware of the many other services the library has to
offer them and further increase library support among the communities they serve.
Additionally, wireless access is a relatively recent technological trend indicating that
libraries may be lagging behind in the adoption of newer technological advances. As
noted in the preceding section, many people feel that the public library will become less
important in the wake of Internet access and in the face of further development and
expansion of online booksellers and other online information provisions. Libraries must
learn to compete against these newer forces in order to remain relevant to the public and
the slow adoption of newer technological trends is an indicator that libraries may be
incapable of prompt adoption and incorporation of services the public desires.
A second weakness is that only a small number of libraries feel that the computers
they do have fill patron needs in an adequate way. Further, almost half of the nation’s
public libraries do not have any plans to purchase additional computers with space and
12
issues (addressed in a proceeding section) make it likely that these restraints will remain
intact.
A final weakness is the lack of public library staff training in technology. Many
of the potential effects this can have on technological services in public libraries are
noted in a preceding paragraph; however, it is also important to emphasize that
technology is not stagnant. Constant training will be necessary to keep staff up-to-date
with new advances so that they may always be able to assist patrons.
On the other hand, the above statistics also indicate strengths in the relatively
recent change in technological services provided by public libraries. Virtually every
national public library has adopted the Internet and offers access to it. Additionally,
though wireless access is a concern, many libraries plan to provide this service within the
next year. Further still, the majority of libraries, though unable to add computers, do plan
to replace existing computers in the next two years and computers are available to the
public most of the time during operating hours. Finally, most libraries feel their
connection speeds are at least sufficiently meeting patron demand.
Gaps in Computer and Internet Access Among the Public
“Digital divide” is a term that
patterns of unequal access to information technology – particularly computers and the Internet – based on income, ethnicity, geography, age, and other factors. Over time it has evolved to more broadly define disparities in technology usage, resulting from a lack of access, skills, or interest in using technologies (Gates Foundation, 2004, p. 2).
The concern is that universal access to a significant information resource is not assured
for certain individuals and may further perpetuate significant existing societal divisions
or, perhaps, create new ones (Gates Foundation, 2004, p. 6). There are obvious benefits
13
benefits, health information, and a wide range of other services, information, and
opportunities that can be had via computer and Internet use. Additionally, skills with
computers and the Internet are often learned while using them. Even though a large
number (71%) of adults are currently using the Internet (Pew Internet and American Life
Project, 2007), there is still a significant number still do not. The number of Internet
users is constantly on the rise; however, a look at the population not using the Internet
reveals that this group, though smaller, has remained the same in ethnicity, educational,
age, income, and geographical characteristics as reported when the digital divide was
initially brought to national attention (Gates Foundation, 2004, p. 8).
Exploring divisions in computer and Internet access reveal that significant racial
differences exist. In particular, African Americans, Native Americans, and Latinos,
already known as “traditionally disadvantaged” groups, do not access (usually due to lack
of skills or anxieties associated with lack of skills) or may not have access to computers
and the Internet (Gates Foundation, 2004, p. 2). Latinos make up 14% of the adult
population in America and a little over half of this group, 56%, uses the Internet (Fox &
Livingston, p. i). In contrast, 73% of whites and 62% of African Americans go online
(Pew Internet & American Life Project, 2007). The factors that account for this disparity
between Latinos and other ethnicities are largely low education levels and limited facility
with the English language. Only 31% of Latino adults without a high school diploma use
the Internet and only 32% of Spanish speaking Latinos use the Internet. On the other
hand, 89% of Latinos who graduated from college and 70% of Latinos with a high school
diploma use the Internet, and 78% who speak English and 70% who are bilingual use the
14
As noted above, 62% of African Americans are online constituting the second
smallest ethnic group online behind Spanish speaking Latinos. Education level and age
seem to be the most significant factors in determining online use among this group. Only
25% of African Americans without a high school diploma use the Internet forming the
ethnic group with the smallest number of members whom do not possess a high school
diploma and are not online (Fox & Livingston, p. i). African American college
graduates, though, form the largest group online at 93%. The percentage of African
Americans aged 18-29 using the Internet is exactly the same as that of whites (77%);
however, African Americans aged 71 and older form the smallest of this age group online
at only 7% (Fox & Livingston, p. iv).
The statistics just reported regarding these two ethnic groups also reveals quite a
bit about whites. Whites constitute the largest ethnic group online (73%, reported above).
As with African Americans, education level and age appear to be factors determining
Internet usage. Ninety one percent of white college graduates use the Internet, whereas
only 32% without a high school diploma use the Internet. As reported above, 77% of
whites aged 18-29 use the Internet, while 27% aged 71 and older use the Internet (Fox &
Livingston, p. iv).
Other characteristics of those not using the Internet include age differences and
household income. Only 32% of Americans aged 65 and older use the Internet.
Additionally, those households where income is $30,000 and less per year only make up
55% of Internet users. As age decreases and income increases, so does the percentage of
15
According to the Gates Foundation (2004), seniors (those aged 55 and older) are
the fastest growing group of Internet adopters (p. 1-2). However, Fox (2006) notes that
“most of the growth in this group over the last few years has come from long-time
Internet users in their early sixties aging into senior status as the number of users aged 70
and older has not increased since 2005” (p. 1). Seniors using the Internet are typically
white, well educated, and have high incomes (Fox, 2004, p. i).
Persons living in rural areas tend to access computers and the Internet the least
when compared to people located in urban and suburban areas. Only 60% of persons
living in rural areas access the Internet compared to 73% in both suburban and urban
areas (Pew Internet & American Life Project, 2007).
In short, the above statistics reveal that most of those who do not use the Internet
are either Latino or African American, are not well educated, have lower incomes, are of
senior citizen age, and live in rural areas. Fox (2005) found that, overall, 22% of adults
in the United States do not use the Internet (p. i).
While it is useful to know who is typically considered digitally divided, it is of
even greater value to understand some of the barriers to computer and Internet access.
American adults who do not use the Internet do not do so because it is either their choice
or because of other factors that prevent access. A lack of interest and attitude that the
Internet has nothing to offer are the most typically given reasons for choosing not to use
the Internet. In terms of barriers, 46% of nonusers indicated that “the Internet is too
complicated and too hard to understand” and 48% reported that cost of access is a
problem. Others noted that they were embarrassed about their lack of skills and
16
computers and the Internet. This has led to the conclusion that there are certain
conditions that must be present for a person to decide to use the Internet: first, an adult
must be able to access computers and the Internet; second, an adult must feel they have
the appropriate skills and/or knowledge necessary to use computers and the Internet; and,
third, an adult must have the willingness and desire to learn how to use computers and the
Internet (Gates Foundation, 2004, p. 9).
A lack of access to adequate technological provisions in rural areas may be the
root of the problem of the lack of computer and Internet use by rural dwellers. It has been
reported that rural libraries have fewer public use computers, lower connection speeds,
and are less likely to provide wireless access (Bertot, 2006, p. 2). Considering close to
80% of public library systems serve rural locales (Gates Foundation, 2004, p. 5) and rural
areas typically have populations that are poorer and less educated (p. 23), it is apparent
that a significant number of libraries are responsible for a significant number of the
digitally divided that are being inadequately served.
So, then, whose responsibility is it to fill these technological access gaps? Public
Agenda Foundation et al. (2006) discusses community leaders’ expectations that libraries
should be bridging the digital divide as they are “skilled at reaching underserved
populations” (p. 38). Additionally, a National Telecommunications and Information
Administration report (cited in Gates Foundation, 2004) asserts that schools and libraries
should be active in bridging the digital divide. According to this report, public libraries
are in the position to solve this problem because of their openness and accessibility to
17
opportunities to their communities largely free of charge, and their position by law to
serve approximately 97% of the American population (p. 12).
As noted in a previous section, the public also believes it is the job of the public
library to provide computer and Internet access. But even further, it is clear that the
public, the digitally divided, and librarians alike also believe that the purpose of this
service is to bridge gaps in technological access. According to Public Agenda
Foundation et al. (2006), the majority of people feel that the government should support
computer and Internet access in public libraries “so that low income people can have
access to the Internet” (p. 11). In fact, the general public questioned in this report were
more likely to favor the provision of computer and Internet access in libraries than to
support “the individual purchase of computers for low income Americans” (p. 27).
Those without many computer skills and less education (i.e. the digitally divided) tend to
support the provisions of computer and Internet access even more strongly than those
with skills and higher incomes (Public Agenda Foundation et al., 2006). Finally, three
quarters of librarians in response to a qualitative question in Bertot’s (2006) survey
responded that “the most important social roles of the Internet access provided by public
libraries remain access for those who would not otherwise have it and help for those who
need assistance with the Internet” (p. 17-18).
Not only is it clear that most people feel strongly that libraries should be bridging
the digital divide, there is plenty of evidence that the digitally divided, as well as those
not digitally divided, are utilizing their public libraries for computer and Internet access.
Seventy three percent of American adults have regular access to the Internet, but 40% of
18
nonusers that live with a user (Fox, 2005, p. i). Because public libraries typically have
faster connections and free access, they are viable alternatives for those who fall within
this 40%. The places in which Internet users access the Internet include their homes,
workplaces, schools, friend’s or neighbor’s house, libraries, and relative’s houses. As of
2004, approximately four million people a day access the Internet from some place other
than home or work (Harwood, 2004, p. 1). Public Agenda Foundation et al. reports that
the majority of the American public access a computer from their home, workplace, or
school on any given day and one third of those surveyed said they had accessed the
Internet from a public library (2006, p. 28). Further, the report found that public libraries
served as both places of first and last resort for the public in accessing the Internet (p.
17-18). The Gates Foundation (2004) found that, of locations other than home, public
libraries come in fourth as the place where people access the Internet with work, school,
and another’s home coming before them (p. 15). Only 3% of Internet users only have
access to computers and the Internet in places other than their homes; however, these
users are typically living in low income households, living in rural areas, and are recent
adopters of the Internet (Harwood, 2004, p. 1).
People that rely on or frequently use public library computers are typically not
white, do not have a high school diploma, and are predominately aged 25-34. African
Americans comprise 18.7% and Hispanics comprise 13.8% of those who rely on public
library computers for access (Gates Foundation, 2004, p. 18). Persons without a high
school diploma are also far more likely to only have access to a computer and the Internet
from a public library (Gates Foundation, 2004, p. 20). Finally, those aged 25-34 are the
19
Seniors, an identified segment of the digitally divided, are the least likely to go online
from other places like libraries (Harwood, 2004, p. 3).
Budgetary and Funding Issues in Public Libraries
The preceding section indicates that there is evidence that libraries are providing
computer and Internet access to the digitally divided. Also, regardless of the extent to
which libraries serve the digitally divided, it is overwhelmingly clear that the general
public, community leaders, and librarians feel strongly that public libraries should be the
institutions to bridge technological gaps in access. However, budgetary and funding
challenges and crises are constantly faced by public library administrators and staff,
seriously jeopardizing the continued provision of technological services. Bertot (2006)
reports that almost 45% of public libraries had a decrease in budget or flat funding
funding since the last fiscal year. As he states, “Given inflation and increased personnel
and benefits costs, flat funding equates to a cut in funding” (p. 2). Considering the host
of traditional library services still offered and the somewhat recent addition and
expansion of expensive technological services, it is obvious that public libraries budgets
are strained to keep up with the technological demands and needs of the communities
they serve.
If libraries are only capable of providing a “bare minimum” of technological
services Bertot (2006) points out two detrimental effects this will have on libraries and
the digitally divided: first, it will turn public libraries into places of “last resort” for
technological access; and, second, perpetuate current gaps in technological access (p. 5).
Bertot (2006) also noted that the quality of technological access provided to the public
20
increasingly urgent need for libraries to remain relevant in this changing technological
time makes it essential that public libraries provide top of the line computer and Internet
services. This includes Internet and wireless access, an adequate number of computers,
computers in good working condition, fast connection speeds, and more. As the Gates
Foundation (2004) points out, there will always be a need for funding to provide support
for “hardware and software upgrades, Internet connectivity, keeping systems running,
and staff training” (p. 5).
As technology advances, new equipment, staff expertise, and patron training will
also need to be expanded. Particularly in the wake of the expansion of Web 2.0
applications, content uploading and user creation of content will continue to become
more and more important to Internet users. Content uploading requires certain equipment
such as scanners and digital cameras, as well as staff familiarity with this equipment and
the applications that can be used in conjunction with them. Users can create content with
wikis and blogs among other things. Patrons themselves may have a demand to learn
how to use these applications and public libraries would be at a significant advantage to
one day be able to offer these kinds of services and assistance with these services.
Alternative funding sources other than the local governments that typically support
public libraries are extremely limited. The E-rate program is a program that has been
helping schools and libraries with telecommunications costs such as connectivity to the
Internet (Universal Service Administrative Company, 2006). This program is noble in its
cause, but the complicated application process and limited discount available to some
libraries are often cited as reasons public libraries do not apply for this funding (Bertot,
21
discounts” (Bertot, 2006, p. 42). This high number suggests that few libraries receive any
benefit from this program.
Certainly a way to ensure that public libraries continue to receive funding, and
perhaps even more funding than they have received in the past, is to make sure
communities fully support them and vocalize that support. Public Agenda Foundation et
al. (2006) found that “community soldiers” are likely to rate public libraries high in their
performance and typically consist of volunteer workers, civic organization members, and
donors to charities whom vote and are older than 40 (p. 29). These so-called soldiers
would be excellent voices for the nation’s public libraries. Public Agenda Foundation et
al. (2006) also discovered that “…1 in 3 people under 30 say a library’s closure would
affect only a few people in the community...But they are also the most likely group to
have used the Internet at the library” (p. 30). It is alarming that these individuals do not
feel a library’s closure is particularly meaningful. Attempts to reach out to this group and
help them realize the full benefits public libraries can and do provide to their
communities are necessary.
Rationale of the Present Study
One way in which public libraries can justify their continued funding and elicit
further community support is to become knowledgeable about the gaps in computer and
Internet access they fill. Wexter (2006) and her colleagues conducted a web-based
survey of computer users in the Baltimore County Public Library System (BCPL) to not
only evaluate the current services being offered and find out about other services their
community members might like to see offered in the future, but also to find out if the
22
library administrators and staff consider and revise current policies and services as well
as create and consider the creation of new ones. Additionally, Wexter (2006) found that
BCPL was providing access to those who genuinely need it.
Wexter’s (2006) study is an important one that provides a model for the present
study. An adaptation of the survey she used was used in this study. Conducting studies
like Wexter’s (2006) will provide public libraries with a dataset that can prove to library
funders the worth of the public library and justify its continued funding. Additionally,
this study can be run extremely inexpensively and with little extra work for
administrators and staff. This is only one small step in arguing the case for public
23
Methodology
Introduction
A paper-based survey was placed at each OCPLS location and was filled out by
patrons whom had just finished using a public use computer and were 18 years of age or
older. The survey (see Appendix A) inquired about the participant’s actions while in the
library, reasons for using the library’s computers, frequency of use of the computers, wait
time for use of a computer, satisfaction with and usage of the computer and general
services, desired services that are not currently offered at the OCPLS locations,
satisfaction with library staff, knowledge of computers, access to computers outside of
the OCPLS locations, and demographics including education level, age, gender, and
ethnicity. The responses to the survey were recorded and analyzed to create profiles of
computer user groups.
Orange County Public Library System
The Orange County Public Library System (OCPLS) is comprised of one main
library and three branches: Carrboro Branch Library and Carrboro Cybrary Branch
located in Carrboro, North Carolina, and Cedar Grove Branch Library and Orange
County Public Library (main library) located in Hillsborough, North Carolina. These
libraries serve the population of Orange County, North Carolina, which, as of 2006, had a
24
only has locations in Carrboro (population 16,425) and Hillsborough (population 5,382)
though the towns of Cedar Grove (population 1,970), Chapel Hill (population
49,543) and Efland (population 3,206) are also located within the county (U.S. Census
Bureau, 2005a, 2005c, 2000a, 2005b, 2000c, respectively). Chapel Hill Public
Library, a municipal library with a small allocation of funds contributed by the county,
serves Chapel Hill, and Cedar Grove Branch Library is intended to serve both Cedar
Grove and Efland as it is located in closest proximity to these towns.
Public use computers are available at all OCPLS libraries: Carrboro Branch
Library has four; Carrboro Cybrary Branch has five; Cedar Grove Branch Library has
four; and Orange County Public Library has ten, including one that is located in the North
Carolina Room and is intended for genealogical research. All of these computers have at
least the Microsoft Office Suite, Internet Explorer, and Adobe Reader downloaded on
them, with a few of them having more specialized programs such as Adobe Photoshop.
Connection speeds at the OCPLS libraries are 512kbps at Carrboro Branch Library and
Orange County Public Library, and 384kbps at Carrboro Cybrary and Cedar Grove
Branch Library (R. Griffin, personal communication, June 25, 2007).
OCPLS is a unique and small system whose manager recommended budget for
2007-2008 is $1,326,692. This manager recommended budget is divided so that
Carrboro Branch Library receives $138,173, Carrboro Cybrary Branch receives $81,639,
Cedar Grove Branch Library receives $106,072, and Orange County Public Library
receives $750,775 (Orange County Budget Office, 2007). Orange County Public Library
receives E-rate funding for its telephone line, but does not receive discounts or funding
25
its Internet connection because this connection is funded by the county IT department, a
distinct entity not part of the library system. The other branches have not applied for
E-rate largely because the discount amount would not justify the lengthy application
process, or they have arrangements with other organizations that either provide them with
or share the cost of telephone and Internet service (R. Griffin, personal communication,
June 28, 2007). The budget figures indicate the financial constraints under which
OCPLS operates and the inherent difficulties such constraints place on the provision of
optimal computer services. However, the OCPLS budget has increased steadily since the
2003-2004 fiscal year (Orange County Budget Office, 2006).
OCPLS has dealt with these constraints and difficulties in a remarkable way,
which is illuminated best by examining the spaces and service provisions of each of the
branches. The Carrboro Branch Library (CBL) is located in McDougle Elementary and
Middle Schools. The schools along with this branch all share one space, with CBL only
open on weekday late afternoons and evenings and on weekends so that the schools may
operate the library during school hours. In comparison to the other two branches, CBL is
a much larger facility with a larger circulating collection and less emphasis on computer
and Internet access. CBL does not have wireless access.
The Carrboro Cybrary Branch is located in the heart of downtown Carrboro in the
Century Center, which also houses the Carrboro Parks and Recreation Department and
the Carrboro Police Department. The Cybrary is largely open when CBL is not,
operating in the weekday daytime hours and on Saturdays, to supplement the hours CBL
cannot be open. The Cybrary houses a very small collection of adult materials and the
26
Cedar Grove Branch Library (CGBL) is a small room located in the Northern
Human Services Building. CGBL’s operations and service provisions are similar to that
of the Cybrary’s in that the emphasis is also on computer, Internet, and wireless access
for residents located in the north of the county. However, CGBL’s small collection also
includes children’s materials.
Orange County Public Library (OCPL) is the main county library with the largest
circulating collection of the four libraries. It occupies its own space, though some county
offices occupy the bottom floor, and within the next few years it will be relocating to an
even larger space. OCPLS operates the most extensive hours per week. They offer
computer, Internet, and wireless access.
Participants
Participants were largely Orange County residents possessing OCPLS library
cards. However, OCPLS offers computer use only library cards as well as full use library
cards. In order to obtain a full use library card, library patrons must show proof of
Orange County residence as well as a photo ID. A computer use only card does not
require Orange County residence. Therefore, it is anticipated that some participants may
reside outside of the county. Participants were all volunteers of age 18 years or older
whom opted to complete the survey after utilizing one of the public use computers in one
of the OCPLS libraries. The study was limited to those age 18 years or older due to the
difficulties associated with gaining sufficient consent of minors for the satisfaction of the
Institutional Review Board (IRB).
27
A paper-based survey (Appendix A) adapted from Wexter’s (2006) web-based
survey was utilized for this study. The survey was distributed on paper as per the
requests of the OCPLS administration. One of the difficulties with a web-based survey at
OCPLS is caused by the time limit placed by PC Reservation on a patron’s computer
session. Patrons are limited to 30-minute computer sessions when there is a wait for the
computers. The original proposal for this study was to use a web-based survey with
computer users being prompted to take the survey via a dialog box. However, because
the survey could take as long as 15 minutes to complete, the administration believed there
was risk of a low response rate, as the survey could take potential respondents up to half
the time of their session to complete. A paper-based survey was used instead to combat
this risk.
Some of the fixed responses were reworded either for clarity or to coincide with
OCPLS service offerings. For example, in question 12 of Wexter’s survey (2006, p. 38)
the question and fixed responses were altered (question 8, Appendix A). Wexter’s
question 12 reads, “What is your knowledge level for using a computer?”, and the fixed
responses range from “very low” to “very high”. Question eight in the present survey
reads, “How skilled are you at using a computer?”, and the fixed responses range from
“very unskilled” to “very skilled”. It is the opinion of the researcher that the question and
fixed responses used in this adaptation are clearer. An additional example is the
exclusion of “Check out E-books” (Wexter, 2006, p. 38) in question 1 (question 3 in
Appendix A). The ability to check out e-books is a recent service addition to OCPLS’s
offerings and it is not anticipated that this will be a frequent reason participants use the
28
reasonably be made to produce a shorter survey was acted upon to ensure brevity and
increase response rates.
Additionally, two questions used in Wexter’s (2006) study were excluded:
questions six and seven (p. 38). Every computer user at OCPLS must enter in a library
card number to use the computers and, therefore, it was unnecessary to ask question six.
Question seven was subsequently thrown out as it is a follow-up to question six. Further
still, it is not of interest whether participants reside inside or outside of the county as the
study’s purpose is to gauge OCPLS’s service provisions regardless of who it is that takes
advantage of these provisions.
Finally, questions regarding ethnicity and gender were also included in this
adaptation so a more thorough analysis of the extent to which OCPLS is bridging the
digital divide could be gauged, as ethnic and sex differences are frequently described
when discussing the digital divide. The ethnic categories chosen were those used by the
U.S. Census Bureau (2000c).
Procedure
Signage (see Appendix B) was placed near the public use computers at each
OCPLS location indicating the presence of the survey, the estimated time it would take to
complete the survey, and the eligibility requirements. A sign (see Appendix C) was also
placed at the circulation desk above a folder where the blank surveys and fact sheets
about the study (see Appendix D) could be found. This sign was similar to the one in
Appendix B, but it additionally noted that participants should read and keep the fact sheet
29
A folder was placed behind the circulation desk at each OCPLS location in which
completed surveys were to be collected. Participants returned the completed surveys to
OCPLS staff members at the circulation desk and staff members were instructed to place
the surveys in the folder behind the desk. It was requested that the staff members not
read the surveys and promptly place them in the folder. The fact sheet requested that the
participants fill out the survey while in the library after they had used one of the public
use computers. Answers to the survey were completely anonymous and no identifying
information was collected on the survey. Participation in the survey was entirely
voluntary.
The investigator continuously picked up completed surveys from OCPLS
locations during the seven-day period in which it was available in order to begin data
entry. The seven-day period included weekdays and weekends.
The generalizability of this study will be highly dependent on the number of
responses received. In order to truly know how well OCPLS is filling technological gaps,
a broad sample of computer users will be required from each library. Wexter’s (2006)
survey elicited a high response rate, and, therefore, BCPL was
Analysis
The fixed and open-ended responses to the survey were recorded in an Excel
spreadsheet. The goal was to analyze data to create profiles of participants based on
computer access outside of the OCPLS locations, age, education level, ethnicity, and
gender. Satisfaction levels with services and staff, adequacy of service provisions, and
overall self-reported comfort level with computers were also to be assessed by OCPLS
30
were submitted to the OCPLS location they pertained to in order for OCPLS
administration and staff to review and modify existing and create new policies and
31
Results and Discussion
A total of 21 responses (11 from Carrboro Cybrary; 5 from Cedar Grove Branch
Library; 3 from Carrboro Branch Library; and 2 from Orange County Public Library)
were received. Because the response rate was low, it was not worthwhile to profile the
branches individually as was an original goal of the study. Rather, the data was taken as
a whole and analyzed as such.
Staff and Services Satisfaction
The questions used in this survey asked about patron satisfaction levels with
OCPLS staff and services as well as about access levels and demographic information.
The findings regarding staff and services will be presented first.
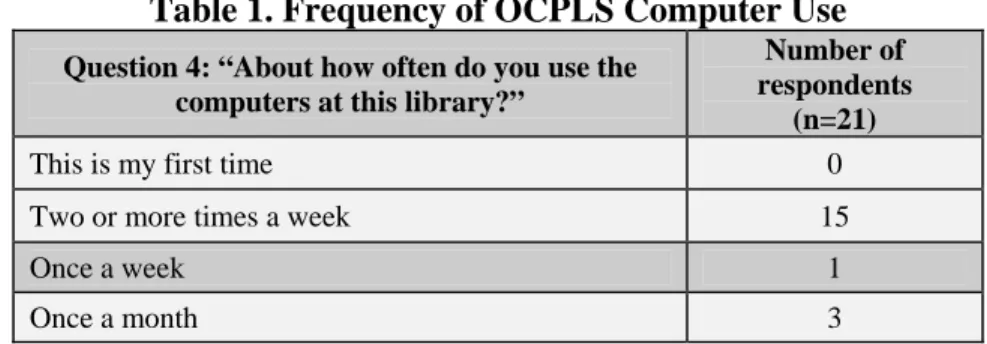
In response to question four (see Table 1), most respondents reported that they use
the OCPLS computers more than twice a week, with the majority of other respondents
using them once a month or less. This indicates that the majority of the respondents are
frequent users of the OCPLS libraries.
Table 1. Frequency of OCPLS Computer Use
Question 4: “About how often do you use the computers at this library?”
Number of respondents
(n=21)
This is my first time 0
Two or more times a week 15
Once a week 1
32
Less frequently than one time a month 2
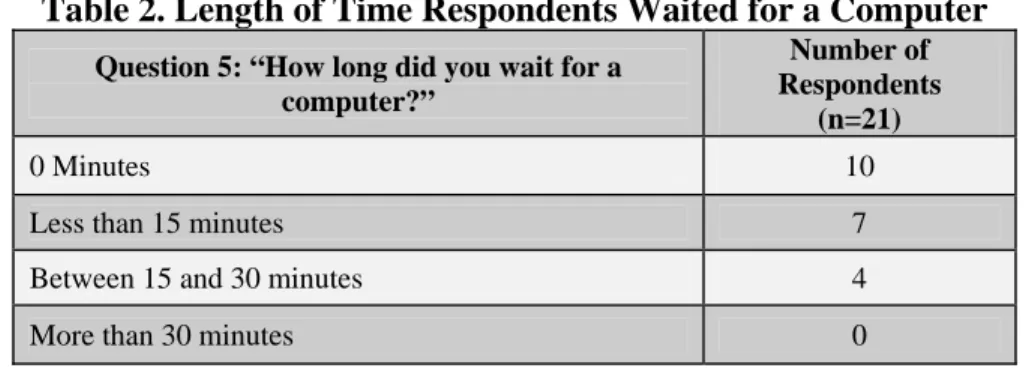
Many of the respondents did not wait for a computer, and, for those who did wait,
most did not wait longer than 15 minutes. This is indicative of a satisfactory number of
public use computers at the OCPLS libraries, though three of the four libraries provide
access to fewer computers than is the average for national rural public libraries (7.1;
Bertot, 2006, p. 2).
Table 2. Length of Time Respondents Waited for a Computer
Question 5: “How long did you wait for a computer?”
Number of Respondents
(n=21)
0 Minutes 10
Less than 15 minutes 7
Between 15 and 30 minutes 4
More than 30 minutes 0
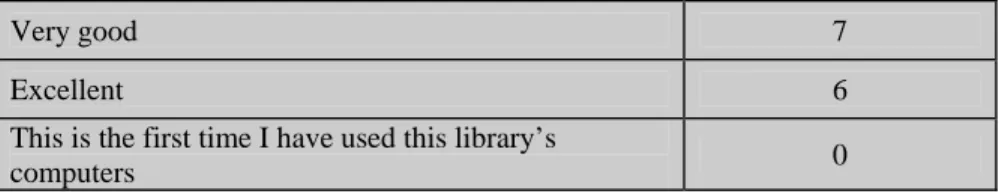
All of the respondents indicated that their experience with the libraries’ computers
was at least “good.” The responses available ranged from “poor” to “excellent.” This
indicates that the respondents are pleased with the computers and computer programs
offered by OCPLS; however, it is also notable that five respondents only deemed the
services fair. The fact that no respondent indicated that he or she was a new computer
user also speaks well for the data that did get collected in this survey, despite the low
response rate.
Table 3. Respondent Experience When Using the Computer
Question 6: “How is your experience when you use this library’s computers?”
Number of Respondents
(n=21)
Poor 0
Fair 5
33
Very good 7
Excellent 6
This is the first time I have used this library’s
computers 0
Only two respondents reported that they had taken computer classes offered at
Carrboro Branch Library or Carrboro Cybrary. This could suggest that respondents are
unaware of the classes, the classes are too basic for them, the class times are
inconvenient, or respondents are uninterested in taking computer classes. The classes
offered at these two OCPLS locations are offered in conjunction with the Community
Workshop Series, a program sponsored by the University of North Carolina at Chapel
Hill Libraries. The Community Workshop Series provides introductory computer and
Internet classes, such as Introduction to Computers, Introduction to Microsoft Word, and
Web Basics (an introduction to the Internet). The nature of these classes and the
revelation that few respondents have attended them may indicate that the respondents are
not part of the population typically referred to as the digitally divided, as they perceive
themselves as skilled enough not to take them. It could also be the case that the
frequency in which they use the OCPLS computers has given them an adequate skill set
that would not be complemented by extremely basic computer classes.
Table 4. Respondents Who Have Taken an OCPLS Computer Class
Question 9: “Have you ever attended a computer class at the Carrboro Branch Library or Carrboro Cybrary?”
Number of respondents
(n=21)
Yes 2
No 19
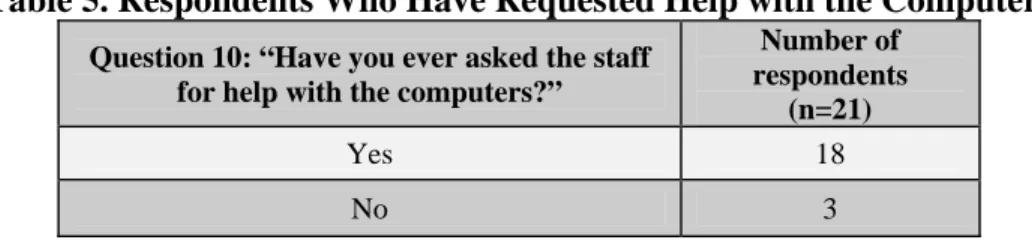
As expected, 18 of the respondents have asked a librarian for assistance with the
34
library computer users ask librarians for assistance with the computers (Gates
Foundation, 2004, p. 21). It is a good reflection on the part of OCPLS staff members that
the respondents feel comfortable requesting assistance from them.
Table 5. Respondents Who Have Requested Help with the Computers
Question 10: “Have you ever asked the staff for help with the computers?”
Number of respondents
(n=21)
Yes 18
No 3
Another good reflection of OCPLS staff is that none of the respondents who
requested help with the computers were displeased with the help they received. All
respondents reported that the librarian from whom they requested assistance was
“helpful” or “very helpful.” This is consistent with the statistic cited above that 80% of
public library computer users who requested help with a computer were satisfied with the
help they received (Gates Foundation, 2004, p. 21); however, as pointed out earlier, this
could reflect low expectations of the capacity of librarians to answer computer questions.
Table 6. Helpfulness of OCPLS Staff in Answering Respondents' Questions
Question 11: “If you answered ‘Yes’ to the above question, how helpful were the library staff in
answering your questions?”
Number of respondents
(n=18)
Not helpful 0
Somewhat helpful 3
Helpful 2
Very helpful 13
The majority of respondents reported that they “always” or “usually” get the items
or services they want when they come to the library. Again, this reflects well on the
services and materials OCPLS provides in that respondents get what they want, or at least
35
Table 7. How Often Respondents Receive Items or Services They Want
Question 12: “When you come to the library, how often do you get the items or services you want?”
Number of respondents
(n=18)
Never 0
Rarely 0
Sometimes 2
Usually 6
Always 10
The majority of respondents gave the customer service they receive from staff
while in the library a rating of “good,” “very good,” or “excellent.” Clearly, respondents
are pleased with OCPLS staff members.
Table 8. Respondents' Rating of OCPLS Staff Customer Service
Question 13: “When you come to the library, how is the customer service you receive?”
Number of respondents
(n=21)
Poor 0
Fair 2
Good 3
Very good 8
Excellent 8
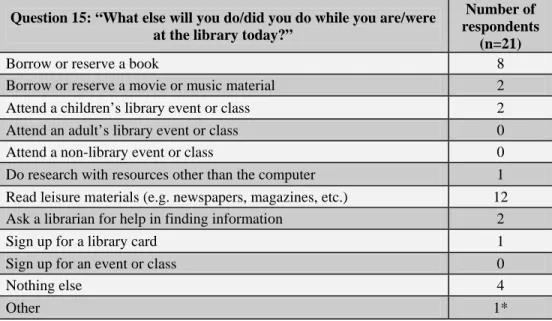
The majority of respondents reported that they planned to either read leisure
materials (e.g. newspapers, magazines, etc.) or borrow or reserve a book while at one of
the libraries. Some respondents intended to do nothing else while in the library or
planned to ask a librarian for help in finding information. An even smaller set of
respondents said they would borrow or reserve a movie or music material or attend a
children’s event or class.
It is interesting that OCPLS libraries have computer users that take advantage of
other, more traditional library services. This may suggest that computer users are being
36
users are taking advantage of the computers while already in the library for other
purposes. Overall, it surely indicates that OCPLS libraries are providing a wide range of
services that computer users take advantage of as only four responded that they intended
to do nothing else while at the library.
Table 9. Other Activities Performed by Respondents While at the Library
Question 15: “What else will you do/did you do while you are/were at the library today?”
Number of respondents
(n=21)
Borrow or reserve a book 8
Borrow or reserve a movie or music material 2
Attend a children’s library event or class 2
Attend an adult’s library event or class 0
Attend a non-library event or class 0
Do research with resources other than the computer 1 Read leisure materials (e.g. newspapers, magazines, etc.) 12 Ask a librarian for help in finding information 2
Sign up for a library card 1
Sign up for an event or class 0
Nothing else 4
Other 1*
* “Use phone and restrooms” was specified as “other” at Carrboro Cybrary
Bridging the Digital Divide
The table below indicates the computer activities respondents perform most
frequently while at the libraries. As anticipated, many use the Internet to read or write
email. This is consistent with Fox and Madden’s (2005) findings that nearly 90% of
Internet users receive or send email (p. 1). Another popular activity for respondents was
browsing the Internet; all other computer activities were infrequently reported.
Table 10. Computer Activities Performed by Respondents
Question 2: “For what purpose(s) did you use the library’s computer today?”
Number of Respondents
(n=21)
Browse the Internet 15
Read or write email 14
37
Look for or apply for a job 3
Learn more about personal interests 3
Get information for my job 3
Read the latest news, sports, etc. 3
Search the library online catalog 3
Search for or purchase goods or services 2
Search an online database 2
Reserve items in the library online catalog 2
Do homework assignments 2
Participate in online chat 1
Use word processing (e.g. Microsoft Word) or spreadsheet (e.g.
Microsoft Excel) 1
Other 1*
* Other was not specified
The question regarding the primary reason OCPLS patrons use the public use
computers proved problematic. It was requested that participants select only one
response; however, four respondents selected more than one response to this question.
The low response rate prompted the inclusion of these responses, regardless of the
selection of more than one response.
The majority of respondents reported that they access the public computers at
OCPLS because these are the only places they have access to a computer. This would
seem to indicate that OCPLS is filling a significant gap in access for several of the
respondents, but the responses to question 20, in which respondents were asked to
indicate whether they have access to a computer, showed an inconsistency in responses
and will be discussed later in this section. Two other reasons for use—better speed and
quality of OCPLS computers compared to others they could use and convenience of
OCPLS location—were less frequently selected responses.
Table 11. Primary Reasons Respondents Use OCPLS Computers
Question 3: “What is the primary reason you use the library’s computer?”
Number of respondents
(n=21)
This is the only place I have access 9
38
computers I could use
It is the most convenient location 5
Access is free 3
Other 4*
I am already at the library for other reasons 1 * “Other” specified as:
1) “I do like the relitive [sic] smallness of the envierment [sic] and the staff are always curtious [sic] and helpful”
2) “I have a wonderful setup at home – I have no I’net [sic] access where in area where I live [sic]”
3) “To search their [the library’s] catalog”
4) “The closest place that I have access the the [sic] Internet when I’m down hear [sic]” were specified as other
Only one of the respondents indicated that he or she is not skilled with computers.
All other respondents said they were moderately to very skilled with computers. This
response may be expected as it was noted in the literature review that many who perceive
themselves as unskilled or unable to become skilled do not use the computers. However,
many who are unskilled with computers are digitally divided and it should be the interest
of OCPLS to appeal to these individuals.
This does not necessarily indicate that respondents are not digitally divided.
Many reported that they use OCPLS computers frequently; therefore, perhaps these
respondents have increased their skills with regular use of OCPLS computers. Another
problem with the assumption that these respondents are not members of the digitally
divided is that this a self-report of computer skills: five respondents reported they have
access to a computer at no other place (see Table 13), but only one of these five also
reported that he or she is an unskilled user. Considering this lack of access, it may
actually be that these respondents, at least, are less skilled than they believe themselves to
be.
Table 12. Computer Skill Level of Respondents
39
a computer?” Respondents (n=21)
Very unskilled 1
Unskilled 0
Moderately skilled 6
Skilled 11
Very skilled 3
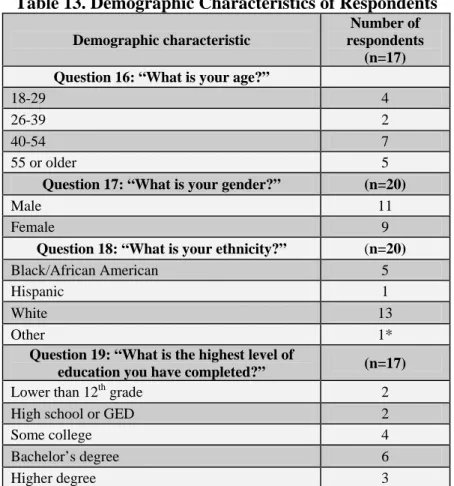
The demographic information collected by the survey revealed that the majority
of respondents were between 40-54 years of age, male, white, and held bachelor’s
degrees. The majority of other respondents were either aged 18-29 or 55 and older,
female, African American, and either had a higher degree or had attended some college.
Therefore, the majority of respondents do appear to be in a different group than those
typically defined as digitally divided.
Despite this, it is notable that a fair number of African Americans and persons
aged 55 and older access OCPLS computers. African Americans are included in the
digitally divided group so it is possible that OCPLS computer services may be bridging
some of the technological gaps for this ethnic group in their communities. Also, some of
the respondents were aged 55 and older, an age group that is also digitally divided, so it is
possible OCPLS is filling their access needs as well.
Only one respondent identified him- or herself as Hispanic and one other
identified him- or herself as “Hispanic/White,” despite the findings of the North Carolina
Institute of Medicine that North Carolina has been identified as having the fastest
growing Hispanic/Latino population in the nation (North Carolina Institute of Medicine,
2003, p. 7). As described earlier, Latinos are a significant part of the population of the
40
Hillsborough would have fewer Latino respondents as Latinos comprised only 2.8% of
the town’s population as of 2000 (U.S. Census Bureau, 2005c); however, it was
essentially an even split with the one respondent reporting “Hispanic/White” as his or her
ethnicity having completed the survey at Cedar Grove Branch Library, and the other
self-identified Hispanic having completed the survey at the Cybrary. Carrboro had a 12.3%
Latino population as of 2000 (2005a), so it is particularly disappointing that so few
Latinos completed a survey at CBL and the Cybrary.
Table 13. Demographic Characteristics of Respondents
Demographic characteristic
Number of respondents
(n=17) Question 16: “What is your age?”
18-29 4
26-39 2
40-54 7
55 or older 5
Question 17: “What is your gender?” (n=20)
Male 11
Female 9
Question 18: “What is your ethnicity?” (n=20)
Black/African American 5
Hispanic 1
White 13
Other 1*
Question 19: “What is the highest level of
education you have completed?” (n=17)
Lower than 12th grade 2
High school or GED 2
Some college 4
Bachelor’s degree 6
Higher degree 3
* “Hispanic/White” specified as “other”
Four of the respondents who answered that they only had access to a computer at
the library then went on to answer that they did, in fact, have access elsewhere in another
41
respondents reported they had access from school, work, or a friend or relative’s house.
It seems that the first fixed response to question three should be reworded to read “This is
one of the places I have access to a computer,” as this seems to be how these respondents
interpreted it.
Many of the respondents reported that they have home access to a computer. A
significant number answered that they have access at a friend or relative’s house, and still
others answered they have access nowhere else or at school. The fewest number either
answered other or work. Those who responded other listed:
1) “Other libraries”
2) “Chapel Hill Public Library”
3) “UNC Davis Library, Undergrade [sic] (science library), Chapel Hill Public Library”.
It is interesting that those responding “other” listed other libraries as their points of
computer access. This suggests that these respondents are heavy library users and rely on
area libraries to provide them with computer access.
Those respondents who have home access are clearly not part of the digitally
divided; however, this question did not ask about Internet access at home and it is
possible that some may only have this access in places like the library. It does seem that
OCPLS libraries may be filling some technological gaps as a few did indicate they have
computer access nowhere else. Further, the four who were inconsistent in their answer to
questions three and twenty only have access from school, work, or a friend or relative’s
house, suggesting that they rely on OCPLS libraries for another point of access.
Table 14. Other Places Respondents Have Access to a Computer Question 20: “Where do you have access
to a computer besides the library?” Number of respondents (n=21)
Home 10
Work 3
42
School 5
Other 3*
Nowhere else 5
* “Other libraries”, “Chapel Hill Public Library”, and “UNC Davis Library, Undergrade [sic] (science library), Chapel Hill Public Library” specified as other
Open-ended Question Responses Regarding Services
Respondents were given the opportunity in question seven (see Appendix A) to
indicate other services and programs they would like the library’s computers to have.
Responses included:
1) “Email from programs (such as job site) – Outlook”
2) “True access to townofcarrboro.org....[and] better headsets (currently of low quality)”
3) “Games”.
The Outlook and townofcarrboro.org (comments one and two above) requests are perhaps
a little difficult to make sense of, as it is impossible to see the way in which these patrons
were trying to utilize this program and site to determine if access to these is a real issue.
Newer headsets (comment two above), however, could definitely be purchased by
OCPLS, and, though the patron that made this request was using a computer at CGBL, I
know that the headsets at the Cybrary are also in poor condition.
Games (comment three above) are available via the Internet on the OCPLS
computers so it is difficult to understand this request. The problem for this respondent
may be that games are not installed on the computer hard drives, or, perhaps, he or she
may not understand how to access them.
Other responses to this question included:
1) “There are often problems and the librarians always say, ‘We know we’ve asked the technical people to correct it’ for ex [sic], slow computer”