Contents lists available atScienceDirect
European Journal of Pharmaceutical Sciences
journal homepage:www.elsevier.com/locate/ejps
The in
fl
uence of drug distribution and drug-target binding on target
occupancy: The rate-limiting step approximation
W.E.A. de Witte
a, G. Vauquelin
b, P.H. van der Graaf
a,c, E.C.M. de Lange
a,⁎ aDivision of Pharmacology, Leiden Academic Centre for Drug Research, Leiden University, 2333 CC Leiden, The Netherlands bDepartment of Molecular and Biochemical Pharmacology, Vrije Universiteit Brussel, Brussels, BelgiumcCertara Quantitative Systems Pharmacology, Canterbury Innovation Centre, Canterbury CT2 7FG, United Kingdom
A R T I C L E I N F O
Keywords:
Binding kinetics Rebinding Distribution Pharmacokinetics Rate-limiting step Diffusion
A B S T R A C T
The influence of drug-target binding kinetics on target occupancy can be influenced by drug distribution and diffusion around the target, often referred to as“rebinding”or“diffusion-limited binding”. This gives rise to a decreased decline of the drug-target complex concentration as a result of a locally higher drug concentration that arises around the target, which leads to prolonged target exposure to the drug. This phenomenon has been approximated by the steady-state approximation, assuming a steady-state concentration around the target. Recently, arate-limiting step approximationof drug distribution and drug-target binding has been published. However, a comparison between both approaches has not been made so far.
In this study, therate-limiting step approximationhas been rewritten into the same mathematical format as the steady-state approximationin order to compare the performance of both approaches for the investigation of the influence of drug-target binding kinetics on target occupancy.
While both approximations clearly indicated the importance of konand high target concentrations, it was
shown that therate-limiting step approximationis more accurate than thesteady-state approximation, especially when dissociation is fast compared to association and distribution out of the binding compartment.
It is therefore concluded that the newrate-limiting step approximationis to be preferred for assessing the influence of binding kinetics on local target site concentrations and target occupancy.
1. Introduction
Although drug-target binding kinetics (the association and dissocia-tion rate constants) is an important determinant of the kinetics of drug action (Copeland et al., 2006; Yassen et al., 2007; Johnson et al., 2011; Dahl and Akerud, 2013), its role can be influenced by rebinding or diffusion-limited binding (Vauquelin and Charlton, 2010; de Witte et al., 2016; Vauquelin, 2016). The term rebinding has been introduced to describe the result of a (micro-)environment around the target site which is not in instantaneous equilibrium with the plasma or target tissue, and where a concentration difference between target site and plasma or target tissue concentrations can be enhanced by drug-target binding. This local target site concentration can thus induce a delay in both drug-target association and dissociation and should therefore be considered in the analysis and prediction of the relationship between drug-target binding kinetics and target occupancy. This is especially important when in vitro values for drug-target binding are used to explain or predictin vivotarget occupancy and effect.
The local concentration that drives rebinding has been approached
historically from different perspectives. The biophysical approach started by describing diffusion around clustered receptors on a spherical or planar surface, which was subsequently discretized by dividing the space surrounding the receptor into the target vicinity and the bulk solution (Goldstein and Dembo, 1995; Coombs and Goldstein, 2004). The pharmacological approach started fromin vitro/in vivoobservations of target binding that could not be explained by drug-target binding from bulk/tissue concentrations, which was solved by assuming the existence of a micro-compartment surrounding the target (De Meyts, 1976; Perry et al., 1980; Frost and Wagner, 1984). The effect compartment model is a less mechanistic and more general approach that is often used in PKPD modelling to explain a delay between drug concentrations and drug effect. In this approach, the drug concentrations in a hypothetical compartment drive the drug effect. The effect compartment model is most often combined with the assumption of fast target binding in the effect compartment (resulting in a“Emax model”) (Francheteau et al., 1993; Cleton et al., 1999; Nolan et al., 2006; Groenendaal et al., 2008), although binding kinetics have also been incorporated in the effect compartment model (Yassen et al., 2005; Äbelö et al., 2006).
http://dx.doi.org/10.1016/j.ejps.2017.05.024
Received 10 May 2017; Accepted 11 May 2017
⁎Corresponding author.
E-mail address:[email protected](E.C.M. de Lange).
Available online 12 May 2017
The mathematical models that have been proposed from the different approaches as listed above share a similar compartmental structure and give rise to similar equations. In these models, the compartment in which binding takes place (in this paper referred to as the binding compartment) represents the target site, which is the (micro-) environment that surrounds the target (DeLisi, 1980; Perry et al., 1980; Coombs and Goldstein, 2004; Yassen et al., 2005; Vauquelin, 2010; Vauquelin and Charlton, 2010). An approximation of these compartmental models has been derived previously by assum-ing quasi steady-state in the bindassum-ing compartment (DeLisi, 1980) and has been used since for simulation studies (Vauquelin and Charlton, 2010; Vauquelin, 2016). We will refer to this approximation as the steady-state approximation. A recent comparison between thesteady-state approximationof rebinding and the effect compartment model (which has the same mathematical structure as the full two-compartment model from which thesteady-state approximationis derived) indicated that thesteady-state approximationis not capturing the behavior of the effect compartment model for fast dissociating ligands (Vauquelin, 2016).
A recently published approximation for describing target binding from a local (tissue) compartment, assumed that the overall decline of target occupancy is most influenced by the slowest process (the rate-limiting step) (de Witte et al., 2016). We will refer to this approxima-tion as therate-limiting step approximation.
Therate-limiting step approximationhas not yet been compared with the steady-state approximation as described by deLisi (1980). In this study, we use the rate limiting step approximationand thesteady-state approximationof drug distribution and drug-target binding and compare their ability to capture the behavior of the original compartmental model, from which both models are derived.
2. Methods
To allow comparison of thesteady-state approximationand the rate-limiting step approximationof drug-target binding and drug distribution as proposed here, both approximations should be written in the same mathematical format. In Appendix A, the steady-state rebinding
formula is rewritten in our format of choice, resulting in Eq.(1).
df k
k k N
=
+ ⋅ out
out on
1
(1) In Eq.(1),df1is the delay factor for Model 3 that is multiplied with koffandkonto account for the influence of the local concentration,koutis
thefirst-order distribution or diffusion rate constant from the micro compartment into plasma, kon is the second-order association rate
constant andNis the unbound target concentration.
In Appendix B, our rate-limiting step formula for rebinding is derived from our previously published approximation of target binding, tissue distribution and plasma elimination, resulting in Eq.(2).
df k BF
k k BF k N
= ⋅(1 − )
+ ⋅(1 − ) + ⋅ out
off out on
2
(2) In Eq. (2), df2 is the delay factor for Model 4, the additional
parameterBFis the fraction of target that is bound to the drug andkoffis
thefirst-order dissociation rate constant. It should be noted thatkoutis
used to replace the drug distribution rate constant that has been called k− or just k in the biophysical approach, kout in the mechanistic
pharmacological approach and keo in the non-mechanistic PKPD
modelling approach.
Ourrate-limiting step approximationof target binding was intended to approximate the duration of target occupancy after its maximal value and is thus applicable to calculate the delay factor forkoff. However,
bothkoffandkonneed to be multiplied with the same delay factor to
ensure that rebinding does not affect equilibrium target occupancy. Multiplyingkonandkoffwith the same factor is also common practice in
previous rebinding studies (Coombs and Goldstein, 2004; Vauquelin, 2016).
To assess the performance of therate-limiting step approximationand to compare this with the recently published evaluation of the steady-state approximation, four different mathematical models were com-pared.
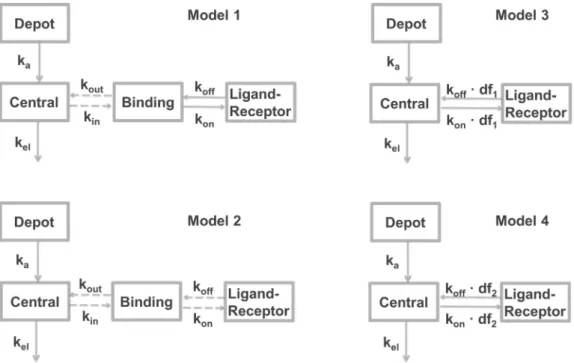
Model 1 (Fig. 1) is the full compartmental model that consists of a depot compartment from which absorption into plasma occurs, a central compartment representing the blood, a binding compartment
in which binding occurs and a ligand-receptor compartment that represents ligand in the target-bound state. Since rebinding is often hypothesized to occur from a small “micro-compartment”, the mass transfer from plasma to this compartment was assumed to be negligible and was excluded from the model equations. However, since rebinding can result in accumulation or depletion of ligand in the binding compartment, mass transfer was incorporated in the model equations describing the concentration in the binding compartment.
Model 2 (Fig. 1) is equal to Model 1, except that it does not take into account mass transfer between the binding compartment and the target-bound compartment. This model was required for comparison with the previous publication on the performance of the steady-state rebinding formula in which Model 2 was compared to Model 3 (Vauquelin, 2016). Model 3 (Fig. 1) encompasses an absorption and a central compart-ment in the same way as Model 1, but drug-target binding is now driven by the plasma concentrations. Bothkonandkoffare multiplied by the
delay factor, according to the steady-state approximation (Eq.(1)). Model 4 (Fig. 1) is the same as Model 3, butkonandkoffare now
multiplied by the delay factor according to the newly derived rate-limiting step approximation (Eq.(2)).
As Model 1 is the original compartmental model that is approxi-mated by Model 3 and Model 4, we can assess the performance of Model 3 and Model 4 by comparing the simulation outcomes of these models to the outcome of Model 1. More similarity to Model 1 means a more accurate approximation. Model 2 is included for comparison with the recent publication of Vauquelin (2016), in which Model 2 was
compared to Model 3. Also, the parameter values forkon,koff,kout,kel
andkawere set to the same values as for the simulations in the study of
Vauquelin (2016). In contrast to the publication of Vauquelin, the delay factor is calculated from Eqs.(1) and (2), wherekoutis used both for
simulation of distribution to the binding compartment and for calcula-tion of the delay factor. The total target concentracalcula-tion was chosen to yield similar results as in the recent publication ofVauquelin (2016).
The differential equations for all models are given inAppendix C. The initial concentration in the absorption compartment was 15·KDin
all simulations. The differential equations were solved by using the lsoda solving method in the deSolve package in R, version 3.3.1(Soetaert et al., 2010; R Core Team, 2013).
3. Results
The only differences between Eqs.(1) and (2)are the addition ofkoff
in the denominator and the correction for the influence of target saturation in the factor (1−BF). Sincekoff+kout· (1−BF) +kon·N
reduces to kout· (1−BF) +kon·N if koff≪kout· (1−BF) +kon·N,
Eqs.(1) and (2)only give similar results for the delay factordfifkoff
is relatively small compared to kout· (1−BF) or kon·N. This
corre-sponds to the steady-state approximation that is used to derive Eq.(1), which assumes that the concentration in the binding compartment adapts quickly to the surrounding concentrations. This requires that the rate at which the drug is distributed out of the binding compartment (determined bykout· (1−BF) andkon·N) is relatively large compared
to the rate at which drug is distributed into the binding compartment (determined by koff). It should be noted that the influence of the
saturation factor (1−BF) only has a major influence for high values of target occupancy.
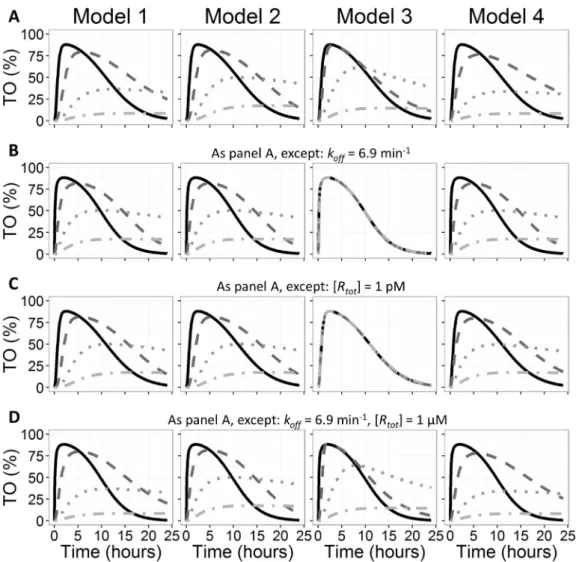
The performance of our rate-limiting step approximation has been visualized inFigs. 2 and 3.Fig. 2A demonstrates that both approxima-tions (steady-state: Model 3 and rate-limiting step: Model 4) produce similar results as Model 1, although Model 4 seems to approximate Model 1 a bit better than Model 3 does. In Fig. 2B, the difference between Model 3 and Model 4 is clearly demonstrated for the simulations with the lowest values ofkoutand Model 4 performs much
better for the parameter values that were used forFig. 2B (i.e.high koff,
low affinity and average receptor concentration). The mismatch between Model 3 and Model 1 inFig. 2B is not only the result of the high dissociation rate constant: if the target concentration is set to 1 pM instead of 1 nM, a similar mismatch as in Fig. 2B is observed, as demonstrated inFig. 2C. As can be derived from Eqs.(1) and (2), the same effect is observed when thekonvalue is lowered instead of the
target concentration (data not shown). Similarly, the mismatch be-tween Model 3 and Model 1 in Fig. 2B can be almost completely reversed by a thousand-fold increase in the target concentration or the kon(Fig. 2D).
The performance of ourrate-limiting step approximationof rebinding was also investigated in the context in which rebinding formulas are frequently applied: in simulations of the influence of koff on target
occupancy. Fig. 3A demonstrates that the influence of koff is much
better approximated by Model 4 than by Model 3. Although Model 4 also shows a mismatch in the increase rate of target occupancy for the lowestkoffvalues, the duration of target occupancy and the influence of
koff thereon resemble Model 1 closely (note the increase in the
simulation duration).
For a more typical drug treatment situation, with nanomolar drug-target affinity and drug-target concentration and a moderate delay in distribution from plasma to the binding site, both Model 3 and Model 4 produce comparable results with Model 1, as illustrated inFig. 3B. The result of incorporating a correction for target saturation in our rate-limiting step approximation is illustrated in Fig. 3C and D: While for Fig. 3C Model 3 and Model 4 result in similar simulations, an increased dose results in a mismatch between Model 3 and Model 1, which is not observed for Model 4.
4. Discussion
Therate-limiting step approximationfor drug distribution and drug-target binding that we propose here on basis of our previous publication differs significantly from the steady-state approximation when the dissociation rate constant (koff) is high, compared to the distribution
rate constant (kout) and the product of the association rate constant and
the unbound target concentration (kon·N). This difference results in an
improved approximation of the original compartmental model (Model 1), from which both approximations are derived.
compared to thesteady-state approximationthat we demonstrated here, yields a mathematically reliable simulation of the influence ofkonand
kofffor a wider range of pharmacological situations. Moreover, our new
approximation can help to understand the role of the relevant parameters and to interpret the observed influence of rebinding from in vivo,in vitroorin silicodata. For example, thesteady-state approxima-tionresults in a decline of target occupancy that is linearly related tokoff
as long as the drug elimination from plasma is not rate-limiting (Eq. (1)). This is not in line with the intuitive thinking that the distribution/ diffusion out of the target vicinity could also be determining the decrease of target occupancy, which would makekoffless influential.
With our rate-limiting step approximation, this intuitive thought is confirmed and the influence of koff on the decline rate of target
occupancy decreases whenkoffbecomes relatively large. Also, a correct
approximation of binding and distribution is essential if this approx-imation is used to discriminate between various mechanisms that can explain the duration of drug action or target occupancy.
While therate-limiting step approximationas presented here is a more robust approximation than thesteady-state approximation, the difference between these two approximations is most significant when the extent of the influence of drug distribution is low (since the product of target concentration andkonhas to be relatively small). We do not provide a
rigorous mathematical proof here that therate-limiting step approxima-tionis better than thesteady-state approximation. However, the deter-mining equations and the simulations make clear that therate-limiting
step approximationcan be significantly different and more accurate for conditions with limited rebinding, slow distribution out of the binding compartment and relatively fast dissociation. An approximation of the full rebinding model, such as the two approximations discussed here, is not required for simulations or modelfitting of drug distribution and drug-target binding, since the full compartmental model (Model 1) can be used. However, the previous use of thesteady-state approximation demonstrates the value of the rate-limiting step approximation for investigations in the role of drug-target binding kinetics and rebinding. In conclusion, the rate-limiting step approximation provides an improved approximation of drug-target binding and drug distribution which can be used as an alternative for the existing steady-state approximation. Using the rate-limiting step approximation as presented here is especially important when dissociation is fast compared to association and distribution out of the binding compartment.
Acknowledgements
This research is part of the K4DD (Kinetics for Drug Discovery) consortium which is supported by the Innovative Medicines Initiative Joint Undertaking (IMI JU) under grant agreement no. 115366. The IMI JU is a project supported by the European Union's Seventh Framework Programme (FP7/2007–2013) and the European Federation of Pharmaceutical Industries and Associations (EFPIA).
Appendices
Appendix A: rewriting the steady-state approximation of rebinding
In thesteady-state approximationof rebinding, bothkonandkoffare multiplied with the delay factordf1that is defined in Eq.(A.1), where all
parameters are defined as explained in methods (Vauquelin, 2016):
df = 1
1 +kk N
1 on∙
out (A.1)
Eq.(A.1)can be rewritten as Eq.(A.2), which equals Eq.(A.3), which provides Eq.(1)of the main text.
df = k 1k N
k
1 out+ on∙
out (A.2)
df k
k k N
=
+ ∙ out
out on
1
(A.3)
Appendix B: derivation of the rate-limiting step approximation of target binding and drug distribution
For therate-limiting step approximation, our previously published approximation of pharmacokinetics and target binding was used as the starting point (de Witte et al., 2016). From this publication, Eq. (S35) is the most relevant which is given as Eq.(B.1)here. In Eq.(B.1),λTO(BF) is the
fractional decrease in target occupancy, as a function of the target fraction bound (BF).λelTO(BF) is the value thatλTO(BF) would have if the
elimination would be rate limiting and thus determining the decrease of target occupancy.λoutTO(BF) is the value thatλTO(BF) would have if drug
distribution from the binding compartment to plasma would be rate limiting.λTO(BF) equals the reverse rate constantkoff·dffrom Eqs.(1) and (2)if
there would be no drug in plasma,i.e.if the elimination rate would be extremely high. Such a high elimination rate can be assumed for Eqs.(1) and (2), since these equations are meant for models that simulate plasma concentrations separately. Assuming an extremely high elimination rate constant leads to an extremely high value ofλelTO(BF), which reduces Eqs.(B.1)and(B.2).
λ (BF) = 1
+ +
TO
λ BF λ BF k
1 ( )
1 ( )
1
elTO outTO off (B.1)
λ (BF) = 1
+ TO
λ BF k
1 ( )
1
outTO off (B.2)
SinceλoutTO(BF)is given by Eq.(B.3)according to our previous publication (Eq. (S33)), Eq.(B.2)equals Eq.(B.4), which can be rewritten as Eq. (B.5).
λ BF k BF
R
( ) = ∙(1 − ) 1 + [ ]∙ outTO
out
tot BF K
1 −
λ (BF) = 1 + TO k 1 1 kout BF Rtot BF KD off
∙ (1 − )
1 + [ ] ∙1 − (B.4)
λ (BF) = 1
+ TO
R
k BF k
1 + [ ] ∙
∙ (1 − ) 1 tot BF KD out off 1 − (B.5) Eq.(B.5)can be rewritten as Eq.(B.6)by realizing thatKDequals the ratio ofkofftokonand by multiplying each fraction by unity in such a way
that the denominators become equal and the two fractions can be summed as in Eq.(B.7). Eq.(B.7)equals Eq.(B.8)and since [Rtot]·(1−BF) is equal
to the unbound target concentration, Eq.(B.8)provides Eq.(2).
⎛ ⎝ ⎜⎜ ⎞
⎠ ⎟⎟
λ (BF) = 1
+ TO
k R k
k BF k
k BF
k BF k
+ [ ] ∙ ∙
∙ (1 − ) ∙
∙ (1 − ) ∙ (1 − ) ∙
off tot BF koff kon off out off out out off 1 − , (B.6)
λTO(BF) = k R BF1k k BF
k BF k
+ [ ] ∙ (1 − ) ∙ + ∙ (1 − ) ∙ (1 − ) ∙
off tot on out
out off (B.7)
λ BF k BF k
k R BF k k BF
( ) = ∙(1 − )∙
+ [ ]∙(1 − )∙ + ∙(1 − ) TO
out off
off tot on out (B.8)
Appendix C: differential equations of the four different models as used for the simulations
The concentrations in the depot and the central compartment were modeled in the same way for all four models according to Eqs.(C.1) and (C.2), respectively. In these equations, [DEP] is the drug concentration in the depot compartment, [C] is the drug concentration in the central compartment,kais thefirst-order absorption rate constant and kelis thefirst-order elimination rate constant.
d DEP
dt k DEP
[ ]
= − a∙[ ]
(C.1)
d C
dt k DEP k C
[ ]
= a∙[ ] − el∙[ ]
(C.2) The concentration in the binding compartment is only explicitly simulated in Model 1 and Model 2 according to Eqs.(C.3) and (C.4), respectively. Here, [B] denotes the drug concentration in the binding compartment, [N] denotes the unbound target concentration (which is calculated by assuming the total target concentration is constant), [LR] denotes the drug that is bound to the target,koutis thefirst-order distribution constant
between the binding compartment and plasma,konis the second-order association rate constant andkoffis thefirst-order dissociation rate constant.
Model 1:
d B
dt k C B k B N k LR
[ ]
= out∙([ ] − [ ]) − on∙[ ]∙[ ] + off∙[ ]
(C.3) Model 2:
d B
dt k C B
[ ]
= out∙([ ] − [ ])
(C.4) The concentration of the target-bound drug is calculated identically for Model 1 and Model 2 according to Eq.(C.5):
Model 1, Model 2:
d LR
dt k B N k LR
[ ]
= on∙[ ]∙[ ] − off∙[ ]
(C.5) For Model 3 and Model 4 the target bound drug is calculated according to Eqs.(C.6) and (C.7), whereBFdenotes the fraction of the target that is bound to the drug.
Model 3:
d LR
dt k C N k LR
k
k k N
[ ]
= ( ∙[ ]∙[ ] − ∙[ ])∙
+ ∙
on off out
out on (C.6)
Model 4:
d LR
dt k C N k LR
k BF
k k BF k N
[ ]
= ( ∙[ ]∙[ ] − ∙[ ])∙ ∙(1 − ) + ∙(1 − ) + ∙
on off
out
off out on (C.7)
References
Äbelö, A., Andersson, M., Holmberg, A.A., Karlsson, M.O., 2006. Application of a combined effect compartment and binding model for gastric acid inhibition of
HO47108: a potassium competitive acid blocker, and its active metabolite AR-HO47116 in the dog. Eur. J. Pharm. Sci. 29, 91–101.
Coombs, D., Goldstein, B., 2004. Effects of the geometry of the immunological synapse on the delivery of effector molecules. Biophys. J. 87, 2215–2220.
Copeland, R.A., Pompliano, D.L., Meek, T.D., 2006. Drug-target residence time and its implications for lead optimization. Nat. Rev. Drug Discov. 5, 730–739.
Dahl, G., Akerud, T., 2013. Pharmacokinetics and the drug-target residence time concept. Drug Discov. Today 18, 697–707.
DeLisi, C., 1980. The biophysics of ligand-receptor interactions. Q. Rev. Biophys. 13, 201–230.
Francheteau, P., Steimer, J.L., Merdjan, H., Guerret, M., Dubray, C., 1993. A mathematical model for dynamics of cardiovascular drug action: application to intravenous dihydropyridines in healthy volunteers. J. Pharmacokinet. Biopharm. 21, 489–514.
Frost, J.J., Wagner, H.N., 1984. Kinetics of binding to opiate receptors in vivo predicted from in vitro parameters. Brain Res. 305, 1–11.
Goldstein, B., Dembo, M., 1995. Approximating the effects of diffusion on reversible reactions at the cell surface: ligand-receptor kinetics. Biophys. J. 68, 1222–1230.
Groenendaal, D., Freijer, J., Rosier, A., de Mik, D., Nicholls, G., Hersey, A., et al., 2008. Pharmacokinetic/pharmacodynamic modelling of the EEG effects of opioids: the role of complex biophase distribution kinetics. Eur. J. Pharm. Sci. 34, 149–163.
Johnson, M., Kozielska, M., Pilla Reddy, V., Vermeulen, A., Li, C., Grimwood, S., et al., 2011. Mechanism-based pharmacokinetic-pharmacodynamic modeling of the dopamine D2 receptor occupancy of olanzapine in rats. Pharm. Res. 28, 2490–2504.
Meyts, P. De, 1976. Cooperative properties of hormone receptors in cell membranes. J. Supramol. Struct. 4, 241–258.
Nolan, E.R., Feng, M.R., Koup, J.R., Liu, J., Turluck, D., Zhang, Y., et al., 2006. A novel
predictive pharmacokinetic/pharmacodynamic model of repolarization prolongation derived from the effects of terfenadine, cisapride and E-4031 in the conscious chronic av node—ablated, His bundle-paced dog. J. Pharmacol. Toxicol. Methods 53, 1–10.
Perry, D.C., Mullis, K.B., Oie, S., Sadée, W., 1980. Opiate antagonist receptor binding in vivo: evidence for a new receptor binding model. Brain Res. 199, 49–61.
R Core Team, 2013. R: A Language and Environment for Statistical Computing. R Found. Stat. Comput. Vienna, Austria. (URL http//www.R-Project.org/).
Soetaert, K., Petzoldt, T., Setzer, R.W., 2010. Solving differential equations in R: package deSolve. J. Stat. Softw. 33, 1–25.
Vauquelin, G., 2010. Rebinding: or why drugs may act longer in vivo than expected from their in vitro target residence time. Expert Opin. Drug Discovery 5, 927–941.
Vauquelin, G., 2016. Impact of target binding kinetics on in vivo drug efficacy: koff, kon
and rebinding. Br. J. Pharmacol. 173, 2319–2334.
Vauquelin, G., Charlton, S.J., 2010. Long-lasting target binding and rebinding as mechanisms to prolong in vivo drug action. Br. J. Pharmacol. 161, 488–508.
de Witte, W.E.A., Danhof, M., van der Graaf, P.H., de Lange, E.C.M., 2016. In vivo target residence time and kinetic selectivity: the association rate constant as determinant. Trends Pharmacol. Sci. 37, 831–842.
Yassen, A., Olofsen, E., Dahan, A., Danhof, M., 2005. Pharmacokinetic-pharmacodynamic modeling of the antinociceptive effect of buprenorphine and fentanyl in rats: role of receptor equilibration kinetics. J. Pharmacol. Exp. Ther. 313, 1136–1149.