TRENDS AND DETERMINANTS OF WATER-DRINKING PRACTICES: A MIXED-METHODS STUDY
Uhlee (Yuri) Oh
A thesis submitted to the faculty at the University of North Carolina at Chapel Hill in partial fulfillment of the requirements of the degree of Master of Science in the School of Dentistry (Dental Hygiene Education).
Chapel Hill 2018
ABSTRACT
Uhlee (Yuri) Oh: Trends and Determinants of Water-Drinking Practices: a Mixed-Methods Study (Under the direction of Kimon Divaris)
The rise of bottled water (BW) consumption is a dental public health concern. This mixed-methods study aimed to 1) identify trends and determinants of water-drinking practices among children presenting to an academic dental institution over 15 years, and 2) understand Latino community members’ experiences with fluoridated community water (CW) and views on strategies to promote its consumption.
Analyses of electronic health record data showed that BW consumption increased from 17% in 2004 to 42% in 2016 (n=2,920, P<0.05). Medicaid-enrolled children [prevalence ratio (PR)=2.1; 95% confidence interval (CI)=1.8-2.4] and those living in rural areas (PR=1.3, 95% CI=1.1-1.5) were significantly more likely to consume BW over CW than those without Medicaid and those in urban areas, respectively.
Interviews with 15 Latino parents and key informants revealed a ‘lack of knowledge about safety and fluoridation of CW’ and ‘ingrained upbringings that devalued CW.’ Spanish-speaking health professionals may
ACKNOWLEDGEMENTS
First and foremost, a huge thank you to my thesis chair, Dr. Kimon Divaris, for all of your guidance, support, and mentorship to make my first research experience a great and memorable one! Words cannot fully express how much I appreciate the opportunities you’ve provided for me! Thank you, Dr. Jane
Weintraub and Professor Lattice Sams, for your invaluable insights and contributions to this project and for encouraging and challenging me to conduct thorough, quality work! This project wouldn’t be what it is without each and every one of you!
Also, a big thank you to Mr. Younus Syed in OCIS for helping us extract and utilize the EPR data, to Dr. Laura Villa-Torres for reviewing and providing feedback on my interview guides, and to Mr. Paul Mihas at the Odum Institute for teaching me how to utilize Atlas.ti software and conduct qualitative data analysis.
TABLE OF CONTENTS
LIST OF FIGURES ... vii
LIST OF TABLES ... viii
LIST OF ABBREVIATIONS ... ix
CHAPTER I. INTRODUCTION ... 1
CHAPTER II. REVIEW OF THE LITERATURE ... 3
Drinking Water ... 3
Community Water ... 4
Bottled Water ... 6
Community Water Fluoridation and Dental Caries ... 8
Barriers to Community Water Consumption ... 9
Aims of Study ... 11
References ... 12
CHAPTER III. INTRODUCTION AND LITERATURE REVIEW ... 16
CHAPTER IV. METHODS ... 18
CHAPTER V. RESULTS ... 20
CHAPTER VI. DISCUSSION ... 27
CHAPTER VII. CONCLUSION ... 29
APPENDIX 1: ELECTRONIC HEALTH RECORD DATA DOMAINS EXTRACTED FOR STUDY PURPOSES ... 30
APPENDIX 2: INTERVIEW GUIDE FOR COMMUNITY MEMBERS ... 31
APPENDIX 3: INTERVIEW GUIDE FOR KEY INFORMANTS ... 33
APPENDIX 4: INTERVIEW RECRUITMENT/VERBAL CONSENT SCRIPT ... 35
LIST OF FIGURES
Figure 1 Distribution of responses to “What type of water does your child drink most often?” among all patients presenting to the UNC Pediatric
Dentistry clinics for routine visits between 2002 and 2016.……….…….21 Figure 2 Proportion of bottled water consumption as primary water source
(v. city and well) among all patients presenting to the UNC Pediatric Dentistry clinics for routine visits between 2002 and 2016 (excludes
missing and reported “other” water source).………21 Figure 3 Proportion of “don’t know” responses to the question, “Is there fluoride
in your primary drinking water at home?” among all patients presenting to
LIST OF TABLES
Table 1 Demographic information and water preference (CW v. BW, exclusively) recorded at the first visit of patients presenting to the UNC Pediatric Dentistry
clinics between 2002 and 2016, excluding missing and “other” responses……….……22 Table 2 Results of multivariable log-binomial regression of BW preference (over CW)
recorded at the first visit of patients presenting to the UNC Pediatric Dentistry clinics on sociodemographic characteristics, between 2002 and 2016,
LIST OF ABBREVIATIONS
BW Bottled water
CDC Centers for Disease Control and Prevention CI Confidence interval
CW Community water
EPA Environmental Protection Agency EPR Electronic Patient Record
FDA Food and Drug Association
FFDCA Federal Food, Drug, and Cosmetic Act IRB Institutional Review Board
NC North Carolina
NHANES National Health and Nutrition Examination Survey NPDWRs National Primary Drinking Water Regulations NSDWRs National Secondary Drinking Water Regulations OCIS Office of Computing and Information Systems ODPHP Office of Disease Prevention and Health Promotion PHS Public Health Service
p.p. Percentage points PR Prevalence ratio SDWA Safe Drinking Water Act SoD School of Dentistry
CHAPTER I: INTRODUCTION
The introduction of community water (CW) fluoridation, one of the ten great public health
achievements of the last century, has contributed to large decrements in dental caries burden among both children and adults since the 1960s.1–4 Despite the well-known benefits of fluoridated CW, the consumption of bottled water (BW), many of which do not contain optimal levels of fluoride needed for dental caries prevention and are even slightly acidic,5,6 has been on the rise over the last fifteen years.7 Of note, BW consumption is very prevalent among Latino communities, which also face a disproportionate burden of dental disease.2,8 This phenomenon raises public health concerns, as those who have the greatest need for the caries-preventive benefits of fluoride may be least likely to receive it.
Recent evidence suggests that the high consumption of BW among Latino communities is attributed to pervasive beliefs that CW is generally unsafe due to its poor aesthetic qualities (e.g., taste, smell, color).9,10
Such perceptions and beliefs were thought to be the likely products of historical events which actually rendered the CW unsafe to drink for quite some time.11–16 While BW may generally be perceived to be of better quality and safety than CW, several reports comparing the two have shown that both are extensively regulated and deemed safe for consumption by their regulating agencies.17–21 Furthermore, CW is
CHAPTER II: REVIEW OF THE LITERATURE Drinking Water
Water is an essential nutrient of the human body and all other living organisms. An adult’s body weight is comprised of 50-60% water weight, while a newborn’s up to 75-80%.25 Systemically, water provides hydration and plays several homeostatic roles in the human body, such as nutrient delivery, waste
transportation, regulation of body temperature, and lubrication of various epithelial and connective tissues. Orally, water forms the basis of saliva, which provides moisture and lubrication to the teeth and surrounding soft tissues, and aids in the initial process of digestion. Because water plays such a fundamental role in both systemic and oral health, it is no surprise that consumers care deeply about the quality of the water they drink.
Drinking water is sourced from ground water, surface water, or a combination of both.26 There are three classifications of drinking water: well, community/tap, and bottled. Well water is ground water that is pumped from wells that tap into the earth’s aquifer. Wells are typically privately owned and are unregulated by the government; thus, consumers must be responsible for monitoring the safety of their own water.27 Community water (CW) is regulated water expelled from a sink faucet. It can be sourced from both ground and surface water. In the United States (U.S.), ground water sources approximately 30% of the population’s CW, while surface water sources that of the remaining 70%.26
natural and processed BW can be further differentiated into subcategories: natural water into mineral, spring, artesian, and well, depending on the source from which it originates, and processed water into distilled, deionized, and reverse osmosis, depending on the purifying process it undergoes.28 In this review,
the two forms of drinking water that will be compared are the government-regulated waters: community and bottled.
Community Water
Community water, also known as public or municipal water, can supply non-community and community water systems. Among non-community water systems are transient and non-transient systems; non-community systems provide public drinking water less than year-round to different groups of people on an irregular basis (e.g., at gas stations and campgrounds), and transient systems also serve less than year-round, but to the same groups of people on a regular basis (e.g., schools, offices, hospitals).29 On the
contrary, CW systems consistently provide tap water to the same people year-round (e.g., residents of homes and communities) and served 89% of the total U.S. population in 2014.29,30
CW is regulated by the U.S. Environmental Protection Agency (EPA) and must adhere to the strict guidelines set forth in the Safe Drinking Water Act (SDWA), one of which mandates the regulation of at least 96 chemical, physical, radiological, and microbiological contaminants.18 CW must meet the federal health standards outlined in the National Primary Drinking Water Regulations (NPDWRs); however, the aesthetic quality-related standards outlined in the National Secondary Drinking Water Regulations (NSDWRs), which impact features such as taste, smell, and appearance, are recommended but not legally enforced, as they do not affect the safety of the water.31
water to 0.7mg/L due to the widespread access and exposure to fluoride today.33,34 It is important to
highlight that while the EPA monitors the safety of CW and the PHS sets the recommendation for optimal fluoride level added to the water, each State and community has the ultimate say on whether or not a public water system shall fluoridate its water.35 For example, of the 89% of the U.S. population served by CW systems in 2014, only 74.4% of those served were receiving fluoridated water.30 The state with the highest percentage of people receiving optimally fluoridated CW was Kentucky at 99.9%. The states with the lowest percentages were Hawaii at 11.7% and New Jersey at 14.6%. In the state of North Carolina, 87.8% of its residents on CW systems were served by optimal levels of fluoride in their CW in 2014.30
From a cost standpoint, it has been estimated that an average North Carolina household utilizing 4,000 gallons of CW per month would pay approximately $0.018 per gallon, which includes the cost of water treatment, delivery, and sewer service.33 Moreover, cost-benefit studies have shown that while the per capita annual cost of water fluoridation ranges from $0.11 to $4.92 in communities of at least 1,000 people, the annual per capita benefit ranges from $5.49 to $93.19, including costs of dental treatment averted.22 Overall, the advantages of CW are numerous, including its widespread accessibility, safety, optimal fluoride content in most states, low cost, and cost-savings benefit.
And while the advantages of tap water are copious, it certainly has its disadvantages. According to previous studies, CW has been perceived by many in the public, particularly among the U.S. Hispanic/Latino population, as generally having unfavorable aesthetic features such as a foul taste, odor, and/or
appearance.10,15 In addition to these perceived unaesthetic features and “stigma,” CW is susceptible to contamination, which can occur in the original source of the water or the distribution system after the water has already been treated.36 In 2011-2012, the etiology behind 66% of drinking water-related disease
outbreaks was the presence of Legionella in drinking water systems, a bacterial species known to cause Legionnaires’ disease.37 However, it should be noted that 67% of the Legionella outbreaks occurred in
immunocompromised individuals, advising them of their increased susceptibility to illnesses caused by their top ten commonly found contaminants in public water systems.36
Other historical cases of contamination have been related to regulatory negligence. For example, in the case of the Flint water crisis in Michigan, the city of Flint failed to follow the appropriate corrosion inhibiting protocol when transitioning the city to a different water source.38 This permitted the leaching of lead from old pipes into the water supply, resulting in the elevated blood-lead levels of children who consumed the contaminated public water. While the number of people benefitting from tap water far exceeds that of those who are negatively impacted by it, the fact that adulteration of CW does occur, although rare, cannot be entirely disregarded.
Bottled Water
The consumption of BW has skyrocketed worldwide in the last decade. Just in the U.S. alone, its consumption per capita has more than doubled.7 BW comes from a wide assortment of sources and via
various types of processing. The minimally processed, “natural” BWs include mineral water (where the dense mineral makeup of the water remains preserved), spring water (obtained from naturally occurring ground water springs), artesian water (attained from water that naturally rises above the height of a confined aquifer), and well water.26 Alternatively, processed or “purified” BWs are sourced from ground or treated CW which undergo additional filtration processes such as distillation, deionization, and reverse osmosis. BW, like CW, is stringently monitored and regulated at the federal and state levels; however, its governing agency is the U.S. Food and Drug Administration (FDA) due to its classification as a packaged food product.18 BW must comply with the standards outlined in the Federal Food, Drug, and Cosmetic Act (FFDCA), one of which states that the FDA regulations for BW must be equivalent, if not more stringent, than the EPA regulations for CW.18
The FDA regulates 91 contaminants, 11 of which are not regulated in CW; however, 4 contaminants regulated in CW are not regulated in BW, due to the FDA deeming them inapplicable to BW.18
disease outbreaks.10,15 In 2011-2012, only 6.3% of drinking water-related disease outbreaks were attributed
to BW, compared to 93.7% for public water.37 Part of this may be due to differences in potential for
contamination during the distribution process, as BW remains hygienically sealed from the time it is treated to the time of consumption. Some health concerns regarding BWs have been raised related to the leaching of di(2-ethylhexyl)phthalate (DEHP; a chemical linked to disruptions in the endocrine system) from the plastic of the bottle to the water. Studies have shown that contamination from DEHP likely occurs during the
processing stage of the water in factories, rather than from any leaching from the plastic itself.21 And even so, evidence suggests that the amount of DEHP ingested via food and water are well below safe levels set by the EPA. In fact, the amount of DEHP leached into the body via usage of certain hospital equipment was shown to be three to six times greater than that found in food and water.21 In brief, the commonly cited benefits of BW
are its perceived and actual purity and safety, as well as its low susceptibility to contamination.
Despite the benefits of BW, its disadvantages far exceed its benefits. First, BW contributes to a plethora of environmental issues. Sundry resources go into the manufacturing and recycling of the plastic bottles alone, one of which, ironically, is water. Interestingly, three to four times the amount of water packaged in the bottle is required to produce the bottle itself.24 Moreover, enormous amounts of raw material and fossil fuels that go into manufacturing, distributing, and recycling plastic water bottles render BW uneconomical. Compounding this list of issues is the consequent production of greenhouse gas emissions from the burning of fossil fuels. As a response to environmental concerns, the BW industry has made efforts to “lightweight” the bottles and push for recycling; however, more than 75% of bottles still end up and accumulate in landfills.
risk for dental caries. Furthermore, some BWs have also been shown to be acidic, falling at or below the 6.5 critical erosive pH for root dentin and even 5.5 for enamel.6 Taking all factors into consideration, while BW has its benefits, a case can and should be made for promoting widespread behaviors of CW consumption. Community Water Fluoridation and Dental Caries
The prevalence of dental caries in the U.S. has been steadily declining in the latter half of the twentieth century, and it has been largely attributed to the introduction of CW fluoridation in the 1960s.1–4 Fluoride has been linked to the significant decline in the number of permanent decayed, missing, and filled teeth (from 6.2 to 2.6) among adolescents of ages 12-19 years during roughly a forty-year period.34 Also during that window, a 90% to 60% reduction was seen in the prevalence of dental caries in at least one permanent tooth for that same adolescent age group. Early studies suggested that fluoride ingested in optimal levels during pre-eruptive tooth development can become embedded into the enamel matrix to favorably alter their mineral composition, making them harder and more resistant to acid attacks and caries development.34,39 Contrary to this widespread dogma of “systemic fluoride exposure,” the current
understanding of fluoride’s caries-preventive mechanism involves predominantly post-eruptive topical effects on dental hard tissues and the oral biofilm.40,41 Nevertheless, some reports suggest that fluoridated CW serves as a source of systemic fluoride which also exerts topical protection for tooth enamel via low levels of fluoride release into surrounding saliva and dental plaque.42 Due to the demonstrated promising effects of CW fluoridation on the prevention of caries, the Office of Disease Prevention and Health Promotion (ODPHP) has made it a national objective to increase the proportion of the U.S. population served by
fluoridated CW systems to 79.6% by the year 2020.43 As noted before, this rate was 74.4% as of 2014.30 Despite the decline in caries prevalence over the years, evidence from the 2011-2012 National Health and Nutrition Examination Survey (NHANES) indicate that pronounced oral health disparities remain. Hispanics experience higher rates of dental caries than non-Hispanic Whites.2,44 Tooth decay persists as the
White children, making them 1.5 times as likely to experience tooth decay.44 Additionally, 19.4% of Hispanic
children in the same age group had untreated dental caries, compared to 10.1% of Non-Hispanic Whites, which is also illustrative of their reduced access to dental care despite their higher caries burden compared to non-Hispanic white children.44
It is also noteworthy that Hispanic individuals of specifically Mexican origin incur higher rates of untreated caries than the general Hispanic population across all age groups.2 This finding was most
prominent among the 65+ age group, in which the Mexican elderly had double the rate of untreated caries compared to that of the general Hispanic elderly. Over the years, it has also been observed that those who fall below the federal poverty level consistently experience higher rates of untreated caries lesion compared to those of higher socioeconomic status.2,45
Barriers to Community Water Consumption
While low income is a barrier to seeking in-office dental treatment,46 multiple reports and lines of
evidence suggest that Hispanics in the U.S., particularly Mexican-Americans, are least likely to reap the full preventive dental benefits of CW fluoridation. Mexico has, by far, the highest per capita consumption of BW in the world, consuming approximately 71% more BW than an individual in the U.S.8 Such notable differences in drinking water practices may indicate a culturally transmitted practice, regardless of its etiology.
University staff and student participants reported of drinking exclusively BW, primarily due to the poor aesthetic features of CW, and secondarily due to health concerns.15
A reoccurring theme in this body of literature is the notion that unpleasant qualitative features of CW (e.g., cloudy appearance and taste/scent of chlorine) are signs of unpotable water that should be avoided. While this may be an instinctive assumption, it is a fallacious one. First, according to EPA, when CW is treated, chlorine is added as an oxidizing and disinfecting agent to control microbial growth and to eliminate various harmful contaminants and poor qualitative factors, such as color, taste and odors. Ironically, EPA has also reported that while increasing chlorine dosages raises its disinfecting and oxidizing power, it could potentially create a less than favorable taste and odor.48 As a result, these the taste and smell are often times misinterpreted as dangerous, when they are actually indicators of greater safety. This
misinterpretation can negatively steer individuals to alternative sources of hydration, such as BW, sugar-sweetened beverages, or even no liquids at all, resulting in inadequate fluoride exposure or increased sugar exposure, making them more susceptible to dental caries.
Other more legitimate reasons for CW apprehension may exist. First, it is possible that residents of poorly maintained housing units genuinely have had adverse firsthand experiences with unpotable CW due to unsafe pipes, plumbing, and living conditions.49,50 That, along with past experiences of local CW safety
violations could have conditioned certain communities to consider BW as a superior option to CW. Others may have grown up in geographically vulnerable areas that have encountered natural disasters or other historical events which compromised the safety of CW, such as Hurricane Maria in 2017, the 2017 and 1985 earthquakes in Mexico City, or the 1991 cholera epidemic.11–16 Such experiences may likely have reinforced trust and reliance on BWs.
against dental caries; yet, since Hispanic children from low-income families are least likely to seek or have access to dental services, it is particularly important that they maximize their exposure to safe, inexpensive, and widely accessible fluoridated CW to help decrease their risk of dental caries. In sum, there is ample motivation for the development of a systematic effort designed to promote the switch from consuming BW to fluoridated CW among this vulnerable population.
Aims of Study
To add to the growing knowledge base of water consumption practices among pediatric populations and to investigate ways to promote the switch from BW to CW consumption, we sought to conduct a mixed-methods study with the following aims:
1. a) describe the trends and characteristics and b) identify correlates and determinants of drinking water practices among families of children and adolescents attending the pediatric dental clinics of an academic dental institution (UNC-Chapel Hill) over the last 15 years.
REFERENCES
1. White BA, Caplan DJ, Weintraub JA. A quarter century of changes in oral health in the United States. J Dent Educ 1995;59(1):19-57.
2. Health, United States, 2015, With Special Feature on Racial and Ethnic Health Disparities. 2016. 3. Health, United States, 2009 with Special Feature on Medical Technology. 2010:563.
4. Achievements in Public Health, 1900-1999: Fluoridation of Drinking Water to Prevent Dental Caries. MMWR Morb Mortal Wkly Rep 1999;48(41):933-40.
5. Johnson SA. Concentration Levels of Fluoride in Bottled Drinking Water. Journal of Dental Hygiene 2003;77(3):161-7.
6. Guha U. Erosion potential of well water, commercially available bottled water, and vegetable juice [master's thesis]. Chapel Hill, NC: The University of North Carolina at Chapel Hill; 2015.
7. Beverage Marketing Corporation; International Bottled Water Association. Per capita consumption of bottled water in the United States from 1999 to 2016 (in gallons). Statista 2018. Available at:
https://www.statista.com/statistics/183377/per-capita-consumption-of-bottled-water-in-the-us-since-1999/. Accessed April 10, 2018.
8. Beverage Marketing Corporation; International Bottled Water Association. Per capita consumption of bottled water worldwide in 2016, by leading countries (in gallons). Statista 2018. Available at: https://www.statista.com/statistics/183388/per-capita-consumption-of-bottled-water-worldwide-in-2009/. Accessed April 9, 2018.
9. Huerta-Saenz L, Irigoyen M, Benavides J, Mendoza M. Tap or bottled water: drinking preferences among urban minority children and adolescents. J Community Health 2012;37(1):54-58.
doi:10.1007/s10900-011-9415-1.
10. Scherzer T, Barker JC, Pollick H, Weintraub JA. Water consumption beliefs and practices in a rural Latino community: implications for fluoridation. J Public Health Dent 2010;70(4):337-343. doi:10.1111/j.1752-7325.2010.00193.x.
11. Graham D. In Storm-Ravaged Puerto Rico, Drinking Water in Short Supply. US News World Rep 2017. Available at: https://www.usnews.com/news/top-news/articles/2017-09-27/in-storm-ravaged-puerto-rico-drinking-water-in-short-supply. Accessed October 25, 2017.
12. Gonzales R, Chappell B. Mexico City Earthquake Update: All Children Are Accounted For. NPR 2017. Available at:
http://www.npr.org/sections/thetwo-way/2017/09/21/552574762/mexico-city-earthquake-update-desperate-attempts-to-reach-girl-trapped-by-rubble. Accessed October 25, 2017. 13. Guzmán N, Zeballos JL, Poncelet JL. Disaster Chronicles No. 3: Earthquake in Mexico, September 19 and
20, 1985. PAHO 1985.
15. Espinosa-García AC, Díaz-Ávalos C, González-Villarreal FJ, Val-Segura R, Malvaez-Orozco V, Mazari-Hiriart M. Drinking water quality in a Mexico city university community: perception and preferences. Ecohealth 2015;12(1):88-97. doi:10.1007/s10393-014-0978-z.
16. Sepúlveda J, Valdespino JL, García-García L. Cholera in Mexico: the paradoxical benefits of the last pandemic. Int J Infect Dis 2006;10(1):4-13. doi:10.1016/j.ijid.2005.05.005.
17. Edberg SC. Review Paper: Microbial Health Risks of Regulated Drinking Waters in the United States. 2013.
18. Hirst RR. Bottled Water and Tap Water: Just the Facts. Drinking Water 2011. 19. Bullers AC. Bottled Water: Better Than the Tap? FDA Consum 2002;36(4).
20. Navarro KE. Safety and Secrecy of Bottled Water. Hauppauge, N.Y: Nova Science Publisher’s; 2010. 21. Erythropel HC, Maric M, Nicell JA, Leask RL, Yargeau V. Leaching of the plasticizer
di(2-ethylhexyl)phthalate (DEHP) from plastic containers and the question of human exposure. Appl Microbiol Biotechnol 2014;98(24):9967-9981. doi:10.1007/s00253-014-6183-8.
22. Ran T, Chattopadhyay SK, Community Preventive Services Task Force. Economic evaluation of community water fluoridation: A community guide systematic review. Am J Prev Med 2016;50(6):790-796. doi:10.1016/j.amepre.2015.10.014.
23. Griffin SO, Jones K, Tomar SL. An economic evaluation of community water fluoridation. J Public Health Dent 2001;61(2):78-86. doi:10.1111/j.1752-7325.2001.tb03370.x.
24. Gleick PH. Bottled and Sold: The Story behind Our Obsession with Bottled Water. Washington, DC: Island Press; 2010.
25. Rosborg I. Drinking Water Minerals and Mineral Balance: Importance, Health Significance, Safety Precautions. New York: Springer; 2014.
26. Drinking Water Research Foundation. The Facts About Water. Available at: http://www.thefactsaboutwater.org/. Accessed November 27, 2016.
27. U.S. Environmental Protection Agency. Private Drinking Water Wells. Available at: https://www.epa.gov/privatewells. Accessed November 27, 2016.
28. International Bottled Water Association. Bottled Water. Available at: http://www.bottledwater.org/. Accessed November 27, 2016.
29. Center for Disease Control and Prevention. Public Water Systems. 2014. Available at:
http://www.cdc.gov/healthywater/drinking/public/index.html. Accessed November 27, 2016. 30. CDC Division of Oral Health. Fluoridation Growth Data Table. 2016. Available at:
31. U.S. Environmental Protection Agency. Drinking Water Regulations and Contaminants. 2017. Available at: https://www.epa.gov/dwregdev/drinking-water-regulations-and-contaminants#Secondary. Accessed April 10, 2018.
32. U.S. Department of Health & Human Services. HHS issues final recommendation for community water fluoridation. HHS.gov 2015. Available at: http://www.hhs.gov/about/news/2015/04/27/hhs-issues-final-recommendation-for-community-water-fluoridation.html. Accessed November 28, 2016. 33. OWASA. Orange Water and Sewer Authority. Available at:
http://owasa.org/bottled-water-comparison. Accessed November 25, 2016.
34. U.S. Department of Health and Human Services Federal Panel on Community Water Fluoridation. U.S. public health service recommendation for fluoride concentration in drinking water for the prevention of dental caries. Public Health Rep 2015;130(4):318-331. doi:10.1177/003335491513000408.
35. Bailey W, Barker L, Duchon K, Maas W. Populations Receiving Optimally Fluoridated Public Drinking Water --- United States, 1992--2006. MMWR Morb Mortal Wkly Rep 2008;57(27):737-41.
36. Center for Disease Control and Prevention. Water-related Diseases and Contaminants in Public Water Systems. Available at: http://www.cdc.gov/healthywater/drinking/public/water_diseases.html. Accessed November 27, 2016.
37. Beer KD, Gargano JW, Roberts VA, et al. Surveillance for Waterborne Disease Outbreaks Associated with Drinking Water — United States, 2011–2012. MMWR Morb Mortal Wkly Rep 2015;64(31):837-841.
38. Tiemann M. Lead in Flint, Michigan’s Drinking Water: Federal Regulatory Role. HEINONLINE 2016. Available at:
http://www.heinonline.org/HOL/Page?handle=hein.crs/crsmthabfny0001&id=1&size=2&collection=co ngrec&index=alpha/L_crs. Accessed November 22, 2016.
39. Newbrun E. Systemic Benefits of Fluoride and Fluoridation. J Public Health Dent 2004;64(s1):35-39. doi:10.1111/j.1752-7325.2004.tb02775.x.
40. Hellwig E, Lennon AM. Systemic versus topical fluoride. Caries Res 2004;38(3):258-262. doi:10.1159/000077764.
41. Rozier RG, Adair S, Graham F, et al. Evidence-based clinical recommendations on the prescription of dietary fluoride supplements for caries prevention: a report of the American Dental Association Council on Scientific Affairs. J Am Dent Assoc 2010;141(12):1480-1489.
42. Featherstone JD. The science and practice of caries prevention. J Am Dent Assoc 2000;131(7):887-899. 43. Office of Disease Prevention and Health Promotion. Oral Health, Healthy People 2020. Available at:
https://www.healthypeople.gov/2020/topics-objectives/topic/oral-health/objectives. Accessed November 27, 2016.
45. Dye BA, Li X, Beltran-Aguilar ED. Selected oral health indicators in the United States, 2005-2008. NCHS Data Brief 2012;(96):1-8.
46. Bhandari B, Newton JT, Bernabé E. Income inequality, disinvestment in health care and use of dental services. J Public Health Dent 2015;75(1):58-63. doi:10.1111/jphd.12071.
47. Hobson WL, Knochel ML, Byington CL, Young PC, Hoff CJ, Buchi KF. Bottled, filtered, and tap water use in Latino and non-Latino children. Arch Pediatr Adolesc Med 2007;161(5):457-461.
doi:10.1001/archpedi.161.5.457.
48. U.S. Environmental Protection Agency. Water Treatability Database. Available at:
https://iaspub.epa.gov/tdb/pages/treatment/treatmentOverview.do?treatmentProcessId=-1118142891. Accessed November 27, 2016.
49. Viscusi WK, Huber J, Bell J. The private rationality of bottled water drinking. Contemp Econ Policy 2015;33(3):450-467. doi:10.1111/coep.12088.
50. U.S. Department of Housing and Urban Development. American Housing Survey for the United States: 2011. United States Census Bureau 2013. Available at:
CHAPTER III: INTRODUCTION AND LITERATURE REVIEW
The prevalence of tooth decay in the United States has been on the decline since the 1960s, a phenomenon that has largely been attributed to the widespread use of dental sealants and fluoride,
including the introduction of community water (CW) fluoridation.1–4 Nonetheless, according to data from the 2011-2012 National Health and Nutrition Examination Survey (NHANES), the prevalence of dental caries (particularly untreated disease) remains persistently high among those of lower socioeconomic status and minorities who identify as Black or Hispanic/Latino (especially of Mexican origin).2 Specifically among children
and adolescents aged 2-19 years, Hispanics experience the highest rate and burden of dental caries.5 While minority status and numerous social determinants of health that accompany social disadvantage hinder families’ ability to seek and obtain preventive and restorative dental care services,6 fluoridated tap or
community water (CW) may be a healthy, safe, and cost-effective source of hydration and fluoride exposure that is underutilized among these disadvantaged population segments.
CW fluoridation has been named one of the ten great U.S. public health achievements of the twentieth century due to its contribution to the notable decline in dental caries in the U.S.7 Despite this national accolade, the consumption of bottled water (BW) in the U.S. has more than doubled in the last fifteen years.8 Interestingly, Mexico, the country of origin for the largest estimated group of immigrants in the U.S.,9 is also the world-leading country in per capita consumption of BW in 2016.10 BW consumption among Latino communities is frequently attributed to pervasive beliefs that CW is unsafe to drink due to its poor aesthetic qualities (e.g., taste, smell, color).11,12 Such perceptions and beliefs were thought to be likely ramifications of natural disasters and historical events which actually rendered the CW unsafe to drink for quite some time.13–18
packaging, and greater cost, various analyses and reviews comparing the two conclude that both water sources are extensively regulated and are deemed safe for consumption by their respective regulating agencies. CW is regulated by the U.S. Environmental Protection Agency (EPA) to meet the health-based standards of Safe Drinking Water Act (SDWA), while BW is regulated by the U.S. Food and Drug
Administration (FDA) to meet the standards of the Federal Food, Drug, and Cosmetic Act (FFDCA).20 The cost of CW (which includes the cost of water fluoridation) is generally significantly lower than that of BW. Moreover, fluoridated communities have historically exhibited dental expenditures, with benefit-cost ratios ranging from 1.12:1 to 135:1.24,25 It stands to reason that a disregard for the comparable safety of CW versus BW, as well as an unawareness of the benefits of CW fluoridation, can result in futile and excessive spending on a widely accessible and economical resource. Consumers of BW not only miss out on the cost-savings and dental health benefits of CW (both of which are important considerations for high-risk
communities subject to oral health disparities), but they also contribute to global environmental issues, such as fossil fuel depletion, greenhouse gas emissions, and the accumulation of waste in landfills.26
CHAPTER IV: METHODS
We employed a mixed-methods study design, involving a quantitative analysis of administrative (electronic health record) data and a qualitative study of Latino community members and key informants.
For the quantitative component (UNC IRB #17-0063), de-identified electronic patient record (EPR) data were extracted, including information on sex, age, insurance status (Medicaid or not), and residential zip codes for all patients between the ages of 0-17 who had at least one comprehensive or periodic dental examination (CDT codes: D0120, D0150, D0145) between 1/1/2002 and 12/31/2016 at any Pediatric
Dentistry clinic at the University of North Carolina at Chapel Hill (UNC) School of Dentistry (SoD), including the pre-doctoral, graduate, and dental faculty practice clinics. Additional data extracted included parental responses to two dental history questions: “Is there fluoride in your primary drinking water at home?” with possible responses being yes/no/don’t know, and “What type of water does your child drink most often?” with possible responses being city/well/bottled/other. Data from only the chronologically first visit for each patient were considered. We used descriptive and bivariate methods (X2, t, and non-parametric trend tests), as well as multivariable log-binomial regression modeling and marginal effect (percentage points, p.p.) estimation to estimate the prevalence, time trends, and correlates of drinking water type preferences using a conventional p<0.05 statistical significance criterion. Stata® (StataCorp LLC, College Station, TX) 15.1 software was used for all analyses.
informants were asked about their observations of Latino children’s water-drinking practices and their insight on what they deem would make effective messages and strategies for promoting CW consumption among Latino families. Pilot interviews were conducted with one community member and one key informant, and the interview guides was further iteratively revised during the course of the interviews. Participants were
given a $20 gift card following their interview as compensation for their time. Interviews lasted anywhere between 20-45 minutes and were all conducted by the same investigator (first author), audio-recorded,
transcribed verbatim, coded, and analyzed using Sandelowski’s qualitative description framework using
CHAPTER V: RESULTS
Quantitative Component
The quantitative aspect of the investigation included a total of 3,860 participants. Thirty-seven percent of them reported consuming CW most frequently, followed by missing/other responses (30%), BW (21%), and well water (12%) (Figure 1). There was a significant increase in BW consumption over time during the 15-year study period among those without missing/other responses (non-parametric trend test, p<0.05); the proportion more than doubled from 17% in 2004 to 42% in 2016 (Figure 2). Additionally, “don’t know” responses to the question, “Is there fluoride in your primary drinking water at home?” more than tripled from 8% in 2004 to 25% in 2016 (Figure 3; p<0.05). The demographic information of the pediatric patients whose parents reported consuming BW or CW (excluding missing/other responses; n=2,456) are presented in
Table 1. About half of patients were between the ages of 6-12, two-thirds did not have Medicaid, and 85%
Bottled 21% City 37% Well 12% Missing/Other 30%
Figure 1. Distribution of responses to "What type of water does your child drink most often?" among all patients presenting to the UNC Pediatric Dentistry clinics for routine
visits between 2002 and 2016
26%
17%
22% 22% 22%
29%
26% 25% 25%
30% 25%
30% 32%
42% 0% 5% 10% 15% 20% 25% 30% 35% 40% 45%
2002-3 2004 2005 2006 2007 2008 2009 2010 2011 2012 2013 2014 2015 2016
Figure 2. Proportion of bottled water consumption as primary water source (v. city and well) among all patients presenting to the UNC Pediatric Dentistry clinics for routine visits between 2002 and 2016 (excludes missing and reported “other” water source)
% Co ns um in g BW Year
Table 1. Demographic information and water preference (CW v. BW, exclusively) recorded at the first visit of patients presenting to the UNC Pediatric Dentistry clinics between 2002 and 2016, excluding missing and “other” responses
n (column %) Total n (row %) CW n (row %) BW P-value Total Sample 2,456 (100) 1,635 (67) 819 (33)
Sex
Male 1,220 (50) 844 (69) 376 (31) 0.008
Female 1,234 (50) 791 (64) 443 (36) Medicaid
Yes 755 (31) 354 (47) 401 (53) <0.0005 No 1,699 (69) 1,281 (75) 418 (25)
Age Group (by years)
Infants/Toddlers (0-2) 491 (20) 335 (68) 156 (32) 0.02 Preschool (3-5) 683 (28) 473 (69) 210 (31)
Grade School (6-12) 1,179 (48) 772 (65) 407 (35) Adolescents (13-16) 101 (4) 55 (54) 46 (46) Residence
Urban 995 (41) 693 (70) 302 (30) <0.0005 Suburban 1,082 (45) 730 (67) 352 (33)
Rural 345 (14) 185 (54) 160 (46)
2%
8% 8% 10%
12%
17% 17% 13% 17% 24% 19% 26% 20% 25% 0% 5% 10% 15% 20% 25% 30%
2002-3 2004 2005 2006 2007 2008 2009 2010 2011 2012 2013 2014 2015 2016
Figure 3. Proportion of ”don’t know” responses to the question, “Is there fluoride in your primary drinking water at home?” among all patients presenting to the UNC
Pediatric Dentistry clinics for routine visits between 2002 and 2016
% “D on ’t Kn ow ” R es po ns es Year
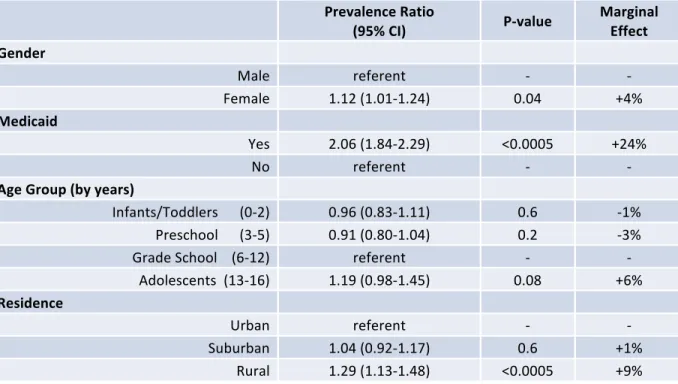
Table 2. Results of multivariable log-binomial regression of BW preference (over CW) recorded at the first visit of patients presenting to the UNC Pediatric Dentistry clinics on sociodemographic characteristics, between 2002 and 2016, excluding those who responded “other” and those with missing information
Prevalence Ratio
(95% CI) P-value
Marginal Effect Gender
Male referent - -
Female 1.12 (1.01-1.24) 0.04 +4%
Medicaid
Yes 2.06 (1.84-2.29) <0.0005 +24%
No referent - -
Age Group (by years)
Infants/Toddlers (0-2) 0.96 (0.83-1.11) 0.6 -1% Preschool (3-5) 0.91 (0.80-1.04) 0.2 -3%
Grade School (6-12) referent - -
Adolescents (13-16) 1.19 (0.98-1.45) 0.08 +6% Residence
Urban referent - -
Suburban 1.04 (0.92-1.17) 0.6 +1%
Rural 1.29 (1.13-1.48) <0.0005 +9%
Qualitative Component
We interviewed 10 community members and 5 key informants between September and November 2017. Recurring themes emerging from the interviews were organized into the following five domains: (1) characteristics of CW, (2) misconceptions and lack of knowledge about CW, (3) ingrained culture/upbringing that devalued CW consumption, (4) reasons for drinking CW, and (5) ideas for an intervention to effectively promote CW consumption among Latino communities.
Characteristics of CW
“The water wasn’t clear in the cup, and in the clear cup you would see it kind of yellowish-orange. It wasn’t clear.”
“My kids, my son does not like the flavor in it, the chlorine flavor, and so he would spit it back out and I’d have to give him the bottled.”
“To brush our teeth, you could sometimes smell, the water smelled weird, when you turned on the water.”
“People they say they have community water, you know, they say also it’s not too good because they say it smells like a lot of, you know, chloro.”
Misconceptions and lack of knowledge about CW
Other common reasons for parents discouraging their children from drinking CW were their mistrust regarding the sanitation process of public water, their unawareness of fluoride in their CW, or their lack of knowledge about the dental health benefits of fluoridated CW. Respondents were forthright in voicing their concerns and lack of knowledge:
“Well, one of my questions about the water… They clean out the water and they make to run again to the community’s house. They go somewhere on the faucet and they clean and they make to run again for the community houses… I would like to know more about that. I don’t know how they clean, how they… if it’s good to drink again or not because I don’t understand [how] people do that.”
“I think people just automatically think that [bottled water] is purified, and cleaned, and different from tap water. They probably feel like tap water comes from underground and is just coming not really cleaned [with] all the nasties out of it, you know.”
Interviewer: “Community water fluoridation is when they add a little bit of fluoride to the water. And do you know what the purpose of that might be?”
Interviewee: “Not really, I guess to clean it? I’m not sure.”
“We use reverse osmosis water because the fluoride is… Yeah I know for science, fluoride is good for your teeth. That’s what they say. But the fluoride that came from earth is good for your teeth. Not the fluoride they add as a chemical… it is not good for your brain.”
Ingrained culture/upbringing that devalued CW consumption
“We were both born outside the U.S., and in our hometown, the tap water is not particularly clean. Sometimes it stinks, sometimes you can see how it gets dirt in it, so [my wife] has in her mind the idea that tap water is very bad for you. It’s dirty and you shouldn’t drink it. So that’s why she goes and gets bottled water.”
“Well, just in our community in general, I think that the Hispanic community tends to think that… We come from a place where water, tap water, is not good, and you’re told you shouldn’t drink it. I think some of those beliefs come with people when they move here and then they still think that tap water is bad so they have to drink bottled water or buy gallon water. I think it’s just a cultural thing.”
“Like I will say, honestly, it was shock for me. I mean, I was a child, but I remember that it was like odd that I could drink from the tap [here]. I mean that just seemed so revolutionary because it was very clear to me, it was like very ingrained when I was growing up that of course you can’t drink the water from the tap, and so you just know that. And it takes a while to realize that it is okay.”
“Growing up, there was always Coca-Cola like in… in the dinner table. So it was mostly based on sugary drinks. In my family, we have you know, Kool-Aid, the typical fruit flavored drinks. And pretty traditional things coming from the culture that we’re from. A lot of hibiscus water or horchata water. It was like a rice-flour based drink.”
“…you go to somebody’s house in a rural area, what they will offer you, which is like a treat, is a soda instead of water. Like who would want to drink water when you have access to something that’s fancier? And I feel like that has stuck around a little bit, it’s like a sign of celebration, it’s something positive, it’s a reward.”
Reasons for consuming CW
While the majority of interview participants reported drinking primarily or exclusively BW, a few did not, and supported CW consumption:
“For me, tap water is better for the reasons I gave. You don’t have to pay for it. You avoid polluting with plastic bottles… I know that there is a risk, that there are probably things that we don’t know about the water from the tap. But I trust the [water sanitation] company…”
“We use the… the container that has the filter inside it. We have the Brita… During the summer, I do the water from the fridge. And I think that there’s a filter there.”
“We use tap water because in my mind, [when] you boil the water, you’re purifying it. So I just feel like it’s getting the chemicals out when you’re boiling hot water.”
Ideas for an effective intervention promoting CW
messages appealing to both parents and children when promoting CW, and having this information delivered in Spanish by community and health professionals in interactive settings where transportation is not a barrier. Some also suggested discussing the cost-savings benefits of switching from BW to CW:
“It seems more beneficial doing like a community outreach type approach. Like meeting the families, like if there’s a gathering in their neighborhood, or the common area, or a church, or a community center, something like that, where transportation is not a barrier. And also making it known and well-advertised that it will be delivered, the information will be given, in their native language.”
“…having folks at festivals... having an opportunity where people can talk to somebody [who] can explain why [drinking tap water is] important and share information and provide goodies.”
“[Messages like] ‘Look, it’s safe. It’s clean. It’s fluoride. It prevents cavities.’”
“A Spanish-speaking dentist, assistant, just somebody that maybe… The ideal person would probably be the person working in that field. They’re studying it.”
“How do you engage the entire family, and then the other part of how do you make sure that you are connecting this thing about drinking water as being cool... Whatever is cool is what kids will do, so trying to figure out how do you get perhaps teenage bands that are cool to say that drinking regular [tap] water is good for your teeth.”
“Nonprofits that have a strong family base.”
“Definitely the Internet, but I would look like in an organization [for] anything with like a factual website that I can actually get the correct information…”
“…more pictures. More slides… so they can actually see what the differences of teeth of somebody that just drinks bottled water and then somebody that drinks tap water over their life.”
“…if you somehow can get a professional on the radio station and you promote this space, 30-minute space or whatever, and ask the audience to call in with some questions… I think you will dissipate a lot of misunderstandings, misinformation, or whatever.”
“…you grab a newspaper and it’s free… On those newspapers, they’re advertising for dentists and doctors and whatnot and lawyers, but also have topics about immigration and things like that… so I think people, parents with young children, or all kinds of children, are more likely to be receptive from newspaper than from the radio.”
“Perhaps showing specific savings. Like, ‘so there’s a family of four and this is how much they spend a week on bottled water. If they only switched, this is how much they would save, and this is the impact that it would have on the kids’ teeth because of the fluoride.’”
CHAPTER VI: DISCUSSION
Previous evidence indicates a growing popularity in BW consumption in the U.S. over the last fifteen years; the findings from our mixed-methods study support this notion. In the quantitative component of the study, we found that a growing number of individuals were unaware of the presence or absence of fluoride in their drinking water and that individuals of lower socioeconomic status (i.e., those who experience the greatest caries burden and could most benefit from fluoridated CW) were the least likely to consume and experience the dental health benefits of CW. Essentially, families experiencing the greatest financial burden may be going out of their way to purchase BW and are missing out on the cost-savings benefit of consuming affordable and widely accessible CW. This growing popularity of BW can easily be seen as a dental public health concern since previous research has shown that most BWs do not contain the optimal 0.7ppm level of fluoride recommended by the U.S. Public Health Service for dental caries prevention.27 In fact, some BWs have even been shown to be slightly acidic, nearly reaching the critical pH of dentin (6.5) and enamel (5.5), which can have negative implications for tooth erosion.28 In sum, a growing number of people are practicing futile spending on BW, which may actually have more negative than positive impacts on their dental health.
The insights gained by the qualitative component of the study highlighted that Latino families avoid drinking fluoridated CW due to its unpleasant aesthetic features, misconceptions regarding its safety,
The study participants provided valuable insights into this BW drinking phenomenon and several ideas for how to best promote a healthy behavioral shift from BW to fluoridated CW consumption. As various strategies and messages were suggested on how to best educate NC Latino families on the benefits of CW, it appears that a multi-faceted approach involving various experts (e.g., health, dental, water treatment professionals) using different forms of delivery (e.g., interactions with health care providers, fliers, news segments) in a number of settings (e.g., Latino health fairs, dental visits, school functions) in a language Latino families can understand (i.e., Spanish) is key to promoting successful behavioral change. Effective interventions need to be informative, culturally sensitive, and interactive, and efforts to promote CW consumption should involve not only that of health professionals, but also that of other community stakeholders (e.g., school teachers). Furthermore, public settings in which students and children frequent (e.g., schools, daycares, libraries) ought to be conducive for easy access to CW among schoolchildren. Limitations and Strengths
While we were able to obtain a sizeable sample size of electronic health record data in the
CHAPTER VII: CONCLUSION
APPENDIX 2: INTERVIEW GUIDE (FOR COMMUNITY MEMBERS)
Community Member Interview Guide
(e.g., English-speaking Hispanic/Latino parents of young children in NC) IRB Study: 16-2716
1. First, I’d like to know a little bit about you. How long have you been living in NC? 2. Do you have any children? If so, how old are they?
3. I am interested in information about their teeth and dental health. Can you tell me about [his/her/their] dental health and any experience with cavities?
a. [If they’ve had cavities] What are some reasons you think they’ve had cavities?
b. [If they’ve had no cavities] What are some reasons you think they’ve never had a cavity? 4. Tell me about what they [each] drink throughout the day, both at home and at school.
a. [If they drink juices/sodas] What types of juices/sodas do they drink? i. Do they drink water?
b. [If water] What kind of water? Bottled/filtered/community? i. What are the reasons they drink that water? 5. What drink do YOU mostly drink throughout the day?
a. [If they drink tea/coffee] What kind of water do you use to make your tea/coffee? b. [If not water…] Do you drink much water? Where do you get the water that you drink? 6. When you go grocery shopping, what type of drinks do you buy?
a. How do you decide which drinks to buy?
b. [If water is not mentioned…] How often do you buy bottled water and how much? 7. Do you know of anyone who avoids drinking community water or drinks only bottled water?
Tell me about it.
8. What do you know about community (tap) water? a. Does your family ever drink community water?
b. What are the reasons that prevent you from drinking it? c. How do you use it?
9. [If CWF not mentioned] Have you ever heard of community water fluoridation? a. [If yes…] What do you know about it?
b. [If no…] It is a process where small amounts of a mineral called fluoride is added to the water to help protect your teeth against cavities. Do you know if your tap water has fluoride in it?
i. [If no…] Now that you know what CWF is, what do you think about drinking tap water?
10. Can you describe a time when the tap water was obviously not safe to drink? Please explain. 11. How concerned are you about pipes and plumbing affecting the quality of the water?
12. If you wanted to get more information about what type of water or drink is best for you and your children, where would you look?
a. [If internet] Where would you look online for this information? What kinds of websites would you search?
b. [If TV/radio/magazine/newspaper] Which network/station/magazine/newspaper? Why? c. [If people] Why would you talk to them?
13. Is there something else you think I should know regarding this topic? 14. Do you have any final comments or thoughts you’d like to mention?
APPENDIX 3: INTERVIEW GUIDE (FOR KEY INFORMANTS)
Key Informant Interview Guide
(e.g., English-speaking Hispanic/Latino healthcare providers, ESL school teachers, Latino social advocacy group leaders, etc.)
IRB Study: 16-2716
1. First, I’d like to know a little bit about you. How long have you been living in NC? 2. In what capacity do you interact with Hispanic/Latino families in this NC community? 3. How familiar are you with oral health-related issues in Latino/Hispanic communities?
a. What do you know about the oral health of the Hispanic/Latino families in this community? b. Have you noticed dental diseases (like tooth decay, tooth loss, fillings/crowns, or gum
disease) more frequently among Latino individuals than among non-Latinos? i. [If yes] What factors do you think might contribute to these differences? 4. As far as you’re aware, are there any cultural practices you’ve noticed related to diet, eating and
drinking that are specific to Hispanic/Latino communities? Tell me about them.
5. What kinds of drinks/beverages are popular or frequently consumed by Hispanic/Latino children? a. What do you think are the reasons behind that?
i. [If bottled water…] Do they ever drink community water? ii. [If CW…] Do they ever drink bottled water?
iii. [If water is not popular…] Do you think they should drink more water?
1. [If yes…] Any particular type of water? Tap, filtered, bottled, other, or does it not matter? Why/why not?
6. What kind of relationship might there be, if any, between how long one’s been living in the U.S., where they live, and what they drink?
7. What do you know about tap, filtered, and bottled water?
8. What do you know about community water fluoridation, or fluoride in the community water? a. [If knowledgeable about and pro-CWF…] Do you think if children can switch from drinking
SSB/bottled water to fluoridated community water, they might be able to prevent or at least lower their risk of significant dental problems later on?
i. [If yes…] Then how do you think we can promote drinking community/tap water specifically among these communities? What might an effective campaign look like?
1. What kind of messages would be most effective in encouraging people to drink more fluoridated community water?
2. What would be the best way to deliver these public health messages? a. [If newspapers/magazines/TV/radio…] Any specific ones? 3. Who might the community trust to deliver these public health messages?
Who might have the most influence?
ii. [If no…] Can you elaborate on that? Then for Hispanic children without access to regular dental care, what is the best way for them to prevent cavities and maintain good oral health?
b. [If not knowledgeable about or anti-CWF] So you stated that most people in the Hispanic/Latino community drink bottled water. Do you think they’ll ever switch to tap?
i. [If not…] What do you think must happen for them to start drinking community water?
9. Do you have any comments or thoughts you would like to add on this topic of drinking water?
APPENDIX 4: INTERVIEW RECRUIMENT/VERBAL CONSENT SCRIPT IRB Study: 16-2716
Hello,
This is Yuri Oh, calling from the UNC School of Dentistry. I’m was referred to you by ______________ because you qualify to participate in our research study on drinking water habits. We are currently conducting phone interviews to better understand what non-alcoholic beverages families in the NC Hispanic/Latino community primarily drink and why, and we would like your participation! The interview will take about 20-30 minutes, and you will be mailed a $20 Walmart gift card afterwards to thank you for your time. Would you be willing to participate in our study?
è [If no] Ok then. Thank you for your consideration. Have a great day!
è [If yes] Great! Your responses will be audio-recorded, so we ask for 20-30 minutes uninterrupted time without background noise. Is right now a good time for us to conduct your interview?
è [If no] Ok, then when would be a good time to conduct your interview?
è [If yes] For confidentiality reasons, you are asked to avoid using any names in your responses. Do you have any questions before we begin?
è [If no] Ok, here we go!
REFERENCES
1. White BA, Caplan DJ, Weintraub JA. A quarter century of changes in oral health in the United States. J Dent Educ 1995;59(1):19-57.
2. Health, United States, 2015, With Special Feature on Racial and Ethnic Health Disparities. 2016. 3. Health, United States, 2009 with Special Feature on Medical Technology. 2010:563.
4. Achievements in Public Health, 1900-1999: Fluoridation of Drinking Water to Prevent Dental Caries. MMWR Morb Mortal Wkly Rep 1999;48(41):933-40.
5. Dye BA, Thornton-Evans G, Li X, Iafolla TJ. Dental caries and sealant prevalence in children and adolescents in the United States, 2011-2012. NCHS Data Brief 2015;(191):1-8.
6. Guarnizo-Herreño CC, Wehby GL. Explaining racial/ethnic disparities in children’s dental health: a decomposition analysis. Am J Public Health 2012;102(5):859-866. doi:10.2105/AJPH.2011.300548. 7. Centers for Disease Control and Prevention (CDC). Ten great public health achievements--United
States, 1900-1999. MMWR Morb Mortal Wkly Rep 1999;48(12):241-243.
8. Beverage Marketing Corporation; International Bottled Water Association. Per capita consumption of bottled water in the United States from 1999 to 2016 (in gallons). Statista 2018. Available at:
https://www.statista.com/statistics/183377/per-capita-consumption-of-bottled-water-in-the-us-since-1999/. Accessed April 10, 2018.
9. Pew Research Center. Sources of Immigration to the U.S., by Era. Pew Research Center Hispanic Trends 2015. Available at: http://www.pewhispanic.org/2015/09/28/modern-immigration-wave-brings-59- million-to-u-s-driving-population-growth-and-change-through-2065/ph_2015-09-28_immigration-through-2065-06/. Accessed November 29, 2016.
10. Beverage Marketing Corporation; International Bottled Water Association. Per capita consumption of bottled water worldwide in 2016, by leading countries (in gallons). Statista 2018. Available at: https://www.statista.com/statistics/183388/per-capita-consumption-of-bottled-water-worldwide-in-2009/. Accessed April 9, 2018.
11. Huerta-Saenz L, Irigoyen M, Benavides J, Mendoza M. Tap or bottled water: drinking preferences among urban minority children and adolescents. J Community Health 2012;37(1):54-58.
doi:10.1007/s10900-011-9415-1.
12. Scherzer T, Barker JC, Pollick H, Weintraub JA. Water consumption beliefs and practices in a rural Latino community: implications for fluoridation. J Public Health Dent 2010;70(4):337-343. doi:10.1111/j.1752-7325.2010.00193.x.
14. Gonzales R, Chappell B. Mexico City Earthquake Update: All Children Are Accounted For. NPR 2017. Available at:
http://www.npr.org/sections/thetwo-way/2017/09/21/552574762/mexico-city-earthquake-update-desperate-attempts-to-reach-girl-trapped-by-rubble. Accessed October 25, 2017. 15. Guzmán N, Zeballos JL, Poncelet JL. Disaster Chronicles No. 3: Earthquake in Mexico, September 19 and
20, 1985. PAHO 1985.
16. Soberón G, Frenk J, Sepúlveda J. The health care reform in Mexico: before and after the 1985 earthquakes. Am J Public Health 1986;76(6):673-680. doi:10.2105/AJPH.76.6.673.
17. Espinosa-García AC, Díaz-Ávalos C, González-Villarreal FJ, Val-Segura R, Malvaez-Orozco V, Mazari-Hiriart M. Drinking water quality in a Mexico city university community: perception and preferences. Ecohealth 2015;12(1):88-97. doi:10.1007/s10393-014-0978-z.
18. Sepúlveda J, Valdespino JL, García-García L. Cholera in Mexico: the paradoxical benefits of the last pandemic. Int J Infect Dis 2006;10(1):4-13. doi:10.1016/j.ijid.2005.05.005.
19. Edberg SC. Review Paper: Microbial Health Risks of Regulated Drinking Waters in the United States. 2013.
20. Hirst RR. Bottled Water and Tap Water: Just the Facts. Drinking Water 2011. 21. Bullers AC. Bottled Water: Better Than the Tap? FDA Consum 2002;36(4).
22. Navarro KE. Safety and Secrecy of Bottled Water. Hauppauge, N.Y: Nova Science Publisher’s; 2010. 23. Erythropel HC, Maric M, Nicell JA, Leask RL, Yargeau V. Leaching of the plasticizer
di(2-ethylhexyl)phthalate (DEHP) from plastic containers and the question of human exposure. Appl Microbiol Biotechnol 2014;98(24):9967-9981. doi:10.1007/s00253-014-6183-8.
24. Griffin SO, Jones K, Tomar SL. An economic evaluation of community water fluoridation. J Public Health Dent 2001;61(2):78-86. doi:10.1111/j.1752-7325.2001.tb03370.x.
25. Ran T, Chattopadhyay SK, Community Preventive Services Task Force. Economic evaluation of community water fluoridation: A community guide systematic review. Am J Prev Med 2016;50(6):790-796. doi:10.1016/j.amepre.2015.10.014.
26. Gleick PH. Bottled and Sold: The Story behind Our Obsession with Bottled Water. Washington, DC: Island Press; 2010.
27. Johnson SA. Concentration Levels of Fluoride in Bottled Drinking Water. Journal of Dental Hygiene 2003;77(3):161-7.