CUMULATIVE LACTATION AND METABOLIC DISEASE IN AFRICAN AMERICAN WOMEN
Ellen M. Chetwynd
A dissertation submitted to the faculty at the University of North Carolina at Chapel Hill in partial fulfillment of the requirements for the degree of Doctor of Philosophy in the
Department of Maternal and Child Health.
Chapel Hill 2016
ABSTRACT
Ellen M. Chetwynd: Cumulative Lactation and Metabolic Disease in African American Women (Under the direction of Alison Stuebe)
Current literature suggests that breastfeeding duration is inversely associated with maternal metabolic diseases such as diabetes and hypertension. These conditions
disproportionately impact black women in the United States, yet breastfeeding prevalence is lower for black women.
We used the Black Women’s Health Study (n = 59,001) to quantify the association between breastfeeding and hypertension (Aim 1) and type 2 diabetes (T2D) (Aim 2). We introduce the use of a nested case control design to reduce selection and survival bias.
Specifically, we used density sampling, frequency matching controls to cases by questionnaire cycle and risk sets for age. Effect measure modification analyses were performed using
likelihood ratio testing for age, parity, and body mass index at age 18.
from the null than previous studies using Cox proportional hazard models, suggesting a reduction in selection bias. They are also closer to the null than previous studies using cross-sectional or retrospective models, suggesting a reduction in survival bias.
Our results extend the existing research by providing outcomes in a high priority group of women previously under-represented, as well as introducing methodology to this area of research that has the potential to reduce bias in future studies on breastfeeding and metabolic health. Our outcomes support the need for inclusive messaging in public health and medical care
To my husband, Marcus Herman-Giddens, for his endless support, companionship and experience; my children, parents, brother, nieces, nephews, in-laws and friends for sticking by
me when time was short; for my colleagues at the Women’s Birth and Wellness Center who believed with me that it was possible to provide support to mothers while completing this
academic undertaking; and for my mentors and friends within UNC and other academic institutions, who appreciate the art of a well done table or figure, and were always willing to talk
ACKNOWLEDGEMENTS
I am deeply grateful to the members of my dissertation committee – Alison Stuebe (Chair), Melissa Troester (Minor Chair), Julie Palmer (Slone Epidemiology), Diane Rowley, Miriam Labbok, and Carolyn Halpern – for their guidance, advice, and time. Specifically, I offer gratitude to Dr. Alison Stuebe for years of guidance, mentorship and friendship that went far beyond working together on this and other projects; Dr. Melissa Troester for helping me think through some of the more complex methodological challenges; and to both Alison and Melissa for fielding questions, even when they came at inconvenient times; Dr. Julie Palmer, for being open to sharing the data available through the Black Women’s Health Study, and mentoring me through the process from paper to publication; Dr. Diane Rowley for her insight into how to harness epidemiologic data into salient public health messages; Dr. Miriam Labbok for her boundless knowledge about all things breastfeeding; and Dr. Carolyn Halpern who stepped in at the last minute with salient critiques as well as being pivotal in helping me complete my research in a timely manner.
Finally, I would like to acknowledge Carrie Aldridge for her support in working through the mechanics of completing this project; Marcus Herman-Giddens, who, as well as being a fabulous spouse, also has a deep knowledge of SAS programming, and was always willing to sitdown and sort through the tangles with me; and Slone Epidemiology’s Jeffrey Yu for his orientation to the Black Women’s Health Study during a lovely week in Boston, and his ongoing advice and advice about the dataset.
TABLE OF CONTENTS
LIST OF TABLES ... xi
LIST OF FIGURES ... xii
LIST OF ABBREVIATIONS ... xiii
INTRODUCTION ... 1
CHAPTER 1: LITERATURE REVIEW ... 3
1.1 Hypertension ... 3
1.2 Type 2 Diabetes ... 4
1.3 Breastfeeding ... 4
1.4 Breastfeeding Research ... 7
1.5 Pregnancy, Breastfeeding, and the Reset Hypothesis ... 14
1.6 Obesity ... 15
1.7 Age ... 16
1.8 Knowledge Gaps ... 16
1.9 Significance ... 18
1.10 Specific Aims ... 18
CHAPTER 2: APPROACH ... 20
2.2 Analytic Sample ... 20
2.3 Exposure Assessment ... 25
2.4 Outcome Assessment ... 27
2.5 Covariate Assessment ... 28
2.6 Data Analysis ... 35
2.7 Tables and Figures ... 38
CHAPTER 3. CUMULATIVE LACTATION AND MIDDLE AGED ONSET OF HYPERTENSION IN AFRICAN AMERICAN WOMEN ... 44
3.1 Introduction ... 44
3.2 Methods ... 45
3.3 Results ... 50
3.4 Discussion ... 51
3.5 Tables and Figures ... 55
CHAPTER 4: CUMULATIVE LACTATION AND MIDDLE AGED ONSET OF TYPE 2 DIABETES IN AFRICAN AMERICAN WOMEN... 61
4.1 Introduction ... 61
4.2 Methods ... 62
4.3 Results ... 69
4.4 Discussion ... 71
4.5 Tables and Figures ... 76
CHAPTER 5: CONCLUSIONS ... 82
5.2 Summary of Findings ... 86
5.3 Strengths and Limitations ... 98
5.4 Future Research ... 100
5.5 Tables and Figures ... 102
APPENDIX ... 107
LIST OF TABLES
Table 2.1 Final adjustment set for Aim 1 and Aim 2 ... 43
Table3.1 Demographic characteristics by months of lifetime lactation
in the control population ... 55
Table 3.2 Odds Ratios for hypertension by duration of cumulative
lactation. ... 57
Table3.3 Odds ratios for hypertension by duration of cumulative
lactation stratified by adult onset of obesity attained at age 40 ... 60
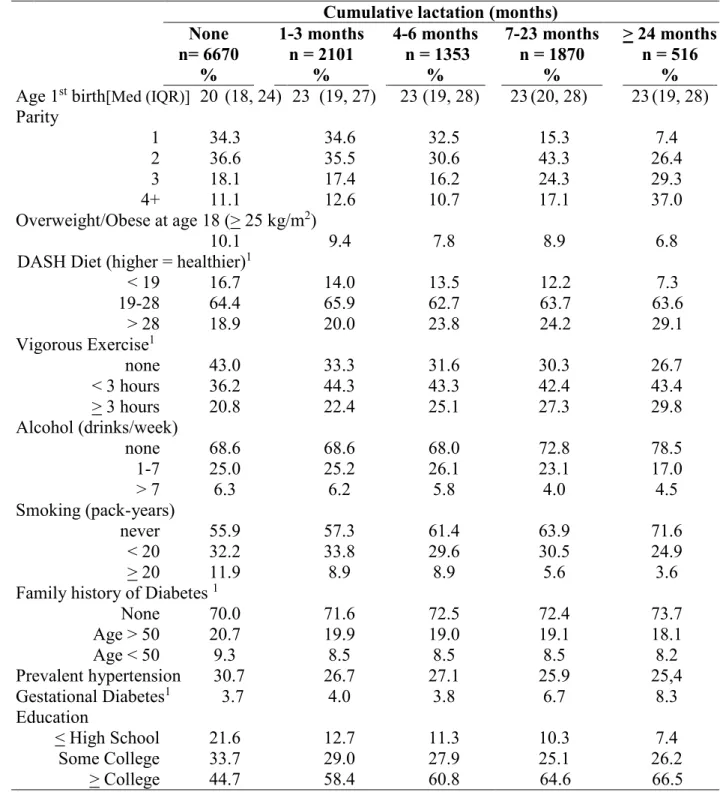
Table4.1 Demographic characteristics among the control population
by duration of cumulative lifetime lactation ... 76
Table4.2 Odds ratios for type 2 diabetes by duration of cumulative
lactation for crude and multivariate models. ... 77
Table4.3 The association between type 2 diabetes and cumulative lactation among women who gave birth prior to 1995. Comparison of ‘Failed Lactation’ (tried but couldn’t breastfeed, or breastfed for < 1
month) to women who reported planned formula feeding ... 81
Table5.1 Odds ratios for type 2 diabetes by duration of cumulative
lactation for crude and multivariate models ... 102
Table5.2 Effect measure modification of the association between breastfeeding and type 2 diabetes by hypertension, present at the time
of onset of T2D or control selection ... 104
Table5.3 A comparison of the hazard ratios (HR) and 95% confidence interval (CI) from the Nurse’s Health Study (NHS) to the odds ratios (OR) and 95% confidence intervals from the Black Women’s Health Study (BWHS) for the relationship between months of breastfeeding and type 2 diabetes (T2D). Referent category for both studies is
formula feeding... 105
Table5.4 A comparison of the odds ratios (OR) and 95% confidence interval (CI) from the 45 and Up Study with the OR and 95% CI from the Black Women’s Health Study (BWHS) for the relationship
LIST OF FIGURES
Figure 2.1 Analytic sample parameters illustrating prospective and
retrospective ascertainment of cumulative lactation and disease onset. ... 38
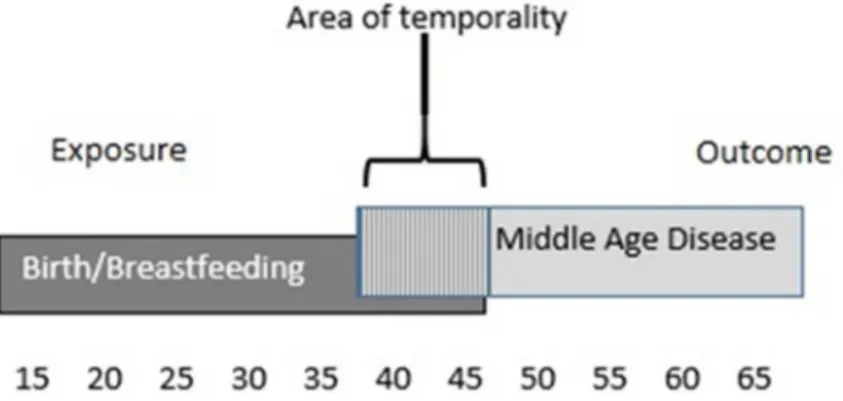
Figure 2.2 Potential area of temporality in which sequencing of exposure
and middle aged disease might cause error... 38
Figure 2.3 Prevalence of hypertension and type 2 diabetes for women in
the United States. ... 39
Figure 2.4 Risk of metabolic disease for women over the life course. ... 40
Figure 2.5 Prevalence of any breastfeeding for the women in the Black Women’s Health Study compared to breastfeeding rates in the general US
population. ... 41
Figure 2.6 Internal validity of cumulative lactation among women in the
Black Women’s Health Study who gave birth prior to 1995.. ... 42
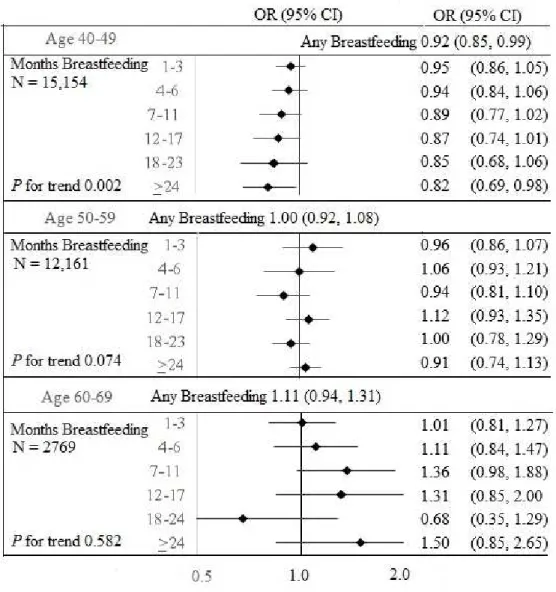
Figure 3. 1 The association between hypertension and cumulative lactation compared to no breastfeeding among datasets restricted to age
epochs (40-49, 50-59, and 60-65). ... 58
Figure 3. 2 The association between hypertension at ages 40-65 and
cumulative lactation compared to no breastfeeding, stratified by parity. ... 59
Figure 4. 1 The association between type 2 diabetes and cumulative lactation compared to no breastfeeding among datasets restricted to age
epochs (40-49, 50-59, and 60-65).. ... 78
Figure 4. 2 The association between type 2 diabetes at ages 40-65 and
cumulative lactation compared to no breastfeeding stratified by parity.. ... 79
Figure 4. 3 The association between type 2 diabetes and cumulative lactation, compared to no breastfeeding by categories of BMI: normal (<
25 kilograms/meter2 ); overweight/obese (> 25 kilograms/meter2 ). ... 80 Figure 5. 1 The association between type 2 diabetes and cumulative
LIST OF ABBREVIATIONS
BWHS Black Women’s Health Study
CI Confidence Interval
Hg Mercury
HR Hazard Ratio
mPINC Maternity Practices in Infant Nutrition and Care
NH Non-Hispanic
NHANES National Health and Nutrition Examination Study NHS Nurse’s Health Study
OR Odds Ratio
PRAMS Pregnancy Risk Assessment Monitoring System PROBIT Promotion of Breastfeeding Intervention Trial
T2D Type 2 diabetes
INTRODUCTION
Lactation: it’s foundational to our status as mammals; yet, it is also profoundly affected by cultural trends. During reproductive years, many women weigh the convenience of formula feeding against the health benefits of breastfeeding. Since its nadir in the United States (US) in the 1970s, the rates of breastfeeding have been steadily increasing, as has research on its benefits. While breastfeeding’s health benefits are still debated in the popular literature, within the scientific community, there is broad recognition that breastfeeding is the healthiest choice for women and children, and that differential health outcomes for women who have breastfed persist for many years after weaning has occurred (1-3). As such, breastfeeding is an important health behavior that can influence progress towards equalizing health disparities across racial, social and cultural barriers. For breastfeeding to have a positive impact on the health of mothers and children, it needs to be implemented for only a short term period of time, making it a compelling tool in addressing health inequities for public health professionals.
Black women have higher rates of both hypertension and type 2 diabetes (T2D) and lower rates of breastfeeding than the general population in the US. This dissertation assesses the relationship between cumulative lifetime lactation and both hypertension and type 2 diabetes within the Black Women’s Health Study, a cohort of 59,001 black women established in 1995. It utilizes a two paper format. Aim 1 estimates the association between breastfeeding and
CHAPTER 1: LITERATURE REVIEW
1.1 Hypertension
Blood pressure, or the pressure of the blood against the walls of the arteries, is a measure of the force of the heartbeat and the diameter and elasticity of the arterial walls. High blood pressure develops with age as the circulatory system loses elasticity; however, it can also be an indication that the heart is working too hard, increasing the risk of cardiovascular disease. High pressure is diagnosed when systolic blood pressure is ≥ 140 mm Hg (mercury) and diastolic blood pressure is ≥ 90 mm Hg.(4) It is a major treatable contributor to cardiovascular disease, which is the leading cause of death in the United States (5, 6). Hypertension affects nearly one in every three adults (28.6%); (7) however, among adults with hypertension, almost one in five (18.1%) do not know they have the condition, and only 53.3% are able to reach effective levels of control (5).
Black women have a higher age adjusted prevalence of hypertension (45.7%) than black men (43.0%) or white women (28.9%) (8). While treatment levels for hypertension are
1.2 Type 2 Diabetes
Type 2 diabetes (T2D) accounts for 95% of diabetic disease in the US. It typically begins when the cells of the muscles, liver and fat lose their ability to respond to insulin effectively. As the need for insulin increases, the beta cells in the pancreas become unable to keep up with demand. This eventually leads to high blood glucose levels. Diagnosis of T2D is accomplished by a measurement of glucose or glycohemoglobin in the blood(11). In the US, 29.1 million, or 8.4% of adults have diabetes. Like hypertension, diabetes is more prevalent in black women (9.9%) than in black men (9.2%) or white women (5.3%) (12). Black women with diabetes experience delayed recognition, less effective treatment, and greater morbidity and mortality from the disease than white women (13-15). NH black adults with diabetes are 1.5 times more likely to be hospitalized, and 2.3 times more likely to die from diabetes than their NH white counterparts (16).
1.3 Breastfeeding
Breastfeeding, in its simplest form, is the nourishment of a human infant or child at the breast. Human milk provides all the essential calories, minerals, and nutrients necessary for optimal growth, health, and development (17). The process of milk production begins during pregnancy when levels of prolactin, the primary hormone responsible for milk secretion in the glandular tissue of the breast, begins to increase. Full lactation does not occur until after
pregnancy because of the blocking action of progesterone, produced by the placenta. With birth, levels of circulating progesterone drop precipitously, causing the onset of milk secretion
(lactogenesis III), which is driven by removal of milk from the breast. If a mother chooses not to breastfeed, and thus is not providing any stimulation to the breast, milk production will gradually cease over a period of days to weeks (18).
It is this autocrine regulation that allows women to choose whether they will breastfeed, the proportion of breastfeeding to formula feeding they prefer, and how long they choose to breastfeed their child. All health organizations recommend exclusive breastfeeding for the first six months of life (19), followed by breastfeeding as a part of the complete diet for a year or more (20) or two years or more (21).
The prevalence of breastfeeding initiation in the United States is lowest among NH black women (66.4%) compared with NH white (83.0%), Hispanic (82.4%) and NH Asian (83.2%) women (22). While these percentages indicate that racial differences in breastfeeding initiation and prevalence still exist, there has been some recent improvement in the disparities between black women and other racial groups. In 2008, the rate of initiation of breastfeeding in NH black women was 11.5% higher than initiation rates in 2000, while among NH white women, the increase was only 3.4%. At 6 months, the prevalence of breastfeeding was 13.2% higher in 2008 compared to 2000 in NH black women, while among NH white women, rates were only 8.4% higher. At 12 months of breastfeeding duration, the differences in prevalence between 2000 and 2008 were very similar (6.2% higher in NH black women and 7.2% higher in NH white women) (23). This demonstrates an increasing initiation and duration of breastfeeding among black women, especially up to 6 months.
While continued advocacy and support is needed to eliminate racial disparities in
sociodemographic standing of the African American community overall in the US, or whether the difference is instead driven by social constructs or cultural norms (24). The experience of breastfeeding is assumed to be biologically similar for all women; however, differences in
cultural norms and perceived barriers along racial lines have been demonstrated (25-27). Cultural differences, however, don’t exist in isolation. Support of breastfeeding from organized health care institutions has been shown to vary depending on race, with black women receiving care that equates or favors formula use over breastfeeding in WIC populations (28-34). For example, a recent study using the 2011 Maternity Practices in Infant Nutrition and Care (mPINC)
questionnaire assessed breastfeeding supportive hospital practices. The study authors found that hospitals with catchment areas that had higher percentages of black residents were less likely to have implemented breastfeeding supportive practices (35).
While social constructs are important drivers of breastfeeding duration,
sociodemographic differences also play a role (36-39). Several researchers have sought to compensate for the preponderance of studies focused on low income women when assessing racial disparities in breastfeeding. In these studies, sociodemographic factors moderate the relationship between race and breastfeeding duration. For example, in a nationally representative dataset, the Third National Health and Nutrition Examination Questionnaire (NHANES),
within racial groups, breastfeeding interventions were more effective in urban populations (37) and among women who had higher education (39).
An interesting approach taken by Lundquist et. al. used the Pregnancy Risk Assessment Monitoring System (PRAMS) data to assess the difference in breastfeeding rates between women who were in the military compared with civilian populations. They hypothesized that because the military provides women with stable employment, equal educational opportunities, and universal healthcare including breastfeeding support by pediatric care providers, racial disparities in breastfeeding rates would be minimized. They found that breastfeeding was more prevalent among all women in the military setting than the civilian population, and that the ‘black-white gap’ in breastfeeding duration was significantly reduced among military affiliates (38).
In summary, both cultural and sociodemographic factors contribute to racial disparities in breastfeeding rates between black women and women of other races in the United States. While the reasons for these disparities are complex, there has been some improvement recently in both understanding the disparities, and in reducing the gap between different racial groups.
1.4 Breastfeeding Research
child with a bottle of formula once a week. These two women would have very different
measures of breastfeeding intensity, but in a measure of breastfeeding duration at 4 months, they would both be treated equally as having prevalent breastfeeding at that time point.
In breastfeeding research, duration of lactation is typically self-reported. Analysis of duration is accomplished using mean length of any breastfeeding or the presence of
breastfeeding at designated time points after birth. The literature suggests that recalled
breastfeeding is reasonably reliable, even decades after the index birth. In one study, women as distant as fifty years from birth (69-79 years of age) were asked to recall breastfeeding they had recorded prospectively while they were nursing. In this study, women who had breastfed for a short period of time tended to over-report their breastfeeding duration, while those women with a longer duration of breastfeeding were more likely to report accurately. However, when they misclassified their duration, women with a longer breastfeeding duration tended to under report the length of time they had breastfed. Overall, women were accurate to within +1/-1 three month category of duration 89% of the time (42). Natland et. al. (43) found similar results in a study of women 20 years after birth, with 85% reporting duration accurately within +1/-1 three-month interval. And finally, a study assessing recall reliability after 1 to 3.5 years found modest over-reporting of approximately one month (44).
development of diseases or conditions later in life. Cumulative lactation data are either used as a whole, or an average breastfeeding duration is calculated by dividing the full cumulative
lactation by parity.
Cumulative lactation and parity: When assessing for a dose response relationship
between breastfeeding and outcome disease, it is important to take into account how
breastfeeding was measured. Cumulative lactation does not account for parity, thus it typically increases as the number of children increase, introducing the possibility that parity may modify the outcome estimate.
Within the studies assessing the relationship between breastfeeding and hypertension or T2D, some authors provided outcome measures using both cumulative lifetime lactation and breastfeeding per birth, allowing for an assessment of how the measures differ. We would
expect, for example, that the benefits of breastfeeding for mean duration per child would occur at roughly half the number of months needed for the same level of benefit from cumulative
breastfeeding per child was 7.2, while the mean number of months of cumulative lactation was 14.6 months. Among women with confirmed cases of T2D, women with >0-0.49 years of breastfeeding per child had similar disease outcome (OR 0.94, 95% CI: 0.73, 1.21) as women who breastfed for >0-0.99 years of cumulative lactation (OR 0.91, 95% CI: 0.73, 1.13).
However, in a study using the ’45 and Up’ dataset from Australia (47), this same pattern was not evident. Instead, the rates of disease outcome were similar in categories of months of
breastfeeding duration regardless of whether the breastfeeding exposure measure was mean breastfeeding per child or cumulative lactation.
Another comparison of cumulative lactation and mean duration per child is demonstrated in outcomes from the Nurse’s Health Study estimating the association between breastfeeding and hypertension. In this study (48), outcome estimates were analyzed using a dataset restricted to women’s first children and then repeated using a variable for mean breastfeeding per child. By assessing cumulative lactation for first children, cumulative lactation was essentially converted into a variable for breastfeeding per child. While we would anticipate that these estimates would be similar given that they both assess the relationship between breastfeeding for one child and outcome disease; in fact, breastfeeding for the first child had a stronger association with hypertension than mean breastfeeding duration, indicating that research using only first births could be confounded by factors independently associated with first births, such as age.
Finally, one of the remaining questions about cumulative lifetime lactation as a measure of breastfeeding exposure is whether its inability to measure consistency of breastfeeding, or whether a mother of three children breastfed one child for 18 months or all three children for six months each, is important. We can assess this by using a study by Schwarz et. al. (49) in which a measure of breastfeeding consistency was used in addition to cumulative lactation. Questions on cumulative lactation were asked separately for each child. Women who breastfed all of their children for > 1 month were categorized as having consistent breastfeeding practices, while those who did not breastfeed all of their children for a minimum of one month were categorized as having inconsistent breastfeeding. While women who never breastfed were more likely to develop T2D than women who either consistently (OR 1.41, 95% CI: 1.03, 1.92) or
inconsistently breastfed (OR 1.42, 95% CI: 0.96, 2.09), consistent breastfeeding was not more protective than inconsistent breastfeeding (OR 0.80, 0.53, 1.21).
In summary, cumulative lactation is a reasonable variable to use in assessing the
relationship between breastfeeding and long term outcomes; however, the relationship between parity and cumulative lactation should be carefully considered and multiplicative as well as additive methods should be considered to address the relationship between parity and cumulative lactation in research models.
Effect Estimates-hypertension: There have been eight studies that estimate the association between breastfeeding and hypertension, using hypertension as one of the primary outcomes of interest (45, 47, 48, 50-54) and another six studies that assess the association between
This study (53), using the Promotion of Breastfeeding Intervention Trial (PROBIT) data, randomized hospitals and their affiliated outpatient clinics to receive a
breastfeeding promotion intervention or usual care. They were able to measure large contrasts in breastfeeding duration and exclusivity between the two groups. The researchers argue that randomization more effectively controls the social patterning inherent in both breastfeeding and weight retention than observational trials. Thus, the contradictory outcomes of the PROBIT study could be demonstrating that breastfeeding is one of a cluster of healthy lifestyle choices that reduce the risk of metabolic poor health, confounding the results of observational studies. However, women needed to have initiated breastfeeding to be included in the PROBIT trial, making it the only study assessing the relationship between breastfeeding and hypertension that did not include women who exclusively formula fed. Additionally, duration was not randomized, but chosen by women in the more supportive setting of the intervention arm, leading to similar rates of breastfeeding in the intervention and control arms, and limiting the ability of
randomization to control for social patterning thus reducing the power to detect a difference in outcome rates.
The exclusion of formula feeding women in the PROBIT study also forced the use of short breastfeeding as the referent category when assessing duration, reducing the statistical power to detect differences in outcome measures. Differences in hypertension between
possibility that the contradictory results are due to reduced analytic power to detect differences cannot be eliminated.
Effect Estimates-T2D: There are nine studies that have looked at the relationship between
lactation and T2D (46, 49, 50, 54, 61-65). Two of these have considered the effect of lactation in women with a history of gestational diabetes (61, 65). All the studies have shown reduced rates of T2D in women who had a history of any breastfeeding compared to those who did not breastfeed at all; however, there is not consistency regarding differential outcomes by length of cumulative lifetime lactation. It may be that the breastfeeding categories chosen contribute to the differences between studies. The strongest dose responses were demonstrated by Stuebe and Villegas who found differences in categories that varied markedly from the control group. For instance, Stuebe et. al. (62) found the strongest inverse association among women who lactated for more than 23 months (HR 0.88; CI: 0.78, 1.00) and Villegas et. al. (46) among women who lactated for 36 months or more (HR 0.73, 95% CI: 0.58, 0.91). On the other hand, Schwarz et. al. (49) found no difference in women who nursed 1 to 6 months per child (OR 1.04, 95% CI: 0.72, 2.04) compared to the referent of 6 months or more. In an effort to define the dose response relationship between breastfeeding and T2D more clearly, Aune et. al. combined several of the existing cohort studies in a meta-analysis. A linear dose-response relationship was found, indicating that there was a 9% reduction in relative risk for T2D for each 12 month increase in lifetime duration of breastfeeding (66). Thus, while the results vary between trials, the
1.5 Pregnancy, Breastfeeding, and the Reset Hypothesis
Both hypertension and T2D are included in the clustering of health conditions that make up ‘metabolic syndrome’ (67). While genetics and aging play a role in the development of metabolic conditions, obesity is central to the disease process for both hypertension and diabetes (10, 14, 67). Chronic obesity produces a low grade activation of the immune system triggering inflammatory pathways that dysregulate physiologic maintenance of insulin and leptin sensitivity while increasing immune factors such as cytokines and leukocytes. These pathways together contribute to the development of cardiometabolic diseases by causing end organ damage (68). This end organ damage, in turn, causes physiologic dysfunction in the form of hypertension and type 2 diabetes.
For women, pregnancy introduces increased risk factors for metabolic morbidity and mortality due to the normal changes in metabolic function it incurs. These include increased central adiposity (69), an elevation in blood pressure (70), an atherogenic lipid profile, and insulin resistance (71). Lactation may be an important component of a woman’s return to her pre-pregnancy metabolic state. In the postpartum period, lactating women have less
1.6 Obesity
Pregnancy and the postpartum period are times of high risk for increasing baseline BMI. Increasing gestational weight gain is a good predictor of increasing postpartum weight retention; however, it is the most predictive of postpartum weight retention in women who are not obese prior to pregnancy (77-79). Conversely, BMI prior to pregnancy is predictive of gestational weight gain (78, 80-85), at least in the first pregnancy (86-88). Women who are obese prior to pregnancy have higher rates of gestational weight gain. Rates of obesity are higher in black women (56%) than in the general US population (35%) (89) and black women retain more weight after pregnancy than white women (90-93). Thus higher pre-pregnancy obesity, as well as higher gestational weight gain among African American women, both have the potential to contribute to increased weight retention after pregnancy.
Qualitative research on obesity and pregnancy weight gain in the African American population has described reinforcement of ‘eating for two’ during pregnancy, as well as a
cultural concern that vigorous exercise could harm the growing child (94, 95). However, cultural norms cannot be considered in isolation. In order to understand trends in obesity among black women, inequalities in income, access to quality education and health care, as well as stable and affordable housing with access to healthy foods and safe places to exercise must all be
2.81) (93). BMI is thus an important confounder to consider in the association between breastfeeding and both T2D and hypertension, particularly among African American women.
1.7 Age
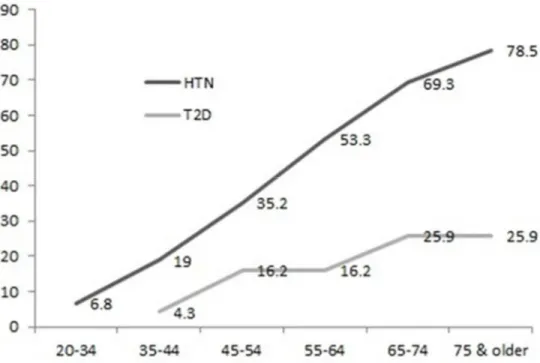
Age is an important modifier of the relationship between breastfeeding and metabolic disease. Blood pressure naturally increases with age in industrialized countries, from childhood through adulthood (97). As a result, prevalence of unhealthy blood pressure, or hypertension, also increases. By age 75, most US women (78.5%) have hypertension. According to the Framingham Heart Study, if a woman is free of hypertension at age 65, she has a 91% risk of developing it during the rest of her lifespan (98). The risk of T2D also increases with age, particularly after age 45. While there is a natural progression toward higher blood pressure, T2D rates increase with age primarily due to secondary factors, such as weight gain and decreased physical activity. The majority of T2D (63%) is diagnosed between ages 40 and 64 (99). Given the rising risk of both outcomes with advancing age, we therefore included an assessment of age as a modifier in both aims.
1.8 Knowledge Gaps
Few of the previous studies on breastfeeding and hypertension (54) or breastfeeding and T2D women (54, 100) include robust numbers of black women. While evidence exists on the relationship between breastfeeding and metabolic syndrome in majority white populations, there are significant differences documented between rates of metabolic syndrome in black and white women (101). We also know that obesity rates are rising faster in the African American
cultural, and economic racial disparities in the US, can confound the relationship between breastfeeding and metabolic health (103). By using the racially defined dataset available to us through the BWHS, we will be able to disentangle racial differences from the primary
relationship of interest. An analysis of all African American women necessarily provides more commensurate measures of cultural factors than a dataset of mixed race. And finally, precision around our measures of association for black women will be higher in this analysis than other analyses simply because of the number of black women available in the dataset. The proposed analysis of exclusively African American women provides a rich opportunity to extend the existing research into this high priority population.
Women who are obese have a higher risk of developing both hypertension (6) and type 2 diabetes (104). Obesity has also been shown to be associated with lower rates of breastfeeding (105-110). Interestingly, several authors have found racial differences in the relationship
between obesity and breastfeeding (110-112). For example, one study found a 3% lower chance of breastfeeding for each unit increase in prepregnancy BMI for white women (HR 1.03, 95% CI: 1.01, 1.04), but not among black women (HR 1.00, 95% CI: 0.98, 1.02) (110). The same pattern was demonstrated when comparing Hispanic women to black women. Obese Hispanic women were more likely to discontinue breastfeeding in the first six months after birth (RR 1.5, 95% CI: 1.1, 2.1), but obese black women were not, (RR 1.04, 95% CI: 0.78, 1.39) (111). In contrast with these studies, in our earlier work with this dataset, we found lower breastfeeding rates among obese black women than black women who were of normal weight.
assessing BMI as a moderator were mixed and in need of further exploration, and 3) the studies that have assessed BMI as a moderator have not had sufficient numbers of black women to determine whether the existing hypothesized racial differences are relevant.
1.9 Significance
Rates of metabolic diseases such as hypertension and type 2 diabetes and associated obesity are rising in the US population. There is a disproportionate burden of these
cardiometabolic disease states among black women. It is therefore a critical public health priority to evaluate health behaviors that have the potential to reduce rates of these important metabolic conditions. Addressing breastfeeding as a preventative health behavior is particularly compelling because it is a modifiable health behavior requiring a time-limited commitment and is associated with differences in metabolic health outcomes that last well beyond weaning. Quantifying the association in black women, who have a lower rate of breastfeeding but higher rates of
hypertension, T2D, and obesity, provides an important opportunity for informing public health messages specific to this high priority population.
1.10 Specific Aims
Aim 1: To estimate the association between cumulative lifetime lactation and reduced onset of hypertension in African American women. A nested case cohort model will be used to quantify the association between cumulative lifetime lactation, collected
Hypothesis 1a: Longer cumulative lifetime lactation is associated with lower rates of hypertension.
Hypothesis 1b: The association between cumulative lifetime lactation and onset of hypertension will be stronger in women who are not obese at age 18.
Aim 2: To estimate the association between cumulative lifetime lactation and reduced onset of type 2 diabetes in African American women. A nested case cohort model will be used to quantify the association between cumulative lifetime lactation, collected
retrospectively from approximately 40,000 parous women who were < 40 with their last pregnancy, and type 2 diabetes from ages 40 to 65. The resulting odds ratios will be assessed for effect measure modification by obesity at age 18.
Hypothesis 2a: Longer cumulative lifetime lactation is associated with lower rates of type 2 diabetes.
CHAPTER 2: APPROACH
2.1 Population
The Black Women’s Health Study is a prospective cohort study initiated in 1995 by researchers from Boston University and Georgetown University’s Lombardi Comprehensive Cancer Center in response to the scarcity of black women in cohorts used to study women’s health. The research was funded by the National Institutes of Health. Participants for the Black Women’s Health Study (BWHS) were recruited through the National Education Association, the personnel office of the national government, Essence magazine, the Black Nurses’ Association, and friends and relatives of respondents. Follow-up is ongoing, with 59,001 participants
receiving questionnaires every two years. As of 2013, 87% of person-time was complete. BWHS participants represent all quadrants of the United States. The most common medical conditions reported at baseline were uterine fibroids, hypertension, high cholesterol, and diabetes (113). Respondents’ deaths are reported through friends, relatives, the postal service, and the National Death Index. For women who give consent, illnesses are classified through the request for, and review of, medical records.
2.2 Analytic Sample
‘Covariates’, but are briefly described here to illustrate their relation to analytic sampling strategies.
Lactation exposure was reported cumulatively in 1995 and 2011 (Figure 2.1). Since the data were collected cumulatively, we could not verify whether breastfeeding was consistent (i.e. had a similar duration for each pregnancy), nor can we determine whether it occurred with each pregnancy. Consequently, lifetime lactation was maintained as a cumulative value inclusive of all the months of breastfeeding a woman had been exposed to in her life, rather than estimating a mean lactation per birth. In order to minimize recall bias, the 1995 baseline question on
cumulative lactation was used for women who had their last pregnancy before 1995, and the 2011 questionnaire for women who had a pregnancy in or after 1995.
Disease onset was reported differently depending on whether it occurred prior to the 1995 baseline questionnaire or in one of the subsequent questionnaires. If it occurred prior to cohort entry (1995), women reported decade of onset (for example, between ages 30-39) whereas those who developed disease after 1995 reported whether disease had occurred since the previous biennial questionnaire.
Study Design: One of the complexities inherent in assessing the relationship between
In a typical model utilizing this statistical method, excluded participants with prevalent disease were not cohort participants at the time of exposure; however, exposure, in essence, marks the entry of all participants into the study timeline. This inference is based on the analytic use or exclusion of the exposure variable based on the outcome disease. If a participant does not develop disease, she would be included in the analytic population; however, if disease occurs before baseline, she is excluded. In this way, exposure data are differentially utilized based on the outcome. The time between exposure and outcome thus becomes immortal time, or time during which the participant cannot develop disease and remain in the analytic sample (115).
One alternative to this conundrum is to utilize a cross sectional design (47, 50, 56). This type of analysis treats all cases of disease similarly, whether they occurred prior to, or after, cohort entry, thus utilizing all cases of disease. To operationalize this study design, women who develop disease at any age or point in time are compared to women who are disease free at the end of the study. While correcting for the bias created by differential treatment of exposure based on outcome, this design compares women who reach the end of the study period without disease to those who developed disease at every age and time equally. Women who reach the end of the study without disease, particularly a very common condition such as hypertension, are thus a disproportionately healthy population compared to the cases. While correcting for selection bias, this model does not allow the comparison of cases to like risk sets by age or at set points in time.
Case Control Sampling Design: The primary challenge in carrying out this study design
was the difference in the data on disease onset between women who developed disease from 1995 onward and those who developed disease before the study baseline. For women with disease onset after the baseline questionnaire, the age of each participant at disease onset could be derived by assigning the median age between the disease onset and immediate previous questionnaires. For example, if a woman with a new onset of hypertension was 52 when she completed the 1997 questionnaire, we knew her hypertension developed between ages 50 and 52. She would be assigned the median age, 51, as the age when her hypertension developed. Age categories for control selection were as follows: 40-44, 45-49, 50-54, 55-59, and 60-65. Her risk set would then include all women who were without hypertension in 1997 and were between the ages of 50 and 54.
If, instead, hypertension occurred prior to the baseline questionnaire, we had less information. For instance, if a woman was 52 at the time of the baseline questionnaire in 1995 and had an outcome disease, she would be asked ‘if a doctor ever told [her] that [she] had [hypertension] (not during pregnancy)’ and the ‘age at which it was first diagnosed’ with response options for: under 30, 30-39, 40-49, or > 50. If she responded that her hypertension developed between ages 40-49, we still would not have enough data to select her control from a 5 year risk set. In order to assign an age of onset of hypertension within each category of age using the available data, the following formula was used: let A = age, C = the age category for disease onset, Y = the youngest age in each age category of disease onset, and B = the
For the participant who was 52 at baseline with hypertension onset between 40-49, age would be assigned as follows: B = 52; Y = 40 and age (A) = 40 + (½ (52-40)) = 46. For instances in which ½ (B - Y) > 10, the age at the midpoint of the decade of onset was assigned (i.e. if a participant was age 65 at baseline with prevalent diabetes diagnosed at age 40-49, the assigned age at onset would be 45.
To correctly assign risk sets to participants, one further modification was enacted. We wanted each risk set to include women who were disease free and were her age at the
questionnaire cycle in which she reported disease, but if we used the questionnaire from 1995 to obtain risk sets for all women with disease onset prior to 1995, her risk set would be artificially restricted. If the risk set for our example participant was selected based on the age at which she reported hypertension (age 52 in 1995), her risk set would include women who had not
developed hypertension prior to cohort entry; however, women who were in her risk set at the time she developed disease, but themselves developed disease prior to cohort entry (for example, age 50), would no longer be eligible for sampling. We addressed this issue by deriving risk set samples for each 2-year interval from 1975, when the oldest women in our sample became eligible for selection, through 1995. We used these 2-year risk sets to select controls for each case.
Temporality: The BWHS recruited women who were between the ages of 20 and 70. The
limited our analysis to women who were < 40 at the time of their last birth and reported disease onset at or after age 40.
Exclusion by age: The risk of newly acquiring hypertension or type 2 diabetes peaks
between ages 45 and 65. (Figure 2.3).(12, 117). We limited the dataset to women who were < 65 at the age of disease onset to focus on middle aged onset of hypertension and T2D (Figure 2.4).
2.3 Exposure Assessment
Women in the Black Women’s Health study have been giving birth since 1941. Between 1941 and 2011, breastfeeding practices have changed dramatically. The nadir in breastfeeding initiation occurred in the early 1970s when breastfeeding initiation rates dropped as low as 22 % in the US population (118). Currently 80% of mothers in the United States initiate breastfeeding. Overall, the initiation rate in the BWHS is 61% (Figure 2.5). However, since this figure
represents women initiating breastfeeding from 1941 through 2011, it is not an accurate representation of how women in the BWHS compare to women exposed to different cultural trends over time. To more accurately assess breastfeeding rates in this population, an average breastfeeding rate per pregnancy was calculated (cumulative lactation/parity) bifurcated at 1995, based on the year of each woman’s last birth. When the data for women giving birth to all their children before 1995 were compared to women who gave birth to their last child in 1995 or later, a different pattern emerged.
breastfeeding (119) . After 1995, the breastfeeding initiation rate for the BWHS was 80%, which is comparable to current overall trends in the United States, and higher than rates of black
women specifically, suggesting that women in the BWHS continued to breastfeed at higher rates than black women overall, and similarly to the general population.
Women in the Black Women’s Health Study were asked about cumulative lifetime lactation or ‘How many months, in total, have you breastfed your children’ in 1995 and again in 2011. Response options in 1995 included ‘no children’, ‘never tried’, ‘tried but couldn’t’, and the following categories for months: < 1, 1-3, 4-6, 7-11, 12-17, 18-23, 24-35, 36-47, and > 48. In 2011, in response to the same question, participants reported the number of months of
cumulative lactation as an integer. To align categories across these two variables, we tested internal validity among women who responded in both 1995 and 2011 (Figure 2.6). Based on these results, we collapsed 1995 responses for ‘never tried’ or ‘tried but couldn’t’ to match ‘none’ from 2011, and coded women reporting ‘less than 1 month’ in 1995 as ‘1-3 months’ from 2011. We additionally collapsed breastfeeding categories over 24 months due to sparse data. For our analysis, we used the following categories, in months: none, 1-3, 4-6, 7-11, 12-17, 18-23, and > 24.
While it was necessary to collapse the 1995 questionnaire with the 2011 questionnaire to create a consistent variable for both years, the information contained in the category for ‘Tried but couldn’t’ was considered important information because it could contain information.
Women who tried to breastfeed but could not might have experienced lack of social support, lack of medical support for breastfeeding, or postpartum complications for mother or child. We therefore used this variable to conduct sensitivity analyses in both papers.
2.4 Outcome Assessment
Hypertension in the BWHS is a report of antihypertensive drug use, or report of
physician diagnosed hypertension together with use of diuretics in the same questionnaire cycle. Validation of this measure in the Black Women’s Health Study has been reported previously in a subset of 139 women in which hypertension was confirmed in 99% of cases (120). The overall prevalence of hypertension in the BWHS was 38% by 2011, similar to the 42.1% of adult women with hypertension in the US (8).
2.5 Covariate Assessment
Covariates were selected from the BWHS questionnaires based on a review of the existing literature and directed acyclic graphs. Each variable was individually qualitatively assessed and missingness was considered. A subset of variables was selected for consideration in each model. These variables are listed below (exclusive of variables created for sensitivity analyses).
Covariates fall into four general categories: 1) structural variables, 2) metabolic risk factors and health behaviors, 3) demographic variables, and 4) concurrent metabolic diseases. Definitions, coding decisions, variable structure, biases and background literature are discussed below.
STRUCTURAL VARIABLES
Age [categorical 40-44, 45-49, 50-54, 55-59, 60-65]:
Age was used structurally to control temporality between exposure and outcome, as well as being used as a matching criterion for control selection.
Parity [1, 2, 3, 4+]:
METABOLIC RISK FACTORS
BMI [<25 | 25 to 29.9 | 30 to 34.9 | 35 or more]:
Weight was measured at multiple time points and in multiple ways in the BWHS. At baseline, participants gave their height, weight, weight at age 18, and self-reported hip and waist
Family History of Metabolic Disease [no | yes >50 | yes < 50]
At baseline, study participants were asked to report parental history of heart attack, stroke or diabetes. Response options were “No / Don’t know”, “Yes” and “Yes, before age 50.” This variable is at risk for misclassification because the positive responses were not mutually exclusive and the negative response included an option for uncertainty. Thus, a positive response may underrepresent parental history of metabolic disease. Furthermore, parental onset of these conditions after 1995 was not assessed. Regardless of these limitations, it was considered as a variable in each model because family history is a strong predictor of disease, and could provide control for lifestyle exposures during childhood.
Gestational Diabetes [no | yes]
Pre-eclampsia [no | yes]
History of pre-eclampsia or gestational diabetes: In 2009, participants were asked if they had ever had a pregnancy with pre-eclampsia or gestational diabetes. Women who were older at cohort entry may under-report true occurrence for two reasons. First, recall bias might disproportionally affect the births that occur prior to 1995; however, reliability studies
demonstrate that women have good recall of pregnancy complications (r = 0.74), even when the event occurred 30 years in the past (126). Second, bias may occur due to differences in reporting and treating these diseases historically. In particular, practices for screening and diagnosis of gestational diabetes has evolved during the period that study participants gave birth.
HEALTH BEHAVIORS
Diet [>28 | 26-28 | 23-25 | 19-22 | <19]:
A DASH (Dietary Approaches to Stop Hypertension) variable was derived from the food
frequency questionnaire administered at baseline. Unhealthy components of the diet (sodium, red meat, SSDs) were reverse coded and the overall DASH score was made up of the sum of
rankings for each of the components. The energy from each of the food groups was summed, creating a variable with full caloric intakes (energy). These were ranked using quintiles. The dairy quintiles were re-calibrated in order to take into account the low consumption of these food groups (131).
Dietary questionnaires were administered in 1995 and 2001. The quintiles created in 1995 were used for all participants due to missingness in 2001.
Vigorous exercise [>3 | >0 to 3 | none]:
Vigorous exercise (On average, hours per week, over the last year) was recorded in every questionnaire cycle except 2003 and 2005. Baseline scores were used for all participants. Vigorous activity was assessed using Actigraph testing in 2006. Results indicated that vigorous activity had a higher correlation (r=.40, P<.001) with reported activity than moderate (r=.26, P<.05) activity in a study using a 7 day activity diary to validate the physical activity instruments used in the Black Women’s Health Study (132).
questionnaires and r = 0.32 – 0.48 when comparing questionnaire cycles four years apart, suggesting that vigorous exercise remains relatively stable.
The energy required for milk production in humans is preferentially obtained from decreased activity and increased caloric intake rather than from mobilization of fat. Therefore, dietary patterns and exercise are particularly important variables to include in any analysis of the effect of lactation on health outcome. Although this study’s measures may be remote from lactation, they represent general trends in health behaviors.
Both diet and exercise were measured at baseline; therefore, for women who developed the outcome disease prior to 1995, these variables were measured after, rather than before, the outcome. We hypothesized that diet and exercise after disease onset were a reasonable estimate of the diet and exercise patterns of an individual prior to the onset of the outcome disease. To test this hypothesis, we performed a sensitivity analysis in which the dataset was divided into women who developed disease before and after 1995, with adjustment for diet and exercise ascertained in 1995. For both Aim 1 and Aim 2 the outcome estimate was compared between models and to the overall outcome estimate using an a priori change in estimate of 5%. Outcome estimates were similar across all models suggesting that timing of diet and exercise assessment with respect to onset of disease did not materially affect results. We therefore used baseline diet and exercise for all participants.
Smoking [pack-years: never | <20 | >20:
number of years a person smoked, also reported in 1995. Categories were based on those constructed in the Framingham studies (133).
Alcohol per week [none | 1-7 | >7]:
Alcohol exposure was measured using data from 1995. The prevalence of abstinence in this dataset (48%) is similar to national rate among black women (47%) (134).
DEMOGRAPHIC FACTORS
Education [> college | some college | HS or less]:
Education was measured in 1995 and 2003. The cultural span of this longitudinal sample was quite wide, including changes, such as desegregation, that had a profound impact on the meaning of educational attainment, and the availability of education over the years. Thus, the meaning of education was different for women who were older when they began participating in the
questionnaire; however, the confounding across time is likely much less marked than it would be across races (24) and controlled by using age and questionnaire cycle as matching criteria for cases and controls.
Marital status [never | ever]:
Marital status was assessed in 1995, 1997, 1999, and 2005. Marital status was derived using data from 2005 and the most proximal earlier responses were used for missing data.
Childhood neighborhood urbanity [urban | suburban | rural | combination]:
Childhood neighborhood segregation [predominantly black | mixed | predominantly white]
As with urbanity, childhood neighborhood segregation can set patterns of behavior that last well into adulthood.
METABOLIC DISEASE
Prevalent Hypertension and type 2 diabetes [no | yes]:
For Aim, 1 a variable for T2D prevalent at case selection was created, and for Aim 2, a similar variable was created for hypertension.
Final adjustment sets: To determine the final variables for inclusion in models for Aim 1 and Aim 2, all variables were assessed for changes in prevalence across levels of cumulative lactation among the controls. Additionally, a model with all potential covariates was examined to assess for changes in estimate (a priori change in estimate > 5%), removing each covariate individually from largest to smallest Wald P-value (135). Change in estimate values were balanced against an assessment of change in precision (a priori <0.01) calculated using the difference in confidence limit ratios (confidence limit ratio = upper confidence limit/lower confidence limit) (136). We also used DAGitty (137) to construct a directional acyclic graph and calculate a minimally sufficient set. Each of these methods of assessing variables was compared. Using these various results, the minimally sufficient set determined through backward
(ascertained at age 18) was included in both models because of a priori plans for moderation analyses.
2.6 Data Analysis
We used unconditional logistic regression to estimate the association between cumulative lifetime lactation and outcome disease. Conditional analyses are always appropriate to use, but can be computationally taxing, particularly in large datasets. Unconditional maximum likelihood methods are appropriate in large datasets in which all strata will have more than 10 individuals (116). Both Aim 1 and Aim 2 have large final populations and outcome measures that are either common (hypertension) or relatively common (T2D); therefore unconditional likelihood
methods are appropriate.
With frequency matching, each case is matched to a stratum of like controls rather than a single individual control. This method ensures that there are equal distributions of the matching factors within cases and controls (138).
We used density or risk set sampling, which draws controls from the risk set of each case at the time that case occurs. Controls are present in multiple risk sets based on the amount of time they spend in the study. It is for this reason that odds ratios approximate the incidence rate ratios that would have been estimated in the full cohort. It was important to our study design that the controls were selected at the age and 2-year epoch of the cases so that we were controlling for age and time in our control selection. Risk set sampling facilitated this design element.
stratum. For this reason, we decreased the number of controls from 4 to 2:1; but for Aim 2, diabetes was less common (13%), allowing for the higher ratio of 4:1.
The datasets for these analyses were large (Aim 1 n = 37,539; Aim 2 n = 25,325). Additionally, almost all proportions for missing values were under 10%, with the exception of gestational diabetes (missing 27.6%). These two study characteristics allowed for use of complete case analysis. For Aim 1, 7455 (20.0%) observations were eliminated, and for Aim 2 6845 (30.4%) were eliminated.
In each aim, age, parity, and adolescent BMI were assessed as moderators. If moderation existed, outcome estimates were stratified by the moderator and presented in the paper as either a figure or table.
The second sensitivity analysis utilized the 1995 variable for cumulative lactation, which included ‘tried but couldn’t’ and ‘less than 1 month’. There is evidence that metabolic risk factors prior to or during pregnancy such as obesity (106, 140-142), insulin resistance (143), and glucose homeostasis in pregnancy (144) adversely impact lactation. It is possible that the
2.7 Tables and Figures
Figure 2.1. Analytic sample parameters illustrating prospective and retrospective ascertainment of cumulative lactation and disease onset.
Figure 2.3 Prevalence of hypertension (HTN) and type 2 diabetes (T2D) for women in the United States. Statistics for hypertension are from the
Figure 2.6 Among women whose last birth occurred prior to 1995, responses to the categorical 1995 cumulative lactation question were compared to their integer responses in 2011. Based on response patterns to both questionnaires, women who ‘Tried but couldn’t’ breastfeed and ‘Never tried’ were categorized as ‘0 months’ in the final lactation variable and women who breastfed for < 1 month were
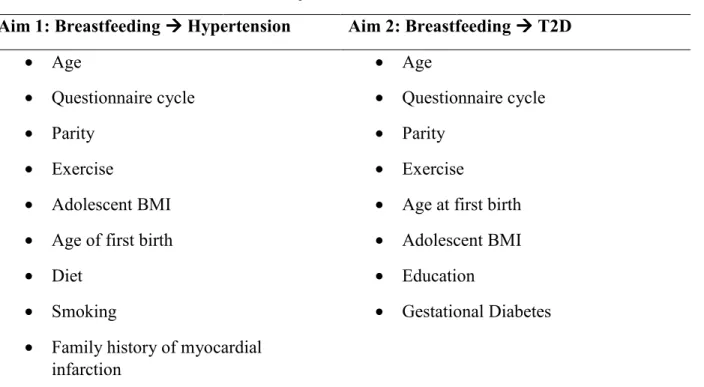
Table 2.1 Final adjustment set for Aim 1 and Aim 2
Final Adjustment Sets
Aim 1: Breastfeeding Hypertension Aim 2: Breastfeeding T2D
• Age
• Questionnaire cycle • Parity
• Exercise
• Adolescent BMI • Age of first birth • Diet
• Smoking
• Family history of myocardial infarction
• Age
• Questionnaire cycle • Parity
• Exercise
• Age at first birth • Adolescent BMI • Education
CHAPTER 3. CUMULATIVE LACTATION AND MIDDLE AGED ONSET OF HYPERTENSION IN AFRICAN AMERICAN WOMEN
3.1 Introduction
Hypertension affects nearly one in every three women (8) and is a contributor to cardiovascular disease, which is the leading cause of death in the United States (5, 6). It is hypothesized that the metabolic changes that occur during pregnancy may influence risk of cardiovascular diseases later in life (145-147). These metabolic changes include increased central adiposity (69), an elevation in blood pressure (70), an atherogenic lipid profile, and insulin resistance (71). After pregnancy, lactation may be an important component of a woman’s return to her pre-pregnancy metabolic state. Lactating women have less inflammation, greater insulin sensitivity (73), beneficial changes in cardiac output (74) and less atherogenic blood lipid profiles (55) than formula feeding women. These favorable changes during lactation have been termed the ‘Reset Hypothesis’ and have been posited as a possible mechanism underlying
differential risks of metabolic diseases later in life for women who breastfed compared to women who formula fed (76).
The association between lactation and metabolic conditions has important implications for health disparities. Black women in the United States have a disproportionately high
women (10). Additionally, black women have lower breastfeeding initiation (66.4%) compared with white (83.0%), and Hispanic (82.4%) women (22). These differences in breast feeding may contribute to a greater burden of disease among black women. However, none of the studies of breastfeeding and hypertension include sufficient numbers of black women for informative results (45, 47, 48, 50-52), and only a few of the studies of breastfeeding and general metabolic or cardiac health include this population (54, 56, 57, 148).
To address these gaps in the literature, we conducted a nested case control analysis within a follow-up study of black women, the Black Women’s Health Study, to estimate the association between lactation history and incident hypertension, with control for individual metabolic risk factors, health behaviors, and demographic characteristics.
3.2 Methods
DATA
The Black Women’s Health Study: We used data from the Black Women’s Health Study,
MEASURES
Cumulative lifetime lactation: Women completed questions on their lactation history in
1995 and 2011. Participants were asked “How many months, in total, have you breastfed your children” with categories of response options in 1995 that included ‘no children’, ‘never tried’, ‘tried but couldn’t’, and the following categories of months: <1, 1-3, 4-6, 7-11, 12-17, 18-23, 24-35, 36-47, and > 48. In 2011, the same question provided a space for participants to fill in the number of months of cumulative lifetime lactation as an integer. Responses for women who answered the questionnaire twice were compared. Based on their responses, the categories for 1995 were collapsed such that ‘never tried’ and ‘tried but couldn’t’ were coded to equal ‘none’ from 2011, and the category for ‘less than 1 month’ in 1995 was categorized as ‘1-3 months’. The final cumulative lactation variables for 1995 and 2011 contained the following categories in months: none, 1-3, 4-6, 7-11, 12-17, 18-23, >24. Cumulative lifetime lactation was ascertained from the most proximal response to the participant’s last birth.
Hypertension during middle age: Hypertension in the BWHS is a report of
antihypertensive drug use, or report of physician diagnosed hypertension together with use of diuretics in the same questionnaire cycle. For women who already had hypertension at the time of enrollment, hypertension onset was reported by decade of age (< 30, 30-39, 40-49, or > 50). For these women, a specific age of onset was allocated using the available categorical responses to disease onset with the following formula. Let A = age, C = the category for decade of age of onset, B = the participant’s age at baseline, and Y = the youngest age in each category of hypertensive onset. The assigned age would thus be:
For example, if a participant aged 55 at baseline reported prevalent hypertension (B = 55), with a diagnosis of hypertension at age 40-49 (Y = 40), then age (A) = 40 + (½ (55-40)) = 47.5. For instances in which ½ (B - Y) > 10, the age at the midpoint of the decade of onset was assigned (i.e. if a participant was age 65 at baseline with prevalent hypertension diagnosed at age 40-49, the assigned age would be 45).
In follow-up questionnaires, women were asked if they had been diagnosed with hypertension in the past two years. Their age at diagnosis was assumed to be the median age between completion of that questionnaire and the previously completed questionnaire. Age was then categorized as follows: 40-44, 45-49, 50-54, 55-59, and 60-65.
Covariates: Parity and age at last birth were obtained in 1995 and updated with each
subsequent questionnaire. Diet (Dietary Approaches to Stop Hypertension [DASH] scores) (131), vigorous exercise, and smoking (pack-years) were ascertained from the baseline
questionnaire. Body Mass Index (BMI) (kilograms/m2) in adolescence was derived from recalled
weights at age 18 and height at baseline and categorized as normal (<25 kg/m2) or
overweight/obese (< 25 kg/m2). Education was reported in 1995 and updated in 2003. Histories
of pre-eclampsia and gestational diabetes were obtained in 2009. Diabetes was ascertained on each questionnaire, and a family history of metabolic disease before or after age 50 (parent with diabetes, stroke, or myocardial infarction) were each ascertained separately at baseline.
Analytic population: We restricted this analysis to parous women (n = 44,350) who had
responded to questions about cumulative lifetime lactation (n = 42,068). We excluded 7,109 women whose onset of hypertension occurred before age 40 and 1,012 women who were aged 40 or more at the birth of their last child. We limited the analytic sample to women who had
who were over 65 at the time of diagnosis. This gave us a sampling population of 33,257 women in which we identified 12,513 cases of incident hypertension. We used density sampling to frequency match two controls to each case for a final analytic population of 37,539. Controls were randomly selected from risk sets matched on age and questionnaire cycle. Risk sets
included all women who were in the same age category, and were disease free at the time the risk set was sampled. Hypertension cases in the analyses could have occurred as early as 1975; therefore the risk sets included each two-year period from 1975 through 1993, as well as the years from 1995 on. A single participant could be selected as a control more than once, and a control could become a case in a later risk set (116). Because we used density sampling for the controls, the odds ratios (OR) provide an estimate of the incident rate ratios that would have been obtained from the full cohort (138, 150).
Statistical analysis: We used unconditional logistic regression to estimate odds ratios and
95% confidence intervals (CI) for the association between cumulative lifetime lactation and incident hypertension. Missing values were handled using complete data analysis (7,455 women excluded).
Potential confounders and effect measure modifiers were identified through a review of the literature and examination of causal diagrams. Inclusion was based on associations with cumulative lactation among the controls and a greater than 5% change in estimate criterion (135) balanced against an assessment of change in precision (a priori <0.01) calculated using the difference in confidence limit ratios (confidence limit ratio = upper confidence limit/lower confidence limit) (136).
age restricted models, we performed tests for trend by including the summary variable for cumulative lactation in the model as an ordinal variable among women who breastfed.
Sensitivity analyses: Weight retention after pregnancy has been hypothesized as a risk
factor for later hypertensive disease. We were therefore interested in whether overweight/obesity that developed during the reproductive years had a stronger effect on the relationship between breastfeeding and hypertension than adolescent BMI. This measure was not available for women whose disease occurred prior to the baseline questionnaire, so a restricted dataset was used including only women whose disease onset occurred after the baseline questionnaire (n=9,205). In this subset, we were able to derive a variable that measured BMI that developed between ages 18 and 40 (adult onset of BMI) by ascertaining BMI at age 40 (inclusive of age 41) in women who reported normal adolescent BMI (BMI at age 18).We repeated the assessment of effect measure modification for BMI, replacing adolescent BMI with adult onset BMI.
It is possible that very short periods of breastfeeding might be associated with perinatal morbidities rather than a choice not to breastfeed. The responses available in the 1995
questionnaire allowed us to compare women who ‘never tried’ to breastfeed with those who failed to meet their expectations (‘tried but couldn’t’ and ‘<1 month’). For this analysis, we restricted the dataset to women who had given birth to their last child prior to baseline in 1995 (n=21,991), whose complete breastfeeding experience would be captured on the 1995
questionnaire.