rstb.royalsocietypublishing.org
Review
Cite this article:
Kingsolver JG, Buckley LB.
2017 Quantifying thermal extremes and
biological variation to predict evolutionary
responses to changing climate.
Phil.
Trans. R. Soc. B
372
: 20160147.
http://dx.doi.org/10.1098/rstb.2016.0147
Accepted: 5 November 2016
One contribution of 14 to a theme issue
‘Behavioural, ecological and evolutionary
responses to extreme climatic events’.
Subject Areas:
evolution, ecology
Keywords:
extreme value distribution, phenotype,
selection, thermal performance curve,
thermal tolerance, time scale
Author for correspondence:
Joel G. Kingsolver
e-mail: [email protected]
Quantifying thermal extremes and
biological variation to predict evolutionary
responses to changing climate
Joel G. Kingsolver
1and Lauren B. Buckley
21Department of Biology, University of North Carolina, Chapel Hill, NC 27599, USA
2Department of Biology, University of Washington, Seattle, WA 98195, USA
JGK, 0000-0002-9839-0208; LBB, 0000-0003-1315-3818
Central ideas from thermal biology, including thermal performance curves and tolerances, have been widely used to evaluate how changes in envi-ronmental means and variances generate changes in fitness, selection and microevolution in response to climate change. We summarize the opportu-nities and challenges for extending this approach to understanding the consequences of extreme climatic events. Using statistical tools from extreme value theory, we show how distributions of thermal extremes vary with lati-tude, time scale and climate change. Second, we review how performance curves and tolerances have been used to predict the fitness and evolutionary responses to climate change and climate gradients. Performance curves and tolerances change with prior thermal history and with time scale, complicating their use for predicting responses to thermal extremes. Third, we describe sev-eral recent case studies showing how infrequent extreme events can have outsized effects on the evolution of performance curves and heat tolerance. A key issue is whether thermal extremes affect reproduction or survival, and how these combine to determine overall fitness. We argue that a greater focus on tails—in the distribution of environmental extremes, and in the upper ends of performance curves—is needed to understand the consequences of extreme events.
This article is part of the themed issue ‘Behavioural, ecological and evolutionary responses to extreme climatic events’.
1. Introduction
In the US, debate has raged since the intense heat waves in the summer of 1988 over whether a ‘signal’ of global warming has finally been detected against the background
‘noise’ of natural climatic variation. . . (Stephen Schneider, 1990 [1, p. 9])
Extreme climatic events—heat waves, droughts, floods—have attracted increasing attention in recent decades, and their frequency and magnitude are increasing due to ongoing climate changes [2]. As Schneider [1] suggests, determining the causes of extreme events is hard [3]; determining the biological consequences of such events is even harder. For example, the ecological and microevolutionary conse-quences of increases in mean temperatures are now widely documented [4,5], but patterns and consequences of extreme environmental events are more poorly understood. Case studies in a handful of study systems have documented evolutionary changes in size, morphology or tolerance in association with drought or extreme high temperatures [5,6]. Conversely, a recent meta-analysis of pheno-typic selection in field populations did not detect any association of heat waves (maximum temperatures) or short-term drought (minimum precipitation) with spatial and temporal variation in selection; selection was instead associated with other aspects of climate (e.g. mean precipitation and minimum potential evapotranspiration, PET) [7]. Are climatic extremes of special importance for selec-tion and microevoluselec-tion, compared with mean and variaselec-tion in climate? The role of extreme environmental events for extinction and diversification at macroevolu-tionary time scales is well-established [6], but the importance of adaptive evolution
in response to extreme climatic events on the scale of years to centuries is largely unknown.
Models for adaptive evolution require information about selection—how phenotypic (or genotypic) variation causes variation in fitness [8,9]. In this framework, changes in environ-mental conditions (including climate) alter the relationships between phenotypic traits and fitness, and thereby change the form, direction and magnitude of selection. Environmental change may also alter phenotypic and genetic variation, which can alter both the strength and evolutionary responses to selection [10,11]. This framework has facilitated a wealth of empirical studies quantifying phenotypic selection (and to a lesser extent, genetic variation) in different environmental conditions [12,13]. But a major limitation to applying this framework to climate change and climate extremes is that the causal connections among climate conditions, phenotypes and fitness are rarely known. What is lacking is a quantitative theory of phenotypic selection that would allow predictions of how changes in environment generate changes in selection.
The field of thermal biology has provided a useful test case for developing a quantitative framework for selection in the context of climate change [14,15]. These studies focus on two main types of phenotypic traits: thermal performance curves (TPCs), which relate performance or fitness as a function of body temperature; and thermal tolerances, which represent body temperature thresholds at which survival (or perform-ance) changes precipitously. By combining data on changes in weather or climate with information on TPCs and tolerances, we can predict the fitness and selective consequences of environmental change. This approach has been used to quan-tify the empirical relationships between temperature changes and changes in mean fitness, phenotypic selection and evol-utionary responses; and to predict how recent and future climate changes will alter mean fitness, selection and evolution [14–19]. Some of these studies highlight the potential impor-tance of climatic extremes for selection and evolutionary responses to climate change [16,18,19]. However, we suggest that there are some important challenges in using TPCs and tolerances to model responses to extreme conditions.
In this perspective we highlight the challenges of con-necting climate extremes and thermal biology to understand selection and evolutionary responses of ectotherms to climate change. First, we discuss climate ‘extremes’ in the context of variation in weather and climate. In this paper we define extremes in terms of the upper end (or tail) of the distribution of climatic variables, focusing on temporal variation in tempera-ture and how it changes geographically [20]. We summarize some key concepts and tools from the statistics of extreme values, and apply these to environmental temperature data along two climatic (latitudinal) gradients. One message is that temporal distributions of temperatures are frequently skewed and have ‘fat’ or ‘thin’ tails, and that these properties vary with geographical region and with time scale. This has important consequences for the nature of climate extremes and their biological consequences. Second, we briefly summar-ize the use of TPCs and thermal thresholds for quantifying the effects of climate variation and extremes on mean fitness, selec-tion and evoluselec-tionary responses. An important challenge is that TPCs and thermal thresholds can vary with prior thermal history and with the time scale at which they are measured, making it difficult to integrate the effects of climate variation and extremes across the life cycle to quantify fitness and selec-tion. Third, we review several recent field and modelling
studies that document or predict evolutionary responses in performance curves. We use extreme value analyses to quantify how extreme thermal events contribute to the evol-ution of thermal tolerance and performance curves in these studies. The analyses illustrate how environmental extremes and unpredictability can impact evolutionary responses to cli-mate change, but their predictions depend strongly on key assumptions about fitness consequences of higher tempera-tures. We highlight several key areas that limit current progress in understanding the role of climate extremes in rapid adaptive evolution.
2. Variation in weather and climate
There is a well-developed statistical framework for analysing variation in extreme values [21]. Denny and colleagues provide an excellent introduction to this framework for biologists [22,23]. Here we use environmental data on daily maximum air temperatures at sites along latitudinal gradients to deter-mine the distributions of extreme temperatures at each site, and illustrate how tools from extreme value theory can characterize extreme thermal events. Our presentation focuses on how latitude and time scale alter the distribution and frequency of extreme thermal events.
(a) Weather and climate extremes are not normal
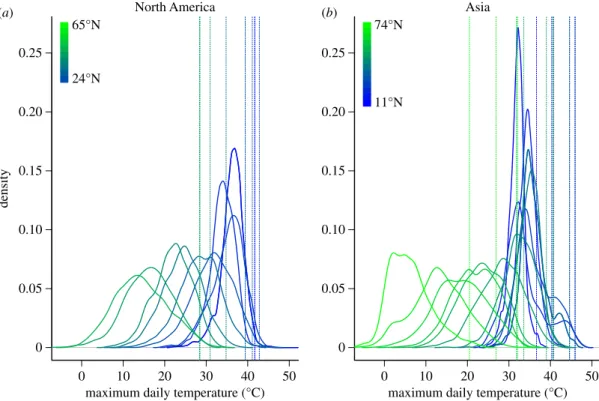
Daily maximum temperatures are relevant to short-term ther-mal stress in many ectotherms [24,25]. We quantify the distribution of daily maximum temperatures using weather stations in the Global Historical Climatology Network (GHCN). We accessed the data using the R package rnoaa [26]. We restricted our analysis to weather stations below 500 m in elevation, with data more recent than 2010, and with at least 10 (and up to 60) years of nearly (more than 85%) complete data. Using data only since 1980 yielded very similar results, so we report analyses of the full data here. Because we are primarily interested in high tempera-tures that may cause heat stress, we restricted our analyses to summer months (June, July and August: all sites we con-sider are in the northern hemisphere). We examine weather stations along latitudinal transects in the centres of North America (21008E) and Asia (77.58E) to explore continental rather than coastal climate conditions.
The breadth, skewness and shape of the daily maximum temperature distribution varies with latitude (figure 1). Lower latitude distributions are relatively narrow and shift little as latitude increases. The location of the 99th percentile also tends to aggregate at lower latitudes. At higher latitudes, distributions broaden and shift steadily to lower mean temp-eratures with increasing latitude. Many distributions depart from normality, increasingly so with climate change [27].
Generalized extreme value (GEV) distributions can describe temperature distributions that depart from normality and have thick or bounded tails (see below), and have been used to assess the incidence of extreme climatic events [21,27]. GEV analyses are increasingly applied to daily maxi-mum or minimaxi-mum temperature data to quantify thermal extremes in studies of climate change [28,29]. GEV distri-butions are described by three parameters: location indicates the position, scale indicates the breadth (figure 2a), and shape indicates the heaviness of the tail. Shape parameter values near zero correspond to a Gumbel (type I) distribution
rs
tb.r
oy
alsocietypublishing.org
Phil.
Trans.
R.
Soc.
B
372
:20160147
North America
24°N 65°N
11°N 74°N
Asia
0 10 20 30 40 50 maximum daily temperature (°C)
0 10 20 30 40 50 maximum daily temperature (°C)
density
0 0.05 0.10 0.15 0.20 0.25
(a) (b)
0 0.05 0.10 0.15 0.20 0.25
Figure 1.
The distribution (and 99% quantiles: dashed vertical lines) of maximum daily temperature (8C) broadens and shifts toward lower temperatures as the
latitudes of weather stations increase along latitudinal gradients (at 58
intervals) in the centres of (
a
) North America (2100
8E) and (
b
) Asia (77.5
8E).
scale = 3 scale = 4.5 scale = 6 location = 30 location = 50
North America Asia
shape = −0.3 shape = −0.1 shape = 0.0 shape = 0.1
density
99% quantile GEV location
density
GEV scale
−0.4
0 2
3 4 5 6 7 20 25 30 35 40 45
0.02 0.04 0.06 0.08 0 0.04 0.08 0.12
(a) (b) (c)
(d) (e) (f)
−0.3 −0.2 −0.1
GEV shape
maximum daily temperature (°C) latitude (°) latitude (°) 10
0 10 20 30 40
20 30
30 40 50 60 10 20 30 40 50 60 70 40 50 60 70 10 20 30
20 40 60 80 10 20 30 40 50 60 70 40 50 60 70
Figure 2.
The parameters of the generalized extreme value (GEV) distribution describing maximum daily temperatures (8C) vary across latitude for transects in North
America and Asia. GEVs are characterized by three parameters: (
a
) location, which indicates position; scale, which indicates breadth; and (
d
) shape, which indicates
the thickness of the tail. The (
b
) 99% quantiles and (
c
) GEV locations decline steadily with latitude, whereas the (
e
) scale parameter increases. (
f
) The GEV shape
parameter is variable across intermediate latitudes. Low and high latitude stations, particularly in Asia, tend to have heavier tails.
rs
tb.r
oy
alsocietypublishing.org
Phil.
Trans.
R.
Soc.
B
372
:20160147
characterized by a light tail; shape parameter values greater than zero correspond to a Frechet (type II) distribution characterized by a heavy tail; and shape parameter values less than zero correspond to a Weibull (type III) distribution characterized by a bounded tail (figure 2d).
We use GEV distributions to characterize distributions of maximum daily temperature across the latitudinal gradient. We fit GEV distributions using maximum likelihood and the gev.fit function in the ismev R package [26]. We fit station-ary distributions, but note that non-stationstation-ary fits can be used to account for shifts in the distribution due to climate change [27]. Both the 99th distribution percentiles and GEV location are relatively constant across latitude up to approximately 408N, before declining steadily toward the poles (figure 2b,c). The breadth (scale parameter) increases steadily toward the poles (figure 2e). The GEV shape parameter varies, but shows little pattern, across intermediate latitudes (figure 2f). The temperature distributions, particularly in Asia, tend to have a heavier tail at both low and high latitudes. These results about daily maximum temperatures suggest that average maximum temperatures are similar across a wide latitudinal band (up to 30–408latitude), and variation in maximum temp-erature increases consistently with latitude. By contrast, thermal extremes (tails) are strongly bounded over a wide range of intermediate latitudes (approx. 20–608), with fatter tails at some low and high latitude sites (figure 2f).
(b) Environmental variability depends on time scale
The time scale of temperature data influences the distribution and the incidence of climatic extremes [30,31]. Because different organismal processes respond to environmental variation at different time scales [32,33] (see below), this has important consequences for the biological consequences of climate extremes. For example, the stressful impacts of heat waves are often determined by repeated exposures to high daily maximum temperatures rather than to overall mean temperatures. In addition, the biological effects of single versus repeated exposures to extreme temperatures can be qualitatively different [33–38]. To explore this issue, we average daily maximum temp-eratures for two North American sites across weeks (moving average), months and years. As the temperature data are aggre-gated at longer time scales, distributions necessarily narrow, but the thinning of the tails is more pronounced than the narrow-ing breadth (figure 3a). In addition, the effect of time scale is more pronounced in the thermally variable higher latitude site (458N) relative to the lower latitude site (248N).
Appropriately characterizing the tails of the temperature distribution is central to understanding how often organisms will experience extreme events. We use the generalized Pareto distribution to characterize the tails of the distribution. We fit the distribution using maximum likelihood with the fpot function from the R package evd [26]. We examine the maxi-mum temperature expected to be experienced over a given duration of time (return period). Averaging over time decreases the magnitude of maximum temperatures experi-enced, particularly for the lower elevation, less thermally variable site (figure 3a). For both daily and weekly data, the magnitude of temperature extremes increases with the duration of the return period, with the slope shallowing.
Extremes are rare on average but can occur repeatedly. Repeat thermal stress events can prevent recovery in between the events and otherwise amplify thermal stress [39]. The
interval between heat events is described well as a Poisson distribution [27]. As the magnitude of the extremes increases (higher quantile of the temperature distribution), the peak of the distribution shifts to longer intervals and the thickness of the tail (longer intervals between extremes) increases (figure 3c). The flat distribution of rare heat events makes it difficult to anticipate biological responses.
3. Responses of ectotherms to variable weather
and climate
(a) Performance, tolerance and thermal thresholds
Most aspects of organismal performance—e.g. rates of loco-motion, feeding, growth, reproduction and survival—depend on the organism’s body temperature; this relationship is called a thermal performance curve [14,40]. Performance curves frequently have a characteristic shape in which per-formance initially increases with increasing temperature, reaches maximal performance at some intermediate (optimal) temperature, then declines rapidly with further increases in temperature (figure 4). The basic shape reflects responses to both average and stressful temperatures: the effects of tempera-ture on enzymatic rate process, and on enzyme activation and stability at high temperatures [42]. Comparative and exper-imental studies in a variety of systems demonstrate adaptive variation in both optimal temperature (Topt) and in thermal
breadth (Tbr): optimal temperatures are greater in systems
where mean environmental temperatures are higher (and less variable); and thermal breadths are wider in systems where environmental variation is greater [14,43]. The upper thermal limit (Tu) for performance can be defined as the temperature
at which performance reaches (or approaches) zero, and is sometimes used as a measure of thermal limits (see below). Most empirical studies of performance curves focus on quanti-fyingTopt, Tbr and lower thermal limits, rather than upper
limits; estimates of thermal limits frequently involve extra-polation beyond the data [19], resulting in large statistical uncertainties in our estimates of Tu. As we discuss below,
this has important consequences for our understanding of responses to climate extremes.
Tolerance curves can be considered a special case of performance curves in which the measure of performance is sur-vival [44]. Tolerance curves (at least on a linear scale) are typically less skewed (i.e. more symmetric) and platykurtotic (i.e. flat-topped) when compared to other performance curves: survival is high and relatively constant over a range of tempera-tures, but declines rapidly at lower and higher temperatures. The high temperature at which survival reaches or approaches zero, Tu, is an important measure of heat tolerance. A complementary
approach to characterizing heat tolerance is to measure the criti-cal thermal maximal temperature (CTmax): the threshold
temperature at which an organism ‘fails’ some relevant assay of performance (e.g. body posture or righting response, locomo-tory activity, neuromuscular control, survival). Both static (constant) and dynamic (ramping) temperature experiments can be used to estimate CTmax, resulting in an extensive literature
on the topic [25,45–47]. Recent comparative studies indicate that, unlike metrics of lower thermal limits, mean CTmaxdoes not
decrease with increasing latitude in most ectotherms [24,25]. High CTmaxmay reflect the need to tolerate rare heat events
[48], but historical patterns of colonization, selection favouring
rs
tb.r
oy
alsocietypublishing.org
Phil.
Trans.
R.
Soc.
B
372
:20160147
‘hotter is better’ and warming associated with solar radiation likely also maintain high CTmax[25].
TPCs and threshold temperatures provide a useful frame-work for quantifying and predicting the effects of body temperature and thermal variation for ectotherms, but have several important limitations. First, the effects of (current) temperature on performance or tolerance may depend on previous thermal history, as a result of stress and acclimation responses. Many studies have demonstrated that higher developmental temperatures or acute heat shocks can alter CTmax and other metrics of heat tolerance [38,49]; and
exposure to increased maximum temperatures during devel-opment can also change optimal temperatures, upper thermal limits and maximum temperatures in some organisms [14,41,50]. Second, temperature may interact with other
environmental factors to alter performance curves. For example, food availability and nutritional quality change optimal temperatures, upper thermal limits and maximal performance in fish and insects [51,52].
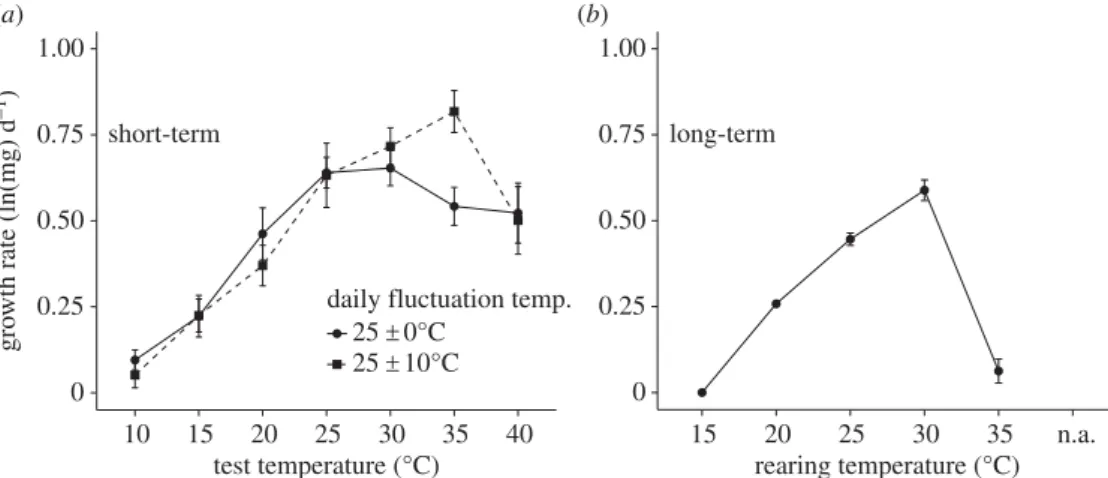
A third, less appreciated limitation is that performance curves and thresholds often reflect particular time scales. Some aspects of performance, such as rates of locomotion, feeding, growth, metabolism, oviposition and survival can be measured over short time scales (minutes to hours), whereas rates of growth, development, survival or fitness over a life-stage or the lifespan of individuals involve longer time scales (days to months or even years) [32,33,53]. As an example, the TPCs for larval growth rates inManduca sextameasured over short (24 h) or long (duration of larval growth period, 15–50 days) time scales differ in optimal temperature, thermal North America, 24° N
day week month year
North America, 45° N
maximum temperature (°C)
return period (years)
days between heat events 90 %ile 95 %ile 98 %ile
0 50 100 150 200
days between heat events 0
0
15 20 25 30 35 40 45 maximum temperature (°C)
15 20 25 30 35 40 45
20 40 60 80
return period (years)
0 20 40 60 80
50 100 150 200
density
density
maximum temperature (°C)
(a)
(b)
(c) 0.20
0.10
0
0.20
0.10
0
70
65
60
55
50
45
40
0 0.02 0.04 0.06 0.08
0 0.02 0.04 0.06 0.08 36 38 40 42 44
Figure 3.
(
a
) The maximum temperature (8C) distribution narrows and tails thin as data are averaged across weeks, months and years. The effect of time scale is
more pronounced in the thermally variable higher latitude site (458N) relative to the lower latitude site (248N). (
b
) The maximum temperature experienced
increases with the duration of the return period (years) and is greater when data are less aggregated. (
c
) The distribution of days between heat events shifts
to longer intervals as the magnitude of the extremes increases (from the 90% to 98% percentiles).
rs
tb.r
oy
alsocietypublishing.org
Phil.
Trans.
R.
Soc.
B
372
:20160147
breadth and upper thermal limits: temperatures that maximize growth at short time scales are deleterious or lethal at longer time scales (figure 4) [41]. Similarly, thermal thresholds of larvalM. sextaare much higher at shorter than at longer time scales: the mean upper thermal limit for survival (through the larval period) is 35–368C, whereas mean CTmax and
upper lethal limits are 44–468C [34].
Measurements of CTmaxare also confounded by the
tem-poral and thermal conditions in which they are measured. Many recent studies use a ramping protocol in which individ-uals are acclimated to a starting temperature, then the temperature is increased (ramped) at some linear rate; CTmax
is then defined as the temperature at which failure is observed. Studies withDrosophilashow that changes in starting tempera-ture and ramping rate can systematically alter mean estimates of CTmaxby more than 58C [46]. The CTmaxthat an organism
can tolerate declines with the duration of thermal stress [54]. Both statistical and biological reasons underlie these methodo-logical effects, highlighting the need to develop ‘ecomethodo-logically relevant’ thermal tolerance metrics [45,47].
The effects of time scale become particularly important when using estimates of performance curves and thresholds to quantify mean and variation in performance in fluctuating thermal environments. In principle, information about the per-formance curve,P(T), and changes in temperature over timet, T(t), can be used to predict mean performance in fluctuating environments over some time period of interest. This simple model has been widely applied in thermal biology, includ-ing for predictions about responses to climate change (see below). But recent tests of this model question whether per-formance curves are constructed in a manner appropriate for assessing responses to diurnally fluctuating temperatures. For example, TPCs based on experiments using constant temp-eratures throughout development yielded poor predictions about mean development rates during diurnal fluctuating con-ditions in marsh frogs [55]. Similarly inM. sexta, neither short-term (24 h) nor long-short-term (larval duration) TPCs for growth rates based on constant temperatures gave accurate predictions for mean growth in diurnally fluctuating temperature con-ditions [41]. Predictions were particularly inaccurate for higher mean temperatures with large diurnal fluctuations— precisely the situation in which thermal extremes may be relevant. These predictions fail because this simple model ignores time-dependent effects: the effects of prior thermal
history on current performance that result from stress, acclim-ation and similar processes [32,53]. These results call into question the common practice of using TPCs measured at constant temperatures to predict responses of ectotherms to diurnal fluctuations and climate change.
(b) Predicting the fitness consequences of climate
change and climate extremes
The past decade has seen a burst of modelling studies that use TPCs (primarily for insect fitness) to predict responses of ectotherms to recent and future climate change [16–19]. These studies reveal the need to filter climate change responses through the lens of organismal physiology. Even small temp-erature increases may cause declines in the fitness of tropical ectotherms, which have evolved narrow thermal breadth and optimal temperature that are already near mean environmen-tal temperatures in relatively constant environments [16]. Ectotherms at mid- and higher latitudes, with broad thermal breadth and optimal temperatures well above mean environ-mental temperatures, will be positively (or at least less negatively) impacted by future climate warming. Responses to environmental variation and extremes may cause deviations from these predictions.
The TPCs may inadequately capture responses to envi-ronmental variation. First, the TPCs for fitness (e.g. intrinsic rate of increase,r) used in these studies were estimated from data at constant temperatures over the entire lifespan. Because such long-term curves have lower optimal temperatures and upper thermal limits than shorter-term curves (figure 4) and omit acclimation, applying these curves to short-term (diur-nally fluctuating) thermal variation will overestimate the negative consequences of high daily maximal temperatures [41]. Second, depending on the functional form chosen to rep-resent the TPC, fitness at high temperatures declines to zero but is never negative [16]. Models that allow fitness to decline below zero predict that environmental variation may drive mid-latitude rather than tropical insects to suffer the greatest negative fitness consequences of climate warming [19].
A third, related issue is that different fitness components contribute in different, nonlinear ways to total fitness, so that computing mean fitness is not straightforward when there is environmental variation at time scales shorter than a gener-ation. For example, within a generation, the arithmetic short-term
0 0.25 0.50 0.75 1.00
(a) (b)
10 15 20 25 30 35 40 test temperature (°C)
gro
wth rate (ln(mg) d
–1)
daily fluctuation temp. 25 ±0°C
25 ±10°C
long-term
0 0.25 0.50 0.75 1.00
15 20 25 30 35 n.a. rearing temperature (°C)
Figure 4.
Mean (+1 s.e.) growth rate of
Manduca sexta
larvae as a function of temperature. (
a
) Short-term (24 h) growth rate (corrected for initial mass) at the
start of the 5th instar, for larvae reared from hatching at constant (258C: solid line, circles) or fluctuating (258C
+
108C: dotted line, squares) rearing temperatures.
(
b
) Long-term (hatching to wandering) larval growth rate at constant temperatures. From [41].
rs
tb.r
oy
alsocietypublishing.org
Phil.
Trans.
R.
Soc.
B
372
:20160147
mean of reproductive rates (given survival) is appropriate for estimating overall reproduction, whereas the geometric mean of survival rates is more appropriate for estimating overall survival. As a result, the arithmetic mean of r may be a poor indicator of fitness responses to short-term thermal vari-ation; and modelling the separate effects of temperature on each fitness component may be needed [19]. As we discuss below, whether thermal stress causes reductions in repro-duction or increases in mortality has important impacts on the evolutionary responses to thermal extremes.
These limitations are particularly important when con-sidering responses to climatic extremes. Cumulative thermal effects and threshold temperature effects in response to thermal extremes decrease the accuracy of predictions of climate change responses based on mean temperatures [56]. Using TPCs to accurately predict responses to thermal extremes will require better characterizing performance above thermal optima and limits; quantifying the effects of time scale and time-dependent effects; and assessing how extremes will reduce performance beyond levels predicted by arithmetic means.
(c) Microevolutionary responses to climate extremes:
data and models
As summarized by Grantet al. [6], both laboratory (and meso-cosm) evolution studies and artificial selection experiments have been widely used to document evolutionary responses to increased mean temperature and high temperatures. These studies demonstrate evolution responses in mean fitness, opti-mal temperature and heat tolerance, but the results are of limited relevance to evolutionary responses of natural climatic extremes [6]. For example, artificial selection experiments typi-cally maintain a constant selection intensity (e.g. upper 5% of the distribution) on heat tolerance each generation, result-ing in a linearly increasresult-ing cumulative selection differential over time [57]. Laboratory and mesocosm evolution studies typically use a step change to a new, constant mean tempera-ture over time. But as described above (figures 1–3), natural climatic extremes occur infrequently and unpredictably; and theoretical models show that stochastic variation in selection reduces the evolutionary responses of populations to sus-tained, directional environmental change [10,11,58,59]. More realistic experimental designs will be needed to evaluate the evolutionary responses to extreme climatic events, and to identify their genetic bases [6]. In addition, extreme and low quality environmental conditions can sometimes reduce gen-etic variation and evolutionary potential of ecologically important traits [48,60,61].
Historical and long-term studies can provide invaluable information about phenotypic and evolutionary responses to recent climate change. Such studies have documented shifts in body size, coloration, phenology, life history and other traits [6]. A recent historical study of TPCs illustrates the potential importance of changes in extreme temperatures [62]. Common-garden experiments with populations ofColias butterflies (C. eriphylefrom Colorado andC. eurythemefrom California) were used to determine mean TPCs for short-term larval feeding at two time points: 1972 [63] and 2012 [62]. The upper thermal limits of the performance of each species increased by 3–68C during this 40 year period. Data from GHCN weather stations (USC00055722 in Montrose, CO and USW00023271 in Sacramento, CA) were used to
quantify air temperature distributions at each site in the decade prior to each time point. Mean environmental temp-eratures during the active growing season did not change substantially (less than 18C) over the time period at either site; however, the frequency of high temperatures (more than 288C) more than doubled at each site during this period. In contrast, there was little change in the frequency of low temperatures.
To estimate changes in GEV distributions during this 40-year period, we used daily maximum temperatures across summer months (June through September) from each site. The GEVs shifted to higher temperatures and narrowed in both Colorado (means+s.e. of maximum-likelihood fits; 1961–1971: location¼26.92+0.14 and scale¼4.73+0.10; 2001–2011: location¼28.14+0.14 and scale¼4.71+0.10) and California (1961–1971: location¼30.64+0.14 and scale¼4.87+0.10; 2001–2011: location¼31.58+0.13 and scale¼4.60+0.09). Small increases in the thickness of the tail suggest increases in the incidence of thermal extremes in both Colorado (1961–1971: shape¼20.51+0.01; 2001– 2011: shape¼20.47+0.01) and California (1961–1971: shape¼20.36+0.01; 2001–2011: shape¼20.35+0.01). Only the increase in location in Colorado and the decrease in breadth in California are significant. More notable is the increase in the proportion of heat events. The percentage of years reaching maximum temperatures exceeding the 1961–1971 95th percentile increased from 2.9% to 9.7% in Colorado and from 4.8% to 6.5% in California (exceedance rate from generalized Pareto distribution). This highlights the utility of GEVs in characterizing shifts in the incidence of extreme events relevant to selection on thermal tolerance.
These findings suggest that the increasing frequency of high temperatures during the past 40 years has led to increased upper thermal limits in these populations. Interestingly, the evolution-ary shifts in the performance curves were quite different in the two populations: inC. eriphylefrom Colorado, the optimal temperature but not thermal breadth increased; whereas in C. eurythemefrom California, thermal breadth but not optimal temperature increased. These different responses may stem from the growth season remaining restricted to summer in Colorado but expanding in recent decades in California.
As discussed above (and see [14]), the evolutionary conse-quences of thermal extremes depend on whether thermal stress causes variation in survival (e.g. viability selection) or in reproduction (e.g. mating success or fecundity selection). In varying thermal environments, viability selection favours the evolution of thermal generalists [44], whereas fecundity selection favours the evolution of thermal specialists [64]. Several recent studies have combined these two effects and integrated performance curves, thermal tolerances and simple evolutionary models to explore how climate variation and extremes affect selection and evolutionary responses for ectotherms [65–67]. We will briefly describe two of these models to illustrate how analyses of extreme events can inform the results of these models.
Denny and Dowd [67] developed a model for the evolution of thermal tolerance (lethal temperatureTlethal, the body
temp-erature as which an individual dies), assuming a polygenic (10 additive loci) basis for genetic variation in Tlethal. They
assume a simple trade-off in which higherTlethalis associated
with a cost to reproduction at lower (non-lethal) temperatures. They implement this model for a large intertidal limpet (Lottia
rs
tb.r
oy
alsocietypublishing.org
Phil.
Trans.
R.
Soc.
B
372
:20160147
gigantea) that can sometimes experience deleteriously high body temperatures during low, midday tides. They combined a biophysical model that predicts the body temperature of lim-pets with fine-grained (10 min) data on thermal conditions in the intertidal zone at one site in central California. Using a bootstrapping approach to generate stochastic simulations of long-term environmental data [23], their evolutionary models predict that infrequent, extreme thermal events have important impacts on the evolution of thermal tolerance. For example, random, stressful events with mean return times of 2–8 years contributed strongly to the evolution of increased heat toler-ance because of the larger impacts of short-term mortality on total fitness and selection.
Following Kingsolver and Buckley [65], Buckley and Huey [66] combined additive (TPC for reproduction) and multiplica-tive (thermal threshold for survival) components of fitness in a discrete-generation, quantitative genetic model. Using environ-mental temperature data along latitudinal clines in Australia, they apply the model to the evolution of thermal performance and tolerance in Drosophila[66]. Even rare thermal extremes substantially influenced the evolution of TPCs, particularly when the extremes caused mortality or persistent physiological injury, or when organisms were unable to use behaviour to buffer exposure to extremes. The latitudinal gradient in thermal extremes is much shallower than that of mean temperatures in Australia; the model correctly predicted the evolution of a shal-low cline in thermal tolerance in Drosophila. Their analyses illustrate how the evolution of tolerance, and of the upper limits of TPCs, is driven more by infrequent extremes than by environmental means or variances [66]. Extending the model to include beneficial acclimatization and cumulative damage revealed that substantial mortality or other reductions in fitness differences among individuals lessen the evolutionary impacts of thermal extremes [33].
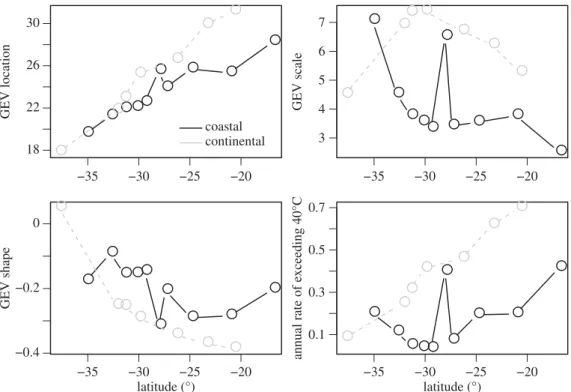
To further characterize latitudinal gradients in thermal extremes in this system, we use GEV distributions of
environmental temperatures along continental and coastal sites in Australia (see [66] for a description of the environ-mental data used). With movement toward the equator within Australia, GEV location shifts to warmer temperatures (figure 5). The GEV tails steadily thin in continental sites, but show less of a gradient and are more variable in coastal sites. The annual rate of exceedance increases steadily for continental sites, but remains relatively flat for coastal sites. The shallow gradients in the thickness of the tails of the distribution and exceedance rate revealed by GEVs are consistent with extremes influencing the evolution of thermal tolerance in Australia.
These selected historical and modelling studies illu-strate how infrequent, extreme thermal events can drive the evolution of both thermal tolerance and TPCs in ectotherms. Our analyses demonstrate how statistical ana-lyses of extreme events using the GEV framework can aid our understanding of such events and their biological consequences.
4. Suggestions for future directions
Thermal biology, including performance curves and toler-ances, has provided a productive, trait-based framework for quantifying the effects of climate variation and climate change on fitness and evolution for ectotherms. In this per-spective we have highlighted several important challenges in extending this framework to understand climate extremes, suggesting several avenues for future research.
First, a greater focus on the tails is needed. Extremes involve the upper end of the distribution of environmental conditions, and characterizing these tails requires different stat-istical tools from those used to quantify means and variances. We have illustrated how the GEV analyses can quantify the frequency and temporal patterns of extreme events and inform their biological consequences, and urge that these −35 −30 −25 −20
18 22 26 30
GEV location
coastal continental
−35 −30 −25 −20 3
4 5 6 7
GEV scale
−35 −30 −25 −20 −0.4
−0.2 0
GEV shape
−35 −30 −25 −20 0.1
0.3 0.5 0.7
annual rate of e
xceeding 40°C
latitude (°) latitude (°)
Figure 5.
The parameters of the generalized extreme value (GEV) distribution describing maximum daily temperatures (8C) show variable patterns across coastal
and continental latitudinal gradients in Australia. GEVs are characterized by three parameters: location, which indicates position; scale, which indicates breadth; and
shape, which indicates the thickness of the tail. We additionally depict the annual rate of exceeding a threshold of 408C.
rs
tb.r
oy
alsocietypublishing.org
Phil.
Trans.
R.
Soc.
B
372
:20160147
tools be applied more widely by biologists interested in climate change [18,22]. Similarly, the shapes of performance curves above optimal temperatures are poorly characterized, and biol-ogists often make convenient but arbitrary assumptions about curve shape near and above the upper limits. As a result, our inferences and predictions about responses to extreme temperatures may be weak or misleading. Characterizing the upper tails of performance curves will require changes in the design of experiments used to measure these curves.
Because extreme events are temporally structured (figure 3), the time-dependence of biological responses is also important. The effects of time scale on both TPCs and toler-ances are rarely considered, but they can have major impacts on mean performance and fitness in variable environments that include extreme conditions. In addition, because TPCs and tolerances are often measured at different time scales, integrating information from upper performance limits to lethal temperatures is problematic [33]. More explicit descrip-tion of both performance and tolerances as rates at specific time scales is needed in both empirical and modelling studies. Similarly, the effects of prior thermal history on performance and tolerance are widely documented, but rarely incorporated into models of climate change response.
Third, extreme thermal events may impact different com-ponents of fitness, and thus have major consequences for evolutionary responses. Extreme events may have both additive and multiplicative effects on overall fitness, so that quantifying the separate effects of performance and tolerance on survival, mating success and reproduction may be needed, instead of
aggregate fitness metrics such asr. Integrating the effects of variation in generation time on overall fitness will also be important [19].
Finally, most models for evolutionary responses to cli-mate change, including those summarized here, assume constant population size and constant phenotypic and gen-etic variation of performance and tolerance. Both of these factors are important, but assuming constant population sizes is particularly unrealistic in the current context: because most extreme events are stressful, they may generate large declines in mean absolute fitness and in population size, and strongly limit adaptive evolutionary responses [10]. Inte-grating ecological and evolutionary responses into models for population extinction and the evolution of thermal perform-ance and tolerperform-ance will be a major challenge for thermal biologists and evolutionary ecologists alike.
Data accessibility.R scripts required to access the climatological data and to reproduce the results in this paper are available from the Dryad Digital Repository: http://dx.doi.org/10.5061/dryad.5jg20 [68]. Authors’ contributions.J.G.K. and L.B.B. developed the ideas and wrote the paper; L.B.B. performed the GEV analyses.
Competing interests.We have no competing interests.
Funding.This research was supported in part by grants from the US National Science Foundation (grant no. IOS-1120500 to J.G.K., and DBI-1349865 to L.B.B.).
Acknowledgements. We thank R. Smith for introducing us to extreme value theory, R. Huey for constructive input, and two anonymous reviewers for useful suggestions on previous versions of the manuscript.
References
1. Schneider SH. 1993 Climate scenarios. InBiotic
interactions and global change(eds PM Kareiva, JG Kingsolver, RB Huey), pp. 9 – 23. Sunderland, MA: Sinauer Associates.
2. Fischer EM, Knutti R. 2015 Anthropogenic
contribution to global occurrence of
heavy-precipitation and high-temperature extremes.Nat.
Clim. Change5, 560 – 564. (doi:10.1038/ nclimate2617)
3. Trenberth KE, Fasullo JT, Shepherd TG. 2015
Attribution of climate extreme events.Nat. Clim.
Change5, 725 – 730. (doi:10.1038/nclimate2657)
4. Parmesan C. 2006 Ecological and evolutionary
responses to recent climate change.Annu. Rev. Ecol.
Evol. Syst.37, 637 – 669. (doi:10.1146/annurev. ecolsys.37.091305.110100)
5. Hoffmann AA, Srgo CM. 2011 Climate change and
evolutionary adaptation.Nature470, 479 – 485.
(doi:10.1038/nature09670)
6. Grant PR, Grant BR, Huey RB, Johnson MTJ, Knoll
AH, Schmitt J. 2017 Evolution caused by extreme
events.Phil. Trans. R. Soc. B372, 20160146.
(doi:10.1098/rstb.2016.0146)
7. Siepielski AM, Morrissey MB, Buoro M, Carlson SM,
Caruso CM, Clegg SM, Coulson T, DiBattista J, Gotanda KM, Francis CD, Hereford J, Kingsolver JG, Augustin AE, Kruuk LEB, Martin RA, Sheldon BC, Sletvold N, Svensson EI, Wade MJ, MacColl ADC. 2017 Precipitation drives global variation in natural
selection.Science355, 959 – 962. (doi:10.1126/
science.aag2773)
8. Endler JA. 1986Natural selection in the wild.
Princeton, NJ: Princeton University Press.
9. Lande R, Arnold SJ. 1983 The measurement of
selection on correlated characters.Evolution37,
1210 – 1226. (doi:10.2307/2408842) 10. Chevin L-M, Hoffmann AA. 2017 Evolution of
phenotypic plasticity in extreme environments.Phil.
Trans. R. Soc. B372, 20160138. (doi:10.1098/rstb. 2016.0138)
11. Chevin L, Lande R, Mace GM. 2010 Adaptation, plasticity, and extinction in a changing
environment: towards a predictive theory.PLoS Biol.
8, 357 – 365. (doi:10.1371/journal.pbio.1000357)
12. Kingsolver JG, Diamond SE. 2011 Phenotypic selection in natural populations: what limits
directional selection?Am. Nat.177, 346 – 357.
(doi:10.1086/658341)
13. Siepielski AM, DiBattista JD, Carlson SM. 2009 It’s about time: the temporal dynamics of phenotypic
selection in the wild.Ecol. Lett.12, 1 – 16. (doi:10.
1111/j.1461-0248.2009.01381.x)
14. Angilletta MJ. 2009Thermal adaptation: a
theoretical and empirical synthesis. Oxford, UK: Oxford University Press.
15. Kingsolver JG. 2009 The well-temperatured
biologist.Am. Nat.174, 755 – 768. (doi:10.1086/
648310)
16. Deutsch CA, Tewksbury JJ, Huey RB, Sheldon KS, Ghalambor CK, Haak DC, Martin PR. 2008 Impacts of climate warming on terrestrial ectotherms across
latitude.Proc. Natl Acad. Sci. USA105, 6668 – 6672.
(doi:10.1073/pnas.0709472105)
17. Sinervo Bet al.2010 Erosion of lizard diversity by
climate change and altered thermal niches.Science
328, 894 – 899. (doi:10.1126/science.1184695)
18. Vasseur DA, DeLong JP, Gilbert B, Greig HS, Harley CDG, McCann KS, Savage V, Tunney TD, O’Connor MI. 2014 Increased temperature variation poses a greater risk to species than climate warming.
Proc. R. Soc. B281, 20132612. (doi:10.1098/rspb. 2013.2612)
19. Kingsolver JG, Diamond SE, Buckley LB. 2013 Heat stress and the fitness consequences of climate
change for terrestrial ectotherms.Funct. Ecol.27,
1415 – 1423. (doi:10.1111/1365-2435.12145) 20. Bailey LD, van de Pol M. 2016 Tackling extremes:
challenges for ecological and evolutionary research
on extreme climatic events.J. Anim. Ecol.85,
85 – 96. (doi:10.1111/1365-2656.12451)
21. Coles S. 2001An introduction to statistical modeling
of extreme values. New York, NY: Springer.
22. Denny MW. 2016Ecological mechanics. Princeton,
NJ: Princeton University Press.
23. Denny M, Hunt LJH, Miller LP, Harley CD. 2009 On
the prediction of extreme ecological events.Ecol.
Monogr.79, 397 – 421. (doi:10.1890/08-0579.1)
rs
tb.r
oy
alsocietypublishing.org
Phil.
Trans.
R.
Soc.
B
372
:20160147
24. Buckley LB, Huey RB. 2016 Temperature extremes: geographic patterns, recent changes, and implications
for organismal vulnerabilities.Glob. Change Biol.22,
3829 – 3842. (doi:10.1111/gcb.13313) 25. Sunday JM, Bates AE, Dulvy NK. 2011 Global
analysis of thermal tolerance and latitude in
ectotherms.Proc. R. Soc. B278, 1823 – 1830.
(doi:10.1098/rspb.2010.1295)
26. rnoaa: ‘NOAA’ Weather Data from R. 2016 R package version 0.5.6 [Internet].
27. AghaKouchak A. (ed). 2013Extremes in a changing
climate: detection, analysis and uncertainty. New York, NY: Springer.
28. Parey S, Hoang TT, Dacunha-Castelle D. 2014 Validation of a stochastic temperature generator focusing on extremes, and an example of use of
climate change.Clim. Res.59, 61 – 75. (doi:10.
3354/cr01201)
29. Wang XL, Trewin B, Feng Y, Jones D. 2013 Historical changes in Australian temperature extremes as inferred from extreme value distribution analysis.
Geophys. Res. Lett.40, 573 – 578. (doi:10.1002/ grl.50132)
30. New M, Hulme M, Jones P. 1999 Representing twentieth-century space – time climate variability. Part I: Development of a 1961 – 90 mean monthly
terrestrial climatology.J. Clim.12, 829 – 856.
(doi:10.1175/1520-0442(1999)012,0829:
RTCSTC.2.0.CO;2)
31. Zhang X, Alexander L, Hegerl GC, Jones P, Tank AK, Peterson TC, Trewin B. 2011 Indices for monitoring changes in extremes based on daily temperature
and precipitation data.Wiley Interdiscip. Rev. Clim.
Change2, 851 – 870. (doi:10.1002/wcc.147) 32. Schulte PM, Healy TM, Fangue NA. 2011 Thermal
performance curves, phenotypic plasticity, and the
time scales of temperature exposure.Integr. Comp.
Biol.51, 691 – 702. (doi:10.1093/icb/icr097)
33. Williams CM, Buckley LB, Sheldon BC, Vickers M, Portner H, Dowd WW, Gunderson AR, Marshall KE, Stillman JH. 2016 Biological impacts of thermal extremes: mechanisms and costs of functional
responses matter.Integr. Comp. Biol.56, 73 – 84.
(doi:10.1093/icb/icw013)
34. Kingsolver JG, MacLean HJ, Goddin SB, Augustine KE. 2016 Plasticity of upper thermal limits to acute
and chronic temperature variation inManduca sexta
larvae.J. Exp. Biol.219, 1290 – 1294. (doi:10.1242/
jeb.138321)
35. Manenti T, Sorensen JG, Moghadam NN, Loeschcke V. 2014 Predictability rather than amplitude of temperature fluctuations determines stress
resistance in a natural population ofDrosophila
simulans.J. Evol. Biol.27, 2113 – 2122. (doi:10. 1111/jeb.12463)
36. Marshall KE, Sinclair BJ. 2012 The impacts of
repeated cold exposure on insects.J. Exp. Biol.215,
1607 – 1613. (doi:10.1242/jeb.059956) 37. Marshall KE, Sinclair BJ. 2015 The relative
importance of number, duration and intensity of cold stress events in determining survival and
energetics of an overwintering insect.Funct. Ecol.
29, 357 – 366. (doi:10.1111/1365-2435.12328)
38. Sorensen JG, Kristensen TN, Loeschcke V. 2003 The evolutionary and ecological role of heat-shock
proteins.Ecol. Lett.6, 1025 – 1037. (doi:10.1046/j.
1461-0248.2003.00528.x)
39. Somero GN. 2010 The physiology of climate change: how potentials for acclimatization and genetic adaptation will determine ‘winners’ and ‘losers’.
J. Exp. Biol.213, 912– 920. (doi:10.1242/jeb.037473) 40. Huey RB, Kingsolver JG. 1989 Evolution of thermal
sensitivity of ectotherm performance.Trends Ecol. Evol.
4, 131 – 135. (doi:10.1016/0169-5347(89) 90211-5)
41. Kingsolver JG, Higgins JK, Augustine K. 2015 Fluctuating temperatures and ectotherm growth: distinguishing
non-linear and time-dependent effects.J. Exp. Biol.218,
2218–2226. (doi:10.1242/jeb.120733) 42. Ratkowsky DA, Olley J, Ross T. 2005 Unifying
temperature effects on the growth rate of bacteria
and the stability of globular proteins.J. Theor. Biol.
233, 351 – 362. (doi:10.1016/j.jtbi.2004.10.016)
43. Frazier M, Huey RB, Berrigan D. 2006
Thermodynamics constrains the evolution of insect
population growth rates: ‘Warmer is better’.Am.
Nat.168, 512 – 520. (doi:10.1086/506977)
44. Lynch M, Gabriel W. 1987 Environmental tolerance.
Am. Nat.129, 283 – 303. (doi:10.1086/284635) 45. Rezende EL, Tejedo M, Santos M. 2011 Estimating
the adaptive potential of critical thermal limits: methodological problems and evolutionary
implications.Funct. Ecol.25, 111 – 121. (doi:10.
1111/j.1365-2435.2010.01778.x)
46. Terblanche JS, Deere JA, Clusella-Trullas S, Janion C, Chown SL. 2007 Critical thermal limits depend
on methodological context.Proc. R. Soc. B274,
2935 – 2942. (doi:10.1098/rspb.2007.0985) 47. Terblanche JS, Hoffmann AA, Mitchell KA, Rako L, le
Roux PC, Chown SL. 2011 Ecologically relevant measures of tolerance to potentially lethal
temperatures.J. Exp. Biol.214, 3713 – 3725.
(doi:10.1242/jeb.061283)
48. Hoffmann AA. 2010 Physiological climatic limits in
Drosophila: patterns and implications.J. Exp. Biol.
213, 870 – 880. (doi:10.1242/jeb.037630)
49. Hofmann GE. 1999 Ecologically relevant variation in induction and function of heat shock proteins in
marine organisms.Am. Zool.39, 889 – 900. (doi:10.
1093/icb/39.6.889)
50. Chown SL, Terblanche JS. 2007 Physiological diversity in insects: ecological and evolutionary
contexts.Adv. Insect Physiol.33, 50 – 152. (doi:10.
1016/S0065-2806(06)33002-0)
51. Brett JR. 1970 Temperature. InMarine ecology,
vol. 1 (ed. O Kinne), pp. 515 – 560. New York, NY: John Wiley & Sons.
52. Diamond SE, Kingsolver JG. 2010 Environmental dependence of thermal reaction norms: host plant
quality can reverse the temperature – size rule.Am.
Nat.75, 1 – 10. (doi:10.1086/648602)
53. Kingsolver JG, Woods HA. 2015 Beyond thermal performance curves: modeling time-dependent
effects of thermal stress on ectotherm growth rates.
Am. Nat.187, 1 – 12. (doi:10.1086/684786) 54. Rezende EL, Castaneda LE, Santos M. 2014
Tolerance landscapes in thermal ecology.Funct.
Ecol.28, 799 – 809. (doi:10.1111/1365-2435.12268)
55. Niehaus AC, Angilletta MJ, Sears MW, Franklin CE, Wilson RS. 2012 Predicting the physiological performance of ectotherms in fluctuating thermal
environments.J. Exp. Biol.215, 694 – 701. (doi:10.
1242/jeb.058032)
56. Sheldon KS, Dillon ME. 2016 Beyond the mean: biological impacts of cryptic temperature change.
Integr. Comp. Biol.56, cw005. (doi:10.1093/ icb/icw005)
57. Falconer DS, MacKay TFC. 1996Introduction to
quantitative genetics, 4th edn. Essex, UK: Longman. 58. Huey RB, Kingsolver JG. 1993 Evolutionary
responses to extreme temperatures in ectotherms.
Am. Nat.143, S21 – S46. (doi:10.1086/285521) 59. Lynch M, Lande R. 1993 Evolution and extinction in
response to environmental change. InBiotic
interactions and global change(eds PM Kareiva, JG Kingsolver, RB Huey), pp. 234 – 250. Sunderland, MA: Sinauer Associates.
60. Hoffmann AA, Merila J. 1999 Heritable variation and evolution under favourable and unfavourable
conditions.Trends Ecol. Evol.14, 96 – 101. (doi:10.
1016/S0169-5347(99)01595-5)
61. Charmantier A, Garant D. 2005 Environmental quality and evolutionary potential: lessons from
wild populations.Proc. R. Soc. B272, 1415 – 1425.
(doi:10.1098/rspb.2005.3117)
62. Higgins JK, MacLean HJ, Buckley LB, Kingsolver JG. 2014 Geographic differences and microevolutionary changes in thermal sensitivity of butterfly larvae in
response to climate.Funct. Ecol.28, 982 – 989.
(doi:10.1111/1365-2435.12218)
63. Sherman PW, Watt WB. 1973 The thermal ecology
of someColiasbutterfly larvae.J. Comp. Physiol.83,
25 – 40. (doi:10.1007/BF00694570)
64. Gilchrist GW. 1995 Specialists and generalists in changing environments. I. Fitness landscapes of
thermal sensitivity.Am. Nat.146, 252 – 270.
(doi:10.1086/285797)
65. Kingsolver JG, Buckley LB. 2015 Climate variability
slows evolutionary responses ofColiasbutterflies
to recent climate change.Proc. R. Soc. B282,
20142470. (doi:10.1098/rspb.2014.2470) 66. Buckley LB, Huey RB. 2016 How extreme
temperatures impact organisms and the evolution
of their thermal tolerance.Integr. Comp. Biol.56,
98 – 109. (doi:10.1093/icb/icw004) 67. Denny MW, Dowd WW. 2012 Biophysics,
environmental stochasticity, and the evolution of
thermal safety margins in intertidal limpets.J. Exp.
Biol.215, 934 – 947. (doi:10.1242/jeb.058958)