NEIGHBORHOOD-LEVEL DETERMINANTS OF HIV AND CHRONIC DISEASE COMORBIDITY IN A SOUTH AFRICAN URBAN INFORMAL SETTLEMENT
Amy N. Huber
A dissertation submitted to the faculty at the University of North Carolina at Chapel Hill in partial fulfillment of the requirements for the degree of Doctor of Philosophy in the Department of
Epidemiology in the Gillings School of Global Public Health.
Chapel Hill 2017
ABSTRACT
Amy N. Huber: Neighborhood-level determinants of HIV and chronic disease comorbidity in a South African urban informal settlement
(Under the direction of Allison E. Aiello)
INTRODUCTION
The prevalence of chronic disease and HIV comorbidity is increasing in South Africa and
prevention strategies for this context are needed. In order to maintain the health of people living with HIV, it is necessary to move beyond the individual level and consider the characteristics of the neighborhoods and contexts to which the individual belongs.
METHODS
Using cross-sectional data from a randomized community survey conducted in Diepsloot, South Africa, we examined the distribution of HIV, hypertension, diabetes, and obesity, four highly prevalent chronic diseases at the neighborhood level. We mapped the distribution of each level of the HIV care cascade and each chronic disease using the Spatial Scan Statistic to identify hotspot areas. We then conducted a log binomial regression analysis to assess factors
associated with 1) living in an area of higher than expected HIV infectiousness; and 2) prevalent chronic disease among those with and without HIV.
RESULTS
hypertension, diabetes, and obesity prevalence were present and differed from the areas of high HIV prevalence. Individuals residing in a HIV infectiousness hotspot were more likely to be of higher education level (at least secondary school) (Prevalence Ratio=1.43, 95%CI: 1.14-1.78) and unemployed without government grant assistance (PR=1.21, 95%CI: 1.00-1.46). Controlling for other factors, HIV positive participants with a chronic condition were more likely to live less than 300 meters from the nearest supermarket (PR=1.21, 95% Confidence Interval(CI): 0.97-1.51).
CONCLUSIONS
Within a poor urban informal settlement in South Africa, we observed variation between
ACKNOWLEDGEMENTS
I would like to acknowledge and thank Dr. Allison Aiello, the chair of my dissertation committee. Dr. Aiello was supportive throughout the proposal and dissertation process and always pushed me by encouraging a high standard. Her support and flexibility to advise me after I left Chapel Hill for South Africa has allowed me to move my career forward while finishing up the PhD.
I would also like to thank my former advisor and committee member, Dr. Annelies Van Rie. Dr. Van Rie supported me during two summer practica at the Witkoppen Health and
Welfare Centre where I was able to work with the Mapping Study team to implement a new data collection tool. This experience resulted in Aim 1 of my dissertation and facilitated my
understanding of the different neighborhoods of Diepsloot, without which I would not have been able to fully understand the findings of this study.
I would also like to thank the members of my dissertation committee: Dr. Emch, Dr. Pettifor, and Dr. Miller for their time, guidance, and support during the dissertation process.
A special thank you to Jordan Cates, Ruth Link-Gelles, Nadja Violet, Liz Rogawski, Mag Assimon, Ricky Camplain, Sydney Jones, Nancy Colvin, and Valerie Hudock for all of their support during the PhD process.
TABLE OF CONTENTS
LIST OF TABLES………... x
LIST OF FIGURES………... xi
LIST OF TERMS AND ABBREVIATIONS……… xii
CHAPTER 1: BACKGROUND……… 1
1. HIV burden (epidemiology of HIV)………. 1
2. Chronic disease ………...… 4
3. HIV and chronic disease comorbidity burden ………. 7
4. Limitations of current HIV and chronic disease control in South Africa ………. 11
5. Neighborhoods and health theory ………... 11
6. Spatial distribution of disease ………..… 14
7. Limitations of current research ………. 16
8. Conclusions ………. 18
CHAPTER 2: RESEARCH DESIGN AND METHODS………... 19
1. Overview of study design and populations ………... 19
2. Data collection and measurement ………..… 22
3. Specific Aim One ………..…. 25
4 Specific Aim Two ………. 28
5. Specific Aim Three ……….... 31
CHAPTER 3: AIM 1 RESULTS………... 36
1. Introduction ………. 36
2. Methods ………...…… 38
4. Ethics statement ………. 42
5. Results ………..….. 42
6. Discussion ………...… 43
CHAPTER 4: AIM 2 RESULTS………... 50
1. Introduction ………. 50
2. Methods ………...…… 52
3. Data Analysis ………...…...54
4. Ethics statement ……….... 55
5. Results ……….... 55
6. Discussion ………..… 57
7. Conclusion ………..… 59
CHAPTER 5: AIM 3 RESULTS………... 67
1. Introduction ………..67
2. Methods ………...… 69
3. Data analysis ………..… 72
4. Ethics statement ……….… 73
5. Results ………. 73
6. Discussion ………...…… 75
7. Conclusion ……….. 77
CHAPTER 6: DISCUSSION……… 84
1. Introduction ………. 84
2. Summary of findings ……….. 85
3. Interpretation of finding………...…………86
4. Strengths and limitations ………...………89
5. Public Health Implications ………..…….. 92
LIST OFTABLES
Table 2.1 Overview of neighborhood characteristics collected from three data sources………. 26
Table 3.1 Fields present in the Neighborhood aesthetic data collection tool………. 47
Table 3.2 Overview of neighborhood characteristics collected from three data sources………...48
Table 3.3 Spearman’s rank correlation coefficient results comparing the
principal component index from three data sources………. 49
Table 4.1 Summary of measures for HIV outcomes ……….……….. 63
Table 4.2 Sociodemographic profile of cohort participants in Diepsloot, South Africa 2013-2014……….. 64
Table 4.3 Prevalence of HIV outcomes in participants in Diepsloot, South Africa 2013-2014………. 65
Table 4.4 Log binomial regression analysis of factors associated with
living within a cluster of HIV infectiousness in Diepsloot, South Africa 2013-2014………. 66
Table 5.1 Sociodemographic profile of cohort participants in Diepsloot, South Africa 2013-2014……….. 81
Table 5.2 Prevalence of chronic disease by HIV status in participants
in Diepsloot, South Africa 2013-2014………..… 82
Table 5.3a Log binomial regression analysis of factors associated with
prevalent chronic disease among those living with HIV in Diepsloot, South Africa 2013-2014….. 83
Table 5.3b Log binomial regression analysis of factors associated with
LIST OFFIGURES
Figure 1.1 HIV prevalence across sub-saharan Africa and South Africa (HSRC, 2012)……… 2
Figure 1.2 Schematic representation of the contributions of neighborhood environments to health inequalities (adapted from Diez Roux, 2010)……..……….. 11
Figure 2.1 Location of Diepsloot within South Africa………19
Figure 3.1 Distribution of findings from data collection tool………... 45
Figure 3.2 Average component for each individual by neighborhood from three data sources……… 46
Figure 4.1. Participant flow chart and refusal proportion by neighborhood……….. 60
Figure 4.2 The HIV care cascade compared to the UNAIDS 90-90-90 targets for Diepsloot, South Africa, 2013-2014………... 61
Figure 4.3. Prevalence of HIV (a), evidence of HIV infectiousness (b), and levels of the HIV care cascade (c, d, and e), by neighborhood in Diepsloot, 2013-2014………... 62
Figure 5.1 Supermarket locations in Diepsloot, South Africa 2013-2014………. 79
LIST OF TERMS AND ABBREVIATIONS
ART anti-retroviral therapy
GIS geographic information system GPS global positioning system HIV human immunodeficiency virus MSM men who have sex with other men PREP Pre-exposure prophylaxis (for HIV)
CHAPTER 1: BACKGROUND 1. HIV burden (epidemiology of HIV)
Worldwide burden of HIV
HIV was first identified in the 1980s as a disease causing immune deficiency in humans. Untreated cases resulted in death due to opportunistic infections within an average of 5-10 years after acquisition. Transmission of HIV occurs when the virus enters the body and is able to replicate in the host’s immune cells. Transmission can occur sexually, from mother to child, through untested blood transfusions, or via needle sharing. HIV was quickly identified as an epidemic in high-risk populations in the USA and by the mid-1990s a generalized epidemic was occurring in sub-Saharan Africa. Worldwide, there are an estimated 35.3 million people living with HIV [1].
Sub-Saharan burden of HIV
Sub-Saharan Africa is the region most heavily affected by the global HIV
epidemic, resulting in an estimated 23.5 million people living with HIV, representing 69% of the global burden [2]. The sub-Saharan African epidemic is considered to be a
generalized epidemic, defined as an epidemic that is self-sustaining through
heterosexual transmission [3]. This results in HIV transmission occurring in the general population and not only high-risk groups such as men who have sex with men (MSM) and injection drug users. The majority of cases are transmitted via heterosexual sexual intercourse, with the minority of cases acquired though mother-to-child transmission, MSM sex, and drug use. Main sexual risk factors include inconsistent or incorrect
a sexually transmitted infection (STI) [6]. The sub-Saharan region contributes a high level of HIV cases to the world burden, but there is heterogeneity in country-level prevalences (Figure 1.1). Out of the 45 countries in sub-Saharan Africa, 20 have a national prevalence below 2%, 12 between 2% and 5%, 9 between 5% and 15%, and only Botswana, Lesotho, Swaziland and South Africa have national HIV prevalence above 15% [7]. Improvement in treatment access in the region has resulted in a 32% decline in the number of people dying from AIDS-related causes from 2005 to 2011 [2].
Figure 1.1 HIV prevalence across sub-saharan Africa and South Africa (HSRC, 2012).
South African burden of HIV
South Africa is experiencing one of the largest HIV epidemics in the world. In 2012, the South African Human Sciences Research Council [8] estimated the
South African HIV treatment cascade
HIV prevention and testing campaigns were implemented throughout the 2000’s resulting in increased awareness of HIV status for South Africans. Combination
antiretroviral therapy (ART) was made available at government clinics to patients with a CD4 count below 200 in 2004, below 350 in 2011, below 500 in 2015, and the current recommendation it to start ART for a patient regardless of CD4 count (from September 2016 onward).
However, only those who know their status can be treated, with 62% percent of male and 45% of female HIV positive South Africans unaware of their status [8], and many more known positives not receiving adequate treatment, there is a great opportunity to increase the life expectancy and quality of life of HIV positive South Africans. A success of the HIV response in South Africa is that 31.2% of HIV positive South Africans are now on treatment and people living with HIV are now consistently living past middle age. The South African Human Sciences Research Council estimates 43% of people living with HIV above the age of 50 are on ART, though testing rates remain low in this population, with only 55% of those over 50 ever testing for HIV. Among those aged 50+, prevalence of HIV in urban informal settlements is 10% [8].
need to be minimized in order to increase the number of HIV-positive individuals reaching and maintaining viral load suppression.
Geographical differences in HIV risk/treatment success
Sub-saharan Africa has the highest prevalence of HIV, and the generalized nature of the epidemic results in a large proportion of the population at risk of HIV. However, geographical differences exist on a provincial and district level. Though the national average HIV prevalence (for those age 15-49) is 19%, the nine provinces range from 8% in the Western Cape province to 28% in KwaZulu Natal province. Gauteng province, the center of economic activity and the location of our study, has a prevalence of 18% [8]. Within the provinces, the HIV prevalence also varies based upon community type. Peri-urban areas and residential areas near major roads have been found to have higher HIV prevalence [11]. Within geographic boundaries, HIV risk and treatment outcomes vary by community type. Urban informal areas have higher HIV incidence and prevalence (30% prevalence for those aged 15-49), lower treatment proportion, and lower levels of HIV testing [8]. Additionally, rural areas are underserved for treatment access and when diseases progresses, treatment at tertiary hospitals is difficult to access.
2. Chronic disease Chronic disease burden
Chronic diseases including diabetes, hypertension, and obesity are increasing in many developed countries. This trend is also beginning to occur in developing countries as residents adopt a western culture. Commonly, individuals have more than one
chronic disease comorbidity as two or more chronic diseases including: 1)
cardiovascular disease; 2) renal disease; 3) liver disorders; 4) osteopaenia; 5) endocrine and metabolic abnormalities including insulin resistance and diabetes; and 6) certain cancers.
In this study, we focus on the chronic diseases of diabetes, hypertension and obesity. Each of these diseases is on the pathway to adverse health outcomes such as coronary heart disease, heart failure, and stroke and the prevalence of these conditions is increasing throughout the world. Chronic diseases require ongoing clinical
management, either through pharmaceutical intervention (for hypertension and
diabetes), or continued medical appointments for obesity. The chronic disease burden on the health care system requires constant contact with the patient. Many of these issues are very difficult to completely resolve, so the many individuals have a drug burden from diagnosis until the end of life. Additionally, we choose to examine diabetes, hypertension, and obesity because the disease endpoints of coronary heart disease, heart failure, and stroke are rare and difficult to accurately measure, especially in low-resource environments.
South African burden of chronic disease
Individual-level risk factors for chronic disease
Individual-level risk factors for chronic disease include: genetics, tobacco use, unhealthy diet, lack of physical activity, and poor access to preventive care. These risk factors show a strong gender pattern, with the 2003 South Africa Demographic and Health Survey showing that only 24% of men and 14% of women were sufficiently active, with a decline with increasing age [12]. Additionally, the prevalence of inactivity is higher in those living in urban areas, with similar differences with regard to gender.
Increased age is a risk factor for chronic disease. A nationally representative study in South Africa found that while only 9% of those aged 18-49 had two or more chronic conditions, 30% of those aged 50 and above had 2 or more conditions [18]. This is a concern as the HIV positive population ages. Currently, 10% of all people living with HIV are above the age of 50 [1]. Another risk factor for chronic disease is socioeconomic status (SES). Lower SES results in higher risk of developing chronic disease in
developed countries. Developing countries are increasingly seeing a similar trend, with some studies indicating SES influence differences by gender in developing countries [19].
One key issue to consider when examining chronic disease comorbidity is the prevalence of obesity, and whether obesity is considered a chronic condition. As women are more likely to be obese, when included in comorbidity measures, the difference in prevalence of obesity can often drive measures of comorbidity that include obesity as a chronic disease since these measures often sum the number of diseases.
Area-level studies
refined grains, sugar sweetened carbonated beverages, and processed meats [20]; 2) unaffordable healthy diet [21, 22]; 3) affordable motorized transportation; 4) lack of safe and affordable exercise options [12]. Most African studies of chronic disease have not taken any area-level factors into account [13, 15]. If a study does measure an area-level factor, it is commonly urban vs. rural residential area. These studies have consistently found found that individuals living in urban areas more likely to be obese [12, 23].
3. HIV and chronic disease comorbidity burden
HIV and chronic disease comorbidity have potential for significant public health burden
Increased treatment access has increased the life expectancy of people living with HIV [24] and reduced the incidence of AIDS-defining opportunistic infections. Among people living with HIV and on treatment, conditions not directly linked to HIV infection have increasingly dominated as causes of morbidity and mortality.
South African burden of HIV and chronic disease comorbidity
An effect of the increased life expectancy of people living with HIV is the incidence of comorbidity of HIV and chronic disease. In South Africa, the literature on prevalence of HIV and chronic disease is predominantly done in small populations, but one nationally representative sample of South Africans over the age of 50 estimated the diabetes prevalence to be 10% regardless of HIV status and the prevalence of
hypertension in HIV positive adults to be 76%, which was significantly higher than in the HIV-uninfected group [18]. This same study found that 29.6% of the population had two or more chronic conditions. In another study in rural KwaZulu-Natal, the prevalence of hypertension in a population with 24% HIV prevalence was 11.7% for Stage 1 and 7% for stage 2 and though the prevalence of overweight and obesity was lower in those with HIV, it was still high with 53% of HIV positive women having a BMI over 25 [27].
Gender, age, and low SES are individual-level factors associated with risk of HIV chronic disease comorbidity
In order to determine potential interventions to reduce the incidence of HIV and chronic disease comorbidity, it is important to determine factors associated with HIV and chronic disease in developing countries. However, most African chronic disease
comorbidity studies have not taken HIV status into account [13, 15, 23].
Studies examining HIV and chronic disease include one population-based study in rural South Africa where measures of HIV status and chronic diseases allow us to examine the effect of HIV status on individual chronic diseases. The authors found that holding age, gender, education, household wealth, marital status, and place of residence (urban/rural) constant, subjects with positive HIV status had lower prevalence of
treatment status [28]. Another study focusing on urban black women in Johannesburg found lower BMI in HIV+ women compared to those who were HIV-, but those with CD4 counts greater than 345 showed no difference in median BMI from HIV negative women, and had a higher prevalence of obesity [20]. Lastly, a study in rural KZN in a population with 24% HIV prevalence examined chronic disease prevalence by HIV status and concluded that HIV+ individuals have lower BMI and lower prevalence of hypertension than HIV negative individuals, though no adjustment was made for disease stage or treatment duration [27].
Chronic Disease Comorbidity
No African studies have looked explicitly at prevalence of multiple chronic diseases by HIV status. However, a study pooling data from 10 study sites across the USA examined comorbidity in a cohort of HIV+ individuals on ART. This study found a high prevalence of comorbidity, so we can infer that there is likely significant overlap in the chronic diseases reported in other chronic disease prevalence studies [26].
In addition to HIV status, gender is associated with individual-level differences in chronic disease comorbidities. The study also reports that chronic disease comorbidity prevalence differed by gender, with 74% of women and 66% of men presenting with 2 or more chronic conditions, and 12.9 and 8.6% respectively presenting with 5 or more chronic conditions [26].
African residents measured urban/rural differences, but did not present findings on HIV and chronic disease stratified by neighborhood type [18]. Studies examining BMI
differences in those with HIV compared to those who are HIV negative are inconclusive. A study in a rural population found that regardless of treatment status, individuals with HIV had a lower BMI than those who were HIV negative [27]. Another study of urban black females found BMI only varied for women with low CD4 counts and in HIV positive women with CD4 counts above 345, there was no difference in BMI compared to HIV negative women [20]. One consistent finding in these studies is the high prevalence of obesity in women.
To our knowledge, only one study has examined spatial and neighborhood effects of HIV and chronic disease in South Africa. This study of a rural area in KZN province found a cluster of higher than expected obesity prevalence (85.1% prevalence of obesity compared to mean of 58.4%) in the only urban township in the surveillance area [28]. No hypertension clusters were reported. However, after adjusting for individual-level factors, including HIV status, no clustering of overweight individuals remained. Though this research focused primarily on a rural area, the obesity cluster in the urban township indicates different contextual factors may be occurring in urban areas.
4. Limitations of current HIV and chronic disease control in South Africa
5. Neighborhoods and health theory
Structural factors are key to reduce disease burden from HIV in South Africa HIV/AIDS was the top cause of disease burden in South Africa. Vaccine
development has yet to bring a suitable candidate to market, and no cure for HIV is on the horizon. It is well documented that behavioral, biological, and structural factors are major factors in the spread of HIV and chronic disease [8, 32]. Many interventions have been implemented in order to modify individual-level behavior with inconsistent results. In order to maintain health of people living with HIV, it is necessary to consider the characteristics of the neighborhoods and contexts to which the individual belongs. Structural factors such as the safety of the neighborhood, the built environment, and quality of housing contribute to HIV incidence by affecting behavioral mediators and stress, which can increase negative health outcomes such as reduced ART adherence, chronic disease and high HIV risk behavior [33] (Figure 1.2). The recognition that
structural factors contribute to HIV and chronic disease has led to a search for structural factors that may provide new options for health interventions.
Figure 1.2 Schematic representation of the contributions of neighborhood environments to health
The urban environment has disproportionately high HIV prevalence
Currently 60% of South Africans live in urban areas, with urban growth across Africa increasing. As urbanization continues in South Africa, the number of informal settlements located on the edge of urban areas continues to increase [34]. South African residential areas are commonly broken down into three categories: urban, peri-urban, and rural. In addition to these definitions, the history of apartheid in South Africa has added another layer of terminology to the description of residential areas. Under apartheid, racial classes were systematically displaced into suburbs and townships. Black South Africans were relocated to areas referred to as “townships” or “locations”. Soweto and Tembisa are examples of these all-black residential areas. In this paper, we refer to these areas as townships.
Neighborhood context can impact the health and wellbeing of individuals
Neighborhood disorder and crime, which are common in urban areas, can result in psychosocial stress, decreased social connectedness and/or mental illness including depression and post-traumatic stress disorder. Furthermore, mental illness has been shown to increase HIV risk behavior [36] and decrease ART adherence [37]. Based upon this pathway, we hypothesize that there is a link between neighborhood context and health outcomes (HIV incidence, treatment outcomes, chronic disease) in African urban areas.
The built environment is one measure of the neighborhood context that could be key to health outcomes [38]. There is evidence from developed countries that the built environment impacts chronic diseases such as obesity [39] and diabetes [40], and infections diseases such as Gonhorrhea [41]. The one available study of the built environment and HIV in South Africa shows that the built environment can impact risk behavior [42].
Although neighborhood-level factors are not usually considered part of national health services infrastructure, evidence-led neighborhood-level interventions have been highlighted as a focus for South African health research. In order for neighborhood-level interventions to be created, it is key for our research to help determine structural level factors that are associated with poor health outcomes.
6. Spatial distribution of disease
Definition and overview of the study of spatial disease distribution
Disease risk and prevalence are not uniformly distributed across populations and instead tend to cluster. These clusters can occur at a variety of levels that can be
improvements in Geographical Information Systems (GIS) and an increase in the availability of geographically referenced data have allowed for new methods to geographical disease variation.
Uses of spatial distribution findings
The spatial structure of a disease in a population can affect the persistence, disease dynamics, treatment success, and the cost effectiveness of interventions. With ever-present limits on public health resources, new strategies are essential to optimize interventions. GIS methods offer many benefits to public health research, including the ability to elucidate new associations between the physical environment and health events and to aid in detection of high-risk or underserved populations [43]. Another major advantage of GIS methods is that by mapping the spatial variability of a disease, GIS methods provide information to target limited public health resources, increase efficiency of interventions, and allow programs to create realistic targets in areas of high variability in risk factor or disease prevalence. Lastly, mapped results may speed the implementation of research findings, as policy makers prefer to visualize geographic distribution when deciding on interventions. Through these mechanisms, GIS methods are able to provide many advantages over non-spatial epidemiological approaches.
prevalence and HIV-related mortality, Agincourt in Limpopo province and the Africa Centre in KwaZulu-Natal province [50, 51]. Studies conducted in rural areas of South Africa and Malawi have found hot spots of higher than expected HIV prevalence near national roads [11, 43]. GIS has also been used to estimate measures of proximity and access to health resources [52], distribution of behavioral risk factors [53], and
distribution of stigma [54]. However, few studies have examined neighborhood-level factors with regard to HIV outcomes. A single national-level study conducted in Malawi examined neighborhood-level factors and found that they had influence on HIV
prevalence [43].
As HIV transitions into a treatable chronic disease, few studies have examined factors associated with effective treatment or HIV and chronic disease comorbidity. With regard to treatment, a study in Philadelphia found that each level of the HIV treatment cascade had different spatial hot spots [55]. Additionally, a study in rural South Africa assessed ART coverage by SES and found that distance to the clinic was significant, even after adjusting for individual-level factors and urban/rural neighborhood [52]. The spatial and neighborhood-level factors associated with long-term health for urban, HIV positive individuals remain unknown. One clinic-based study assessed the treatment cascade in an urban setting in South Africa, but did not assess spatial variation [10].
7. Limitations of current research Study population
countries, the majority derive from rural areas. A population-based research site called The Africa Centre has conducted most of the research into spatial determinants of disease in South Africa. However, this rural site cannot represent the urban South African population because there are different contextual factors. For example, findings from rural areas mainly report proximity to national roads as significant, but this finding does not translate to a well-connected urban environment [11, 43]. Though sub-Saharan Africa is rapidly urbanizing, no studies have conducted an in-depth analysis of the neighborhood-level effects of an urban township on HIV and chronic disease.
Study design and measures
Many of the studies conducted on this topic are cross-sectional studies, with a dearth of longitudinal studies, especially with regard to neighborhood-level factors. There is also limited information on how geographic factors relate to access to and retention in HIV care. Many treatment-focused studies are RCT or clinic-based research cohorts. The absence of a population-based recruitment strategy restricts the ability to analyze community-level factors and makes it impossible to measure barriers to health care in these populations, since they have both awareness and access to health services.
Spatial scale of data
When conducting spatial analysis, health outcomes are frequently aggregated to geographical scales that are too large to be used for detailed analysis of health
the average at the aggregate level. When this is the case, no inferences can be made at a level below the aggregated scale, and factors operating at the local level will be
overlooked.
Neighborhood-level analysis
The majority of studies only measure and adjust for individual-level exposures, covariates, and outcomes. If neighborhood-level data is analyzed, the variable is often an aggregate measure based on self-report from individual study respondents, instead of a neighborhood-level measure collected from community spaces by trained research staff. Additionally, few studies have a framework for the mechanism of the spatial factors on individual health, a gap that has been highlighted by field leaders [33].
Research on HIV treatment has focused primarily on the negative effects resulting from inadequate treatment with less attention to given to factors that shape adherence, both at the individual and community level. Most of the research on this topic has been out of one rural area with high HIV prevalence. This research will provide new evidence from a different highly mobile population that better represents the vulnerable highly mobile urban residents.
8. Conclusions
successfully reduce the rate of comorbidity, distribution and determinants in the urban population need to be described.
CHAPTER 2: RESEARCH DESIGN AND METHODS 1. Overview of study design and populations
Study population
Diepsloot is a township on the northwestern periphery of Johannesburg, South Africa, with a population of over 500,000 residing in an area of approximately 12 km2 (Figure 2.1). Housing varies between the 13 neighborhoods and is a mixture of corrugated iron shacks, Reconstruction and Development Programme (RDP) houses, and bonded houses. Access to municipal service varies, with some neighborhoods fully electrified and supplied with indoor plumbing, while others are highly informal with little access to electricity and water access at community taps. Access to health care within Diepsloot is limited to two overburdened public clinics and the nearest public tertiary hospital is 30 kilometers away.
The population is 61% female, 100% black race, and 29% of the population is youth between the age of 20 and 29 years [56]. Twenty two percent of the population is unemployed, and a further 61% are employed in informal or temporary employment. Diepsloot has high levels of crime and violence, with 87% of the population feeling unsafe or very unsafe at night [56].
Study design
The data derive from the Diepsloot Community Mapping Project (USAID Innovations Grant AID-674-A-12-00033) which took place from May 2013 to March 2014. The overall aim of the study was to quantify the disease burden and to develop a geographic risk profile for Diepsloot, South Africa. The study design was a cross-sectional community assessment of the prevalence of health factors in Diepsloot. At study initiation, the burden of HIV, TB, and other chronic diseases was not well understood for this population.
Using GIS software, 2000 GPS points were randomly placed within the residential area of Diepsloot. Study outreach teams drove into Diepsloot and
approached an adult member of the household closest to the GPS point. If there was no household within 30 meters of the GPS point, this was noted and the point was not used. If the adult member of the household agreed to participate, all household members aged 15 and above were enumerated and one was randomly chosen to participate in the interview.
The enrollment criteria for the study were: Inclusion criteria
· Consenting adult household members (≥ 18 years)
· Adolescent and child household members aged 7-17 years from whom assent is obtained and for whom consent is given by a parent or legal guardian.
Exclusion criteria
· Individuals in any household declining initial enumeration
· Unable to understand consent document in English, Zulu or Sesotho.
· The randomly selected survey participant is unavailable after five visits by the
survey team.
· The randomly selected survey participant declines participation in the study.
· Children under 18 years without parent or legal guardian consent.
· Households headed by a child. A child is defined as anyone aged less than
18 years.
· Adults or children who are psychologically or physically (e.g. drunk) unable to
provide informed consent were excluded.
Informed consent was conducted and the participant was enrolled to participate in a once-off interview and health assessment. If the enumerated household member was female, had children and gave consent, a child health assessment was conducted on each child. The outreach teams, composed of a nurse and an HIV counselor, measured HIV status, urine glucose, blood pressure, BMI, and conducted a
questionnaire including questions about demographic factors, socioeconomic status, health history, behavioral HIV risk factors, HIV care initiation for each study participant.
2. Data collection and measurement
The following information was collected for consenting participants in the Diepsloot Community Mapping Project:
HIV status:
HIV status was measured using self-reported result of last HIV test and finger prick rapid HIV test using a Determine Rapid antibody test. Participants were able to choose one of four HIV testing options:
1) Receive HIV counselling and testing with the survey team and receive the result immediately;
2) Receive HIV counselling and testing with the survey team and receive the result at Witkoppen clinic;
3) Receive pre-test HIV counselling with the survey team and provide an anonymous sample for research purposes only- the participant was not able to later find out the result;
4) Refuse HIV testing.
Fourty-seven participants self-reported HIV positive status and refused HIV antibody testing. We include these participants in the HIV positive category, but do not include those who self-report HIV negative status but refuse HIV testing as being negative, they are considered to be of unknown HIV status.
HIV care initiation and ART adherence:
Body mass index (BMI):
We defined overweight or obese status based upon height and weight measurements conducted by study staff at the time of the interview. Study staff measured height and weight for all participants. BMI was then calculated as: weight (kg) / height (m)2. BMI was categorized into the following categories [57]:
· Underweight: < 18.5
· Normal: 18.5–24.9
· Overweight: 25.0–29.9
· Obese: 30.0+
Urine glucose:
Diabetes status was measured by self-report and by urine glucose measured from a urine dipstick value. A urine dipstick value of of 2.8 mmol/L or greater was classified as “abnormal” and an indicator of diabetic status. We defined participants as diabetic if they self-reported a diabetes diagnosis, self-reported taking diabetes medication, or had an abnormal urine glucose measure at the time of the interview.
Hypertension:
hypertension medication, or if the average of three consecutive blood pressure measures at time of interview were above 140/90.
Demographic information:
Demographics were measured by self-report during the interviewer-administered questionnaire which measured gender, age, country of origin, education, employment, relationship status, socioeconomic indicators, and health history. Age was measured in years and analyzed as either a continuous variable or categorized as: 15-29, 30-39, 40-49, or 50-94. Country of origin was collected and then collapsed into South Africa or Other. Level of education was categorized as: Primary or less, Some
secondary/completed secondary, or Tertiary/Trade school. Employment status was categorized as: Formal employment, Informal/Self/Temp employment, or Unemployed. Relationship status was categorized as: Married, Not married but living with partner, Not living with partner, No partner. Socioeconomic indicators including household income, household assets, and food security were asked.
The following health history questions were asked for each chronic disease reported during the interview:
1. Has a health care worker ever told you that you have (chronic disease)? 2. Have you seen a doctor in the last 12 months for (chronic disease)? 3. Do you currently take any medications for (chronic disease)?
Behavioral HIV risk factors:
The following behavioral HIV risk factors were measured with an interviewer-administered questionnaire: 1) number of sexual partners in last 12 months; 2)
status of sexual partner (HIV positive, HIV negative, don’t know); 4) age of sexual partner (years); 5) condom use (average condom use and condom use at last sex act); 6) alcohol use before sex (yes/no).
Neighborhood aesthetic and built environment information:
Neighborhood aesthetic information was collected by trained staff for each visit point by a visual analysis by a trained staff member (Appendix 1). The staff member would stand in the road outside of the enumerated house and choose from predetermined categories to measure the number of trees, presence of wastewater, presence of streetlights, and the predominant housing type in the area. For this portion of data collection, participants did not give any information, it was only collected outside of the private residence by study staff. Additionally, the GPS point for all alcohol vendors, food vendors, and neighborhood facilities including clinics, schools, churches, police stations, and taxi ranks (Appendix 2).
3. Specific Aim One: To assess the built environment of an informal urban South African township.
Study design
There is a growing interest in the role of the built environment on health, but most built environment data collection tools are developed for use in the US or Europe. We compared the gain in insight in contextual factors using the newly developed tool to characterize the built environment of Diepsloot to the information available through census data as well as more traditional measures of contextual factors such as
and electricity. This information will guide the collection of neighborhood-level information for future epidemiological research in poor urban settings in Africa.
Assessment of variables
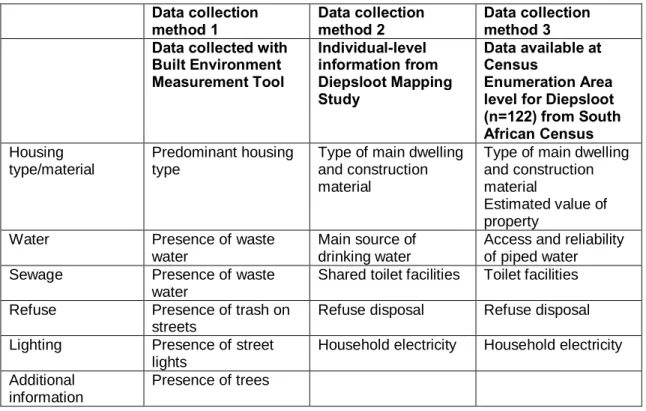
We compared three data sources for their ability to measure neighborhood characteristics (Table 2.1):
1) Built Environment Measurement Tool- Data collected from a data collection tool specifically created to measure the built environment in an urban South African township
2) Individual-level information from Diepsloot Mapping Study- Data collected from individuals consenting to the Diepsloot Community Mapping Project
3) South African Census data- Data on 177 Enumeration Areas (the smallest geographical area (piece of land) into which the country is divided for census) within Diepsloot collected during the 2011 South African census
Table 2.1 Overview of neighborhood characteristics collected from three data sources.
Data collection method 1 Data collection method 2 Data collection method 3 Data collected with
Built Environment Measurement Tool Individual-level information from Diepsloot Mapping Study
Data available at Census
Enumeration Area level for Diepsloot (n=122) from South African Census Housing
type/material
Predominant housing type
Type of main dwelling and construction material
Type of main dwelling and construction material
Estimated value of property
Water Presence of waste water
Main source of drinking water
Access and reliability of piped water Sewage Presence of waste
water
Shared toilet facilities Toilet facilities
Refuse Presence of trash on streets
Refuse disposal Refuse disposal
Lighting Presence of street lights
Household electricity Household electricity
Additional information
Analysis
Digital geographic data from the City of Johannesburg’s Geographic Information Systems (GIS) department was used to define community boundaries. The Transverse Mercator Hartebeesthoek projection was used to ensure distance measurements were accurate. We used the 13 extensions (Diepsloot’s neighborhoods) as the unit of analysis for the spatial analysis of neighborhood aesthetics.
Principal Components Analysis
To determine if the information obtained by the newly developed data collection tool corroborates or provides additional information not measured by aggregating individual-level information that obtained by individual-level questionnaires and
individual-level South African Census data, we first aligned the information spatially to the neighborhood and then compared the prevalence of each neighborhood
characteristic of interest. Because the neighborhood aesthetics information collected by the three data sources were not directly comparable, we conducted a principal
Census data as the information was continuous. We then used the principal axis method to extract the components, followed by varimax (orthogonal) rotation. We determined the number of meaningful components in several ways. First, the eigenvalue-one criterion was applied in order to retain and interpret any component with an eigenvalue greater than 1.00. We next conducted a scree test to identify components that group above breaks in the plot. We examined the common variance and assessed whether any of the components identified by the eigenvalue of the scree test method accounted for less than 5% of the variance. To ensure we had meaningful components, we assessed the overlap and interpretability of the solutions found by the different methods applied. We next removed any factors that loaded on multiple neighborhood variables and reviewed the remaining components with loadings greater than 0.40. Finally, we computed the variability-weighted component score and computed the average index score for each neighborhood for each of the three data sources. We then compared the neighborhood ranking for each of the three data sources using the Spearman’s rank correlation coefficient to assess whether neighborhoods were ranked similarly by the three data collection methods.
4. Specific Aim Two: Explore the spatial distribution and role of contextual factors in HIV prevalence in an urban informal settlement in South Africa
Study design
Using cross-sectional data collected in 2013-2014 from a GIS randomized
spatial distribution at three phases of the HIV treatment cascade: diagnosis, retention, and treatment. Based on these results, we are able to assess the possible role of contextual factors on the HIV care cascade.
Assessment of variables: Outcomes
The main outcomes of interest were neighborhood HIV prevalence, neighborhood HIV infectiousness, and neighborhood coverage of the steps of the HIV care cascade.
HIV status
All participants who did not self-report a known positive HIV status were offered an HIV test. Participants who agreed to test were given three options: home-based test with immediate test results, home-based test with disclosure of results at clinic on the following day, or anonymous testing for research purposes. Participants were
categorized as HIV positive if they self-reported to be HIV positive or had a positive rapid HIV antibody test; HIV negative if they had a negative rapid HIV antibody test; or HIV status unknown if they self-reported a HIV negative or unknown status but refused the rapid HIV antibody test.
HIV infectious
HIV care cascade levels
We categorized a participant as being in care if they self-reported that they were
receiving regular care for HIV. HIV positive participants were considered eligible for ART if their most recent self-reported CD4 count was ≤350 cells/μl. We categorized
participants as being on treatment if they self-reported being on ART. We categorized participants as adherent on ART if they self-reported that they followed their treatment schedule over the previous four days.
Exposure
Our exposure variable was the 13 neighborhood (called extensions) within Diepsloot. Digital geographic data from the City of Johannesburg’s GIS department were used to define community boundaries. The 13 neighborhoods vary with regard to service
delivery (some receive electrical power while others do not) and housing material (some are predominantly informal while others are made of concrete blocks). Because
neighborhoods of a similar size allow for better estimation of the variation in HIV
outcomes, we divided the five largest, most populous neighborhoods (Extensions 1, 2, 4, 6, and 7) into smaller sub-extensions.
Missing data on HIV status
Analysis
We used chi-square tests to compare age, gender, education status,
employment status, country of origin, and marital status between those with a known HIV status and unknown HIV status.
We assessed the spatial distribution of HIV outcomes using the ArcGIS geographic information system (GIS). We used the spatial clustering analysis in SaTScan™ (Martin Kulldorff, National Cancer Institute) [58, 59] to identify clusters of higher than expected prevalence by creating a circular window of various sizes to scan the study area. For each window, the number with the HIV outcome inside the window was compared to those outside of the window and a likelihood ratio test was used to evaluate the statistical significance of each potential hotspot. We used a spatial-only design with discrete Poisson distribution, maximum cluster size of 50% of the population at risk, and limited the clusters to those with no geographical overlap.
We used a log binomial model to examine whether age, gender, level of education, employment status, currently living with partner, alternative care in last 12 months, alcohol consumption, country of origin were associated with residing in a hotspot of HIV infectiousness. All covariates that were significant at a p-value of ≤ 0.10 when examining their relationship with the outcome were entered into the adjusted model. These variables were age, gender, level of education, employment status,
currently living with partner, alcohol consumption. Covariates not significantly associated with the outcome at p-value < 0.05 were eliminated from the model one at a time,
5. Specific Aim Three: Explore the spatial distribution and role of contextual factors in co-morbidity of HIV and chronic disease in Diepsloot, South Africa
Study design
Using the same 2013-2014 cross-sectional dataset from a GIS randomized community survey, we examined the distribution of HIV, hypertension and obesity, three highly prevalent chronic diseases in urban South Africa. We first mapped the distribution of each chronic disease, both individually and as co-morbidities, using the Spatial Scan Statistic to identify hotspot areas. We then estimated the magnitude of individual and contextual factors on chronic disease comorbidity using multilevel models by assessing the association between density and distribution of healthy food vendors and chronic disease comorbidity.
Assessment of variables Outcome
The main outcome of interest was HIV and chronic disease comorbidity, which was defined as having HIV and one or more of the following conditions: diabetes, hypertension, or a BMI (body mass index) greater than 25.
We defined participants as HIV positive if there was a positive result on the HIV antibody test conducted during the interview or if the participant self-reported a positive HIV status. HIV negative was defined as a negative result on the HIV antibody test. Those who self-reported an unknown or negative HIV status and refused the HIV antibody test were considered to be of unknown HIV status. We defined participants as diabetic if they self-reported a diabetes diagnosis, were taking diabetes medication, or had an abnormal urine glucose measure at the time of the interview. We defined
study staff at the time of the interview. BMI was calculated (weight(kg)/height2(cm)) and used to categorize participants into the following categories: underweight- BMI > 18.5; normal- BMI 18.5 to <25; overweight- BMI 25.0 to <30; obese- BMI ≥30 [60]. We defined participants as hypertensive if they self-reported a hypertension diagnosis, were taking hypertension medication, or if the average of three consecutive blood pressure
measures at time of interview were above 140/90.
We were interested in looking at predictors of chronic disease comorbidity in those living with HIV and those not living with HIV so we stratified our analysis by HIV status. This resulted in two models and a total of four exclusive groups in which a participant could be categorized. The first model assessed factors associated with chronic disease in those who were living with HIV. The second model assessed factors associated with chronic disease in those who were not living with HIV. In total, a participant could fall into one of the following categories: HIV+ and chronic disease, HIV only, chronic disease only, or neither HIV+ nor chronic disease positive
Exposure
The main exposure for this analysis was the distance from the individual’s
Covariates
We adjusted the analysis for the following individual-level covariates: age, gender, employment status, marital status, socioeconomic status and country of origin.
Missing data
Missing data on HIV status was explained in the Aim 2 methods section. Missing data on chronic disease outcomes is sparse with only 17 individuals missing blood pressure measures and 26 missing BMI. Due to the low prevalence of missing data for these measures, we conducted a complete case analysis for blood pressure and BMI.
Data analysis
We assessed whether the neighborhood context of Diepsloot, South Africa was associated with chronic disease comorbidity. All food vendors in Diepsloot were mapped and the map was then restricted to include only supermarket locations. The distance to the nearest supermarket was calculated using the ArcGIS distance function. Core areas where outcomes were disproportionately high or low were identified using spatial
clustering analysis in SaTScan™ (Martin Kulldorff, National Cancer Institute). We used a spatial-only design with discrete Poisson distribution, maximum cluster size of 50% of the population at risk, and limited the clusters to those with no geographical overlap.
CHAPTER 3: AIM 1 RESULTS
1. Introduction
Over the past two decades, numerous studies in North America, Europe, and Australia have demonstrated associations between neighborhood characteristics and health outcomes including chronic diseases, mental health, and infectious diseases [39-41, 61-65]. Aspects of the built environment that may positively influence health are access to physical activity, public open spaces, presence of supermarkets, and neighborhood walkability, while those that may negatively influence health include access to unhealthy food outlets and a degraded built environment [40, 62, 63, 66, 67]. These factors can influence situational opportunities and exposures that lead to
detrimental changes in behavior and increased stress, which can in turn result in negative health outcomes [33].
While great advances have been made in the measurement of neighborhood characteristics in the past decade, many issues remain. For example, the measurement of neighborhoods should correspond to the study hypothesis, which can either require an individual assessment, neighborhood-level assessment, or both [68]. This issue of model specification commonly arises when studies hypothesize effects at neighborhood level but only measure and adjust for individual-level factors. Furthermore, when
individual level and objective measure at the neighborhood level are not always correlated, [70, 71] and may have different implications for health [68].
Little is known about the effect of the neighborhood context on health in communities in low and middle income countries. The few studies published have demonstrated associations between degraded external built environment and mental illness in Kenya [67], neighborhood context and youth risk behavior in Cape Town [42], and the effect of local food environment on body mass index in Ghana [72]. Since few studies have been conducted in the developing world, there is a dearth of built
environment data collection tools, particularly in the urban context. The methodological issues experienced when measuring built environment in the US or Europe are thus magnified in resource poor areas as most built environment data collection tools have been developed for use in the US or Europe and then applied to other contexts without adaptation to appropriately measure the differing structural factors [73, 74]. Exceptions are studies in India and seven African countries (including South Africa) that adapted the Neighborhood Environment Walkability Scale to the local context [73-75]. Unfortunately, this tool requires a comprehensive, in-depth measurement of the built environment which is not feasible for most studies [76].
Understanding the impact of urban environments on health is of growing
importance given the rural-urban migration trend occurring in the developing world [38, 77-79]. In order to increase the quality of epidemiological studies assessing the effect of the built environment on the health of the population in resource-limited settings, low-cost simple data collection tools are needed. We created a tool to characterize the built environment of Diepsloot, South Africa, a peri-urban township. We described the neighborhood contextual factors using this tool, and compared the findings to
2. Methods
Study site and study population
The study was nested within the Diepsloot Community Mapping Project, a cross-sectional community-based survey which took place between May 2013 and March 2014. The parent study aimed to evaluate the geographic disease risk profile of
Diepsloot, South Africa. Diepsloot is a low-income, densely populated, urban township located on the northwestern periphery of Johannesburg. Within the approximately 12 km2 area of Diepsloot, the population is estimated to be over 500,000. The houses are a mixture of corrugated iron shacks, Reconstruction and Development Programme (RDP) houses (government subsidized housing), and cement block/brick houses. Access to municipal service varies, with some fully electrified and supplied with indoor plumbing, while others are highly informal without electricity and water access limited to community taps. Access to health care within Diepsloot is limited to three primary care clinics. The nearest public hospital is 30 kilometers away.
Data source 1: Neighborhood aesthetic and built environment information We created the Built Environment Measurement Tool to collect data on neighborhood characteristics in approximately 5 minutes by a lay person (HIV
counselor). We used the Nigeria-adapted Neighborhood Environment Walkability Scale as a starting point and selected elements that were considered valid for the Diepsloot environment given our visual assessment of the different neighborhoods and based on feedback from Diepsloot residents [73]. Staff members were trained to collect
neighborhood aesthetic information by conducting a visual analysis of the surroundings of selected GPS points to measure the number of trees, presence of trash and
wastewater, presence of streetlights, and the predominant housing type in the area (Table 3.1, Table 3.2).
Data source 2: Individual-level information
As part of the parent study, staff members collected individual-level clinical and demographic data as well as information about the type of main dwelling and its construction material, main source of drinking water, shared toilet facilities, refuse disposal, and access to electricity for lighting were collected (Table 3.2). We limited the analysis to 1184 of the 1231 individuals who completed the interviewer-administered individual-level questionnaire because the remaining had missing data for the analysis variables.
Data source 3: Census Enumeration Area information
The South African Census is conducted every 10 years and collects information on individuals living in South Africa [80]. We obtained information about residents of Diepsloot from the 2011 South African Census conducted by the South African
on an individual level and aggregated into 177 enumeration areas in order to preserve confidentiality. We analyzed 120 Census Enumeration Areas for this study because the remaining 57 had missing data for the analysis variables. Data collected included main dwelling type, construction material, tenure status, estimated property value, access and reliability of piped water, toilet facilities, refuse disposal, and access to electricity for lighting (Table 3.2).
3. Data analysis
Digital geographic data from the City of Johannesburg’s Geographic Information Systems (GIS) department was used to define community boundaries. The Transverse Mercator Hartebeesthoek projection was used to ensure distance measurements were accurate. We used the 13 extensions (Diepsloot’s neighborhoods) as the unit of analysis for the spatial analysis of neighborhood aesthetics.
Principal Components Analysis
To determine if the information obtained by the newly developed data collection tool corroborates or provides additional information not measured by aggregating individual-level information that obtained by individual-level questionnaires and
individual-level South African Census data, we first aligned the information spatially to the neighborhood and then compared the prevalence of each neighborhood
characteristic of interest. Because the neighborhood aesthetics information collected by the three data sources were not directly comparable, we conducted a principal
4. Ethics statement
This study was approved by the Human Research Ethics Committee of the University of the Witwatersrand and by the Institutional Review Board (IRB) of the University of North Carolina at Chapel Hill.
5. Results
Built environment data collection tool findings
The findings of the Built Environment Measurement Tool indicated clear diversity of neighborhood characteristics, with substantial differences between the 13
neighborhoods (‘extentions’) of Diepsloot, South Africa (Figure 3.1). Extensions 1, 12, and 13 had the fewest streetlights and trees, and highest amount of trash and
wastewater, whereas extensions 3, 4, and 9 had more streetlights and trees, and less trash and wastewater.
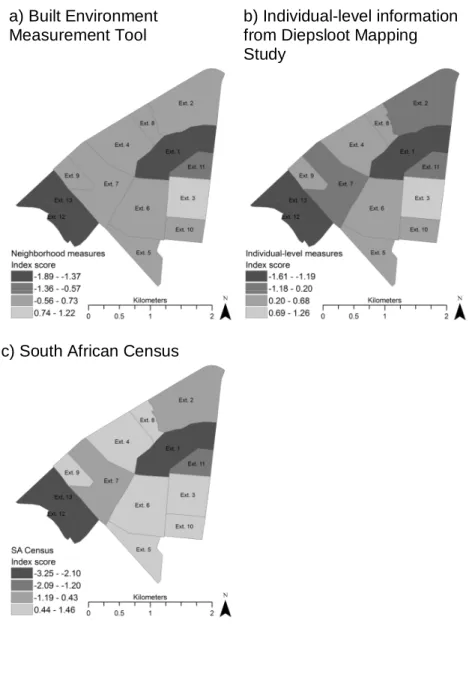
Principal components analysis
The average principal components analysis index score for each of the 13 neighborhoods obtained using each of the three data sources separately is shown in Figure 3.2. The ranking of the neighborhoods was similar for the three data sources, with extensions 1, 12, and 13 ranking lowest by all 3 methods and extensions 3, 5, 6, 9 and 10 ranking highest. The Spearman’s rank correlation coefficients indicated very strong correlations between the built environment tool and aggregated individual-level survey data (correlation coefficient 0.97) and between the built environment tool and
6. Discussion
Using a newly created, simple data collection tool, we were able to identify areas of higher and lower built environment characteristics within a single 12 km2 urban
informal settlement in South Africa. Using principal component analysis, we could quantify the built environment into a single index that could be used as a quantitative exposure variable in epidemiological studies aimed at determining the association between built environment and health outcomes. Different neighborhoods characteristics showed collinearity, with areas with a lower score for one measure (e.g. presence of wastewater) also having lower scores for other built environment characteristics (e.g. lack of streetlights).
We assessed whether the tool would rank the aesthetic of the neighborhoods in a similar order to rankings from different sources. We found that a 5 minute tool
developed to directly and visually assess the built environment ranked neighborhoods similarly compared to information obtained through aggregation of individual-level survey data or South African census data. Direct visual assessment of neighborhood
characteristics is faster (5 minutes per data point), requires less training and is less costly than interviewing individuals, which is often resource intensive, time-consuming, and may be subject to biases due to non-response or recall. However, if data collection is not possible, use of census is a valid option as the correlation between information obtained through the Built Environment Measurement Tool and the census data was high (Correlation Coefficient ≥ 0.80).
compared to individual-level self-report of perceived racial composition of a
neighborhood, the researchers found only 51% concordance between the two data sources [81]. Additionally, the United States census data on house ownership was compared individual-level socio-economic position indicators and these studies found a correlation between census-level measures such as percentage of housing units that were owner occupied and the individual-level measures of income, education and occupation [82, 83]. In order to determine which level of data to use, the data source must reflect the research question and ideally, a combination of individual and neighborhood-level factors should be included in the analyses [84].
Figure 3.1 Distribution of findings from data collection tool a) Street lights b) Trash
Figure 3.2 Average component for each individual by neighborhood from three data sources.
a) Built Environment Measurement Tool
b) Individual-level information from Diepsloot Mapping Study
Table 3.1 Fields present in the Neighborhood aesthetic data collection tool
Item Question Response
Trees Are there trees visible on the street in which the
selected dwelling is located (including trees in people’s backyards?
1. Little to no trees (0-4) 2. Some trees (5-19) 3. Many trees (20+)
Trash Is trash present? 1. Little to no trash (0-20 pieces, trash mainly in receptacles, small amount of loose trash on street)
2. Some trash (greater than 20 pieces, or 1-2 small piles)
3. Piles of trash (3 or greater large piles of trash) Wastewater Is open wastewater
visible?
1. No wastewater visible
2. Wastewater from dishes, bath water, car wash is visible (no foul smell)
3. Wastewater containing human excrement or with a foul smell is visible
Street lights Are there street lights visible on the street in which the selected dwelling is located?
1. No street lights visible 2. 1-5 street lights 3. 6 or more street lights
Housing Counting the selected dwelling and the closest 19 households (20 total), how many of the following housing types are visible from the street? (write number in space)
1. Standalone house non-RDP 1-2 rooms (brick) 2. Standalone house non-RDP 3 or more rooms
(brick)
3. Standalone house RDP (brick)
4. Townhouse/cluster house/semi-detached house (brick)
5. Flat in a block of flats (brick)
6. House/flat/room in backyard (brick) 7. Informal dwelling/shack in backyard
(corrugated iron, wood, other)
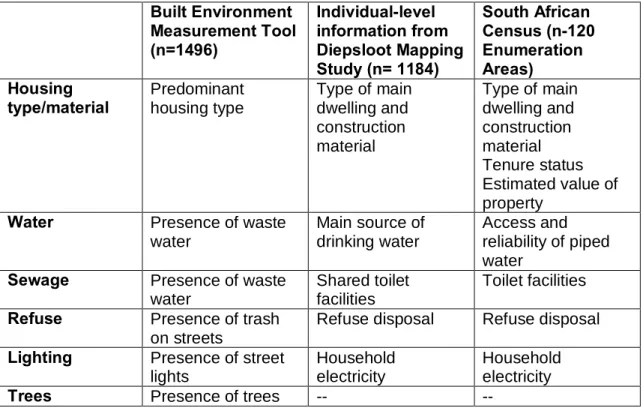
Table 3.2. Overview of neighborhood characteristics collected from three data sources. Built Environment Measurement Tool (n=1496) Individual-level information from Diepsloot Mapping Study (n= 1184)
South African Census (n-120 Enumeration Areas) Housing type/material Predominant housing type
Type of main dwelling and construction material
Type of main dwelling and construction material Tenure status Estimated value of property
Water Presence of waste water
Main source of drinking water
Access and reliability of piped water
Sewage Presence of waste water
Shared toilet facilities
Toilet facilities Refuse Presence of trash
on streets
Refuse disposal Refuse disposal Lighting Presence of street
lights
Household electricity
Household electricity
Table 3.3 Spearman’s rank correlation coefficient results comparing the principal component index from three data sources.
Comparison Correlation
coefficient
p-value Built Environment Measurement Tool vs. Individual- level
information
CHAPTER 4: AIM 2 RESULTS
1. Introduction
The HIV care cascade is used across the globe and has been incorporated into the UNAIDS 90-90-90 strategy for the year 2020 [85]. The definition of the HIV care cascade has varied in past research, [86, 87] but most studies [88] include some combination of the following six stages: 1) HIV infected; 2) HIV diagnosed; 3) linked to HIV care; 4) retained in care; 5) on ART; 6) suppressed viral load. The cascade has been shown to provide a conceptual framework to identify gaps in achieving population viral suppression [10] and help treatment providers identify and focus resources on the stages where HIV positive individuals are in the greatest need of interventions to meet the goal of viral suppression [87]. Few studies have examined and mapped the extent to which communities meet the HIV treatment care cascade. Such information could help to inform targeted health care delivery to efficiently use health resources at the local level.
Currently 60% of South Africans live in urban areas [79]. Urban growth promotes health inequities through the expansion of informal settlements (unplanned residential areas) where municipal authorities struggle to respond to rising demands for basic municipal services, social programs, and health care provision [35, 38, 89]. As