ENHANCING CAPACITY AND MANAGING DEMAND TO INCREASE SHORT-TERM THROUGHPUT ON THE SAN FRANCISCO-OAKLAND BAY BRIDGE
A Thesis presented to
the Faculty of California Polytechnic State University, San Luis Obispo
In Partial Fulfillment of the Requirements for the Degree
Master of Science in Civil and Environmental Engineering
COMMITTEE MEMBERSHIP
TITLE: Enhancing Capacity and Managing Demand to Increase Short-Term Throughput on the San Francisco-Oakland Bay Bridge
AUTHOR: Kevin Carstens
DATE SUBMITTED: December 2016
COMMITTEE CHAIR: Anurag Pande, Ph.D.
Associate Professor, Civil Engineering
COMMITTEE MEMBER: Robert Bertini, Ph.D., P.E.
Director, Center for Urban Transportation Research Professor, Civil and Environmental Engineering University of South Florida
COMMITTEE MEMBER: Cornelius Nuworsoo, Ph.D.
ABSTRACT
Enhancing Capacity and Managing Demand to Increase Short-Term Throughput on the San Francisco-Oakland Bay Bridge
Kevin Carstens
While there are many proposals for fixing congestion between San Francisco and Oakland in California by adding a new bridge or tube, these solutions will take decades to implement even though a solution is needed now. This thesis assesses sixteen different strategies for reducing congestion in the short-term in the four categories of improving transit, promoting carpooling, implementing intelligent transportation systems practices, and incentivizing alternatives to using the Bay Bridge. Top priorities include HOV improvements on the West Grand Avenue and Powell Street onramps, altering WestCAT Lynx and BART transit services, partnering with rideshare apps to increase transit station accessibility (last mile problem), partnering with vanpool/minibus apps, promoting carpooling and implementing a citizen report system for carpool violators, shifting corporate cultures away from requiring employees to drive and drive alone, and lastly, altering land-use planning practices. To reach this conclusion, an inventory of current proposals and relevant research was compiled. Ridership and capacity data for the various modes of transportation across the bay were assessed for shortfalls and opportunities. Through this research and its resultant conclusions, focus can be placed on the best strategies to pursue in the near-term, while the Bay Area waits on a second bridge or tube in the long-term.
ACKNOWLEDGMENTS
TABLE OF CONTENTS
Page
LIST OF TABLES ... xi
LIST OF FIGURES ... xii
LIST OF ACRONYMS AND ABBREVIATIONS ... xiv
CHAPTER 1. INTRODUCTION ... 1
1.1 EXISTING CAPACITY ... 2
1.1.1 Car ... 2
1.1.2 Bus... 3
1.1.3 Train ... 3
1.1.4 Ferry ... 4
1.2 INCREASING CAPACITY ... 4
1.2.1 Buses ... 5
1.2.2 Carpool ... 5
1.3 INCREASING DEMAND ... 5
2. LITERATURE REVIEW ... 7
3. TIME-DEMAND-CAPACITY ON THE TRANSBAY CORRIDOR ... 13
3.1 INTRODUCTION ... 13
3.1.1 Private Vehicles... 13
3.1.2 BART ... 14
3.1.3 AC Transit ... 14
3.1.4 WETA ... 14
3.1.5 WestCAT Lynx ... 14
3.1.6 SolTrans 200 ... 15
3.1.7 Data Processing ... 15
3.2 PEAK HOUR DATA ... 19
3.3 OVERALL DAILY DATA ... 21
3.4 DEMAND, CAPACITY, AND OCCUPANCY ... 23
3.4.1 Private Vehicles... 23
3.4.1.1 Bridge Capacity of Vehicles ... 23
3.4.1.3 Total Private Vehicle Capacity ... 26
3.4.2 BART ... 28
3.4.3 AC Transit ... 31
3.4.4 WETA ... 33
3.4.5 WestCAT Lynx ... 36
3.4.6 SolTrans 200 ... 38
3.4.7 All Modes ... 40
3.5 FUTURE CAPACITY TARGETS ... 43
4. ALTERNATIVE ANALYSIS ... 46
4.1 CAPACITY ENHANCEMENT ... 46
4.1.1 Strategy 1: Upgrade West Grand Avenue Onramp to Bus Lane Standards ... 46
4.1.1.1 Base Queue Jump Proposal ... 47
4.1.1.2 I-580 Ramp Queue Jump Extension ... 48
4.1.1.3 Maritime Intersection Queue Jump Extension ... 50
4.1.1.4 Overall Proposal ... 51
4.1.2 Strategy 2: HOV Improvements at Powell Street and I-80 in Emeryville ... 53
4.1.2.1 I-80 Right-Side HOV Lane ... 53
4.1.2.2 Improve HOV Access at Powell Street and I-80 ... 56
4.1.2.3 New Park-and-Ride at Powell Street under I-80 ... 57
4.1.3 Strategy 3: MacArthur Onramp Bus Lane ... 59
4.1.4 Strategy 4: Expand Bus Service ... 62
4.1.4.1 AC Transit ... 62
4.1.4.2 WestCAT Lynx ... 63
4.1.4.3 SolTrans Route 200 ... 66
4.1.4.4 Transbay Terminal ... 67
4.1.5 Strategy 5: Commuter Parking ... 67
4.1.5.1 SR-24 and Telegraph Avenue/56th Street ... 70
4.1.5.2 I-580 and Broadway/Piedmont Avenue ... 71
4.1.5.3 I-580 and Golf Links Road/98th Avenue ... 72
4.1.5.4 I-580 and Fairmont Drive/Foothill Boulevard ... 73
4.1.5.5 Benefits and Costs of Proposed Park-and-Ride Lots ... 75
4.1.5.7 Partnering with Rideshare Mobile Applications, an Alternative to More
Parking Capacity ... 76
4.1.6 Strategy 6: Partner with Developers of Ridesharing Mobile Applications ... 77
4.1.6.1 Vanpool/Minibus Apps ... 77
4.1.6.2 Casual Carpool Apps ... 79
4.1.7 Strategy 7: Enhanced Casual Carpooling ... 80
4.1.8 Strategy 8: Shifting Attitudes on Carpooling ... 82
4.1.9 Strategy 9: Increased Enforcement... 83
4.1.10 Strategy 10: Electronic Tolling at the Bay Bridge Toll Plaza ... 85
4.1.10.1 Golden Gate Bridge Toll Plaza Conversion Case Study ... 85
4.1.10.2 Relevance to Bay Bridge Toll Plaza Conversion ... 86
4.1.11 Strategy 11: BART Capacity Increases ... 87
4.1.11.1 Improving Train Capacity ... 88
4.1.11.2 Improving Station Capacity ... 89
4.1.12 Strategy 12: Altered BART Service ... 90
4.1.12.1 Skip-Stop “Metro” Service ... 90
4.1.12.2 Express Service ... 91
4.2 DEMAND MANAGEMENT ... 94
4.2.1 Strategy 13: Congestion Pricing ... 94
4.2.1.1 Congestion Pricing to Offset Demand... 95
4.2.1.2 Congestion Pricing to Increase HOV Occupancy ... 96
4.2.1.3 Relation of Toll Effectiveness to Parking Fare Rates ... 98
4.2.2 Strategy 14: Eastbound Tolling ... 98
4.2.2.1 Central Business District Congestion Tolling ... 98
4.2.2.2 Convert the Bay Bridge Toll Plaza into a Bidirectional Facility ... 100
4.2.3 Strategy 15: Changing Corporate Cultures ... 102
4.2.3.1 Promote Telecommuting ... 103
4.2.3.2 Changing Workplace Car Demands ... 105
4.2.4 Strategy 16: Land-Use Planning Changes ... 106
5. RECOMMENDATIONS ... 110
5.1 STRATEGY EVALUATION ... 110
5.1.1 Strategy 1: Upgrade West Grand Avenue Onramp to Bus Lane Standards ... 110
5.1.2.1 Convert the Right Lane of I-80 to HOV... 111
5.1.2.2 Powell Street Onramp Conversion to HOV and Adding More Movements to Access the Onramp ... 112
5.1.2.3 Park-and-Ride Lot ... 113
5.1.2.4 Overall Recommendation ... 113
5.1.3 Strategy 3: MacArthur Onramp Bus Lane ... 114
5.1.4 Strategy 4: Expand Bus Service ... 114
5.1.4.1 AC Transit ... 114
5.1.4.2 WestCAT ... 114
5.1.4.3 SolTrans ... 115
5.1.5 Strategy 5: Commuter Parking ... 115
5.1.5.1 I-80 and Buchanan Street ... 115
5.1.5.2 I-880 and Fruitvale Avenue ... 116
5.1.5.3 I-880 and High Street ... 116
5.1.5.4 I-580 and Fairmont Drive/Foothill Boulevard ... 116
5.1.5.5 I-580 and Golf Links Road/98th... 116
5.1.5.6 SR-24 and Telegraph Avenue/56th Street ... 116
5.1.5.7 I-580 and Broadway/Piedmont Avenue ... 116
5.1.5.8 BART Parking Capacity Increases ... 117
5.1.5.9 Partner with Ridesharing Apps for Station Access ... 117
5.1.5.10 Overall Recommendation ... 117
5.1.6 Strategy 6: Partner with Developers of Ridesharing Mobile Applications ... 118
5.1.7 Strategy 7: Enhanced Casual Carpooling ... 118
5.1.8 Strategy 8: Shifting Attitudes on Carpooling ... 119
5.1.9 Strategy 9: Increased Enforcement... 119
5.1.9.1 Adding HOV Facility Patrols ... 119
5.1.9.2 Citizen Reporting System ... 119
5.1.10 Strategy 10: Electronic Tolling at the Bay Bridge Toll Plaza ... 120
5.1.11 Strategy 11: BART Capacity Increases ... 120
5.1.11.1 Improve Train Capacity ... 120
5.1.11.2 Improve Station Capacity ... 121
5.1.12 Strategy 12: Altered BART Service ... 121
5.1.12.2 Express Service ... 122
5.1.13 Strategy 13: Congestion Pricing ... 122
5.1.14 Strategy 14: Eastbound Tolling ... 122
5.1.14.1 Downtown San Francisco Cordon ... 122
5.1.14.2 Convert the Bay Bridge Toll Plaza into a Bidirectional Facility ... 123
5.1.15 Strategy 15: Changing Corporate Cultures ... 123
5.1.16 Strategy 16: Land-Use Planning Changes ... 124
5.2 STRATEGY COST VERSUS BENEFITS ... 124
5.3 STRATEGY PRIORITIZATION ... 128
6. CONCLUSIONS... 132
6.1 RESEARCH LIMITATIONS ... 132
6.2 FUTURE RESEARCH GOALS ... 134
REFERENCES ... 136
APPENDICES A: MTC Element 1... 144
B: BATA Alternative 5: Powell St. / I-80 Ramp HOV Improvement ... 151
C: BATA Alternative 2: MacArthur Boulevard Bus Ramp ... 153
D: MTC Element 2... 155
E: MTC Element 3: Commuter Parking Lots ... 158
F: All Electronic Toll Collection Strategic Development Plan Financial Breakdown ... 160
G: BATA BART Alternative: Capacity Expansion Description ... 163
LIST OF TABLES
Table Page
3.1 Instances When WETA Ferry Service Hit Capacity ... 34
3.2 Vehicle Capacity Needed for Increased Demand ... 43
3.3 Vehicle Capacity Needed for Increased Demand, with Adjusted Mode Shares ... 44
4.1 Cost Estimate for I-80 Right-Side HOV Lane Improvements, Alternative 1 ... 54
4.2 Cost Estimate for I-80 Right-Side HOV Lane Improvements, Alternative 2 ... 54
4.3 Cost Estimate for MacArthur HOV Lane Extension ... 62
4.4 Park-and-Ride Lots in Northwest Alameda County ... 68
4.5 Breakdown of Bay Area Commuters by Mode ... 82
4.6 Express BART Example Schedule ... 94
4.7 Large Office-Based Employers in San Francisco ... 103
5.1 Roster of Strategies with Cost and Benefit Bins ... 125
LIST OF FIGURES
Figure Page
1.1 Bay Bridge Congestion (American Highway Users Alliance, 2015)... 1
1.2 AC Transit Transbay Bus Service (Alameda County Transit, 2015) ... 4
2.1 Bus on Right Using Shoulder to Jump Queue (MTC, 2011) ... 8
3.1 Westbound Person Throughput across the Transbay Corridor by Mode ... 17
3.2 Eastbound Person Throughput across the Transbay Corridor by Mode ... 18
3.3 Location of Relevant Transit Nodes in Downtown San Francisco ... 19
3.4 Westbound Peak Hour Transbay Trips by Mode ... 20
3.5 Eastbound Peak Hour Transbay Trips by Mode ... 20
3.6 Westbound Daily Transbay Trips by Mode ... 22
3.7 Eastbound Daily Transbay Trips by Mode ... 22
3.8 Average Bay Bridge Crossings by Hour in Terms of Passenger Car Equivalents ... 25
3.9 Westbound HOV and Non-HOV Counts by Hour ... 25
3.10 Westbound Actual Throughput and Theoretical Capacity of the Bay Bridge ... 27
3.11 Eastbound Actual Throughput and Theoretical Capacity of the Bay Bridge ... 27
3.12 Percent of Theoretical Capacity Used on the Bay Bridge ... 28
3.13 Westbound BART Transbay Tube Ridership and Seat Surplus or Deficit ... 30
3.14 Eastbound BART Transbay Tube Ridership and Seat Surplus or Deficit ... 30
3.15 BART Transbay Tube Seat Occupancy Rates ... 31
3.16 Westbound AC Transit Transbay Ridership and Seat Surpluses ... 32
3.17 Eastbound AC Transit Transbay Ridership and Seat Surpluses ... 32
3.18 AC Transit Transbay Occupancy Rates ... 33
3.19 Westbound WETA Transbay Ridership and Capacity Surpluses ... 35
3.20 Eastbound WETA Transbay Ridership and Capacity Surpluses ... 35
3.21 WETA Transbay Occupancy Rates ... 36
3.22 Westbound WestCAT Lynx Ridership and Capacity Surpluses ... 37
3.23 Eastbound WestCAT Lynx Ridership and Capacity Surpluses ... 37
3.24 WestCAT Lynx Occupancy Rates ... 38
3.25 Westbound SolTrans Route 200 Ridership and Capacity Surpluses... 39
3.26 Eastbound SolTrans Route 200 Ridership and Capacity Surpluses ... 39
3.28 Westbound Actual Throughput versus Excess Capacity and Occupancy Rate ... 41
3.29 Eastbound Actual Throughput versus Excess Capacity and Occupancy Rate ... 42
4.1 West Grand Avenue Queue Jump Overview ... 47
4.2 West Grand Avenue Before (a) and After (b) HOV Lane Extension ... 48
4.3 West Grand Avenue Before (a) and After (b) HOV Lane Extension Past I-580 Onramp ... 49
4.4 West Grand Avenue Before (a) and After (b) HOV Lane Extension Past Maritime Street Intersection ... 50
4.5 West Grand Avenue Onramp Upgrade Detail ... 52
4.6 I-80 HOV Lane Proposal, Split by Alternatives 1 and 2... 55
4.7 Powell Street Park-and-Ride Lot and HOV Onramp Improvements ... 58
4.8 Proposed Bus Reroutes to Serve Park-and-Ride Lot ... 59
4.9 MacArthur and I-580 HOV Lane Overview ... 60
4.10 East End Details (a) and West End Details (b) ... 61
4.11 Current (a) and Proposed (b) WestCAT Lynx and Route 30Z Operations ... 65
4.12 Park and Ride Lots in Northwestern Alameda County ... 69
4.13 Proposed SR-24 and Telegraph Avenue/56th Street Park-and-Ride Lot ... 71
4.14 Proposed I-580 and Golf Links Road/98th Avenue Park-and-Ride Lot ... 73
4.15 Proposed I-580 and Fairmont Drive/Foothill Boulevard Park-and-Ride Lot ... 74
4.16 Chariot’s Richmond Racer Route (Chariot, 2016a) ... 78
4.17 Bay Bridge Toll Plaza Congestion (Federal Highway Administration, 2011) ... 87
4.18 Platform Overcrowding Plagues BART During Peak Hours (Jones, 2016) ... 89
4.19 Time Savings from Eliminating Slow Segments (top) versus Increasing Top Speed (bottom) (Tang, Dick, & Caughron, 2016) ... 92
4.20 Detector Occupancy Rates at the Bay Bridge ... 95
4.21 SFCTA Proposal for Downtown Outflow Cordon Tolling (SFCTA, 2010a) ... 100
4.22 Advertisement for Walking to Work ... 107
4.23 Peak vs. Off-Peak Demand by Mode in the Westbound (a) and Eastbound (b) Directions ... 109
LIST OF ACRONYMS AND ABBREVIATIONS AADT Annual Average Daily Traffic
ABAG Association of Bay Area Governments AC Transit Alameda-Contra Costa Transit District
App Mobile Phone Application BART Bay Area Rapid Transit BATA Bay Area Toll Authority
Caltrans California Department of Transportation CBD Central Business District
CCCTA Central Contra Costa Transit Authority CHP California Highway Patrol
FAST Fairfield and Suisun Transit FTA Federal Transit Administration HOV High-occupancy vehicle
ITS Intelligent Transportation Systems MTC Metropolitan Transportation Commission
MW Megawatt
PeMS Performance Measurement System PPP Public-Private Partnership
RFID Radio-Frequency Identification SFCTA San Francisco County Transportation
Authority
SolTrans Solano County Transit
TOD Transit-Oriented Development VMT Vehicle Miles Traveled
WestCAT Western Contra Costa Transit Authority WETA Water Emergency Transportation Authority WSDOT Washington State Department of
1. INTRODUCTION
As anyone from the San Francisco Bay Area can attest, trying to get to San Francisco from the East Bay can be a nightmare during the morning peak period. Currently, there are four main ways to cross the Bay between Oakland and San Francisco: by car or by bus on the San Francisco-Oakland Bay Bridge, by train through BART’s Transbay Tube, or by ship on the San Francisco Bay Ferry. However, all of these modes are at capacity and straining to cope with the increasing travel demands of the region. The American Highway Users Alliance ranked the approaches of the Bay Bridge as the 12th and 16th most congested freeways in the US by miles of queue (American Highway Users Alliance, 2015). See Figure 1.1. Of note, only the congestion on the I-80 approaches are depicted, as evening eastbound congestion can extend to the I-280 interchange in San Francisco, and morning westbound congestion can extend well onto I-580 and I-880 in Oakland.
To deal with this demand, there are proposals to expand or build new infrastructure. For example, public officials have begun discussions on building a second Transbay Tube to relieve crowding in the existing tube, and provide additional capacity (Cabanatuan, 2015). However, this tube is at least 30 years off due to major financial and political challenges. Additionally, while a second Bay Bridge has never progressed beyond discussions, some proponents are advocating for its construction (Middlebrook & Mladjov, 2014). In light of recent experiences with challenges/delays these long-term infrastructure projects in California and elsewhere (e.g. high-speed rail) have faced, short-term solutions need to be explored to increase capacity across the bay while the long-term solutions (e.g. second Transbay Tube) are implemented.
1.1 EXISTING CAPACITY
This section outlines the four main ways to cross the bay: car, bus, train, or ferry.
1.1.1 Car
In order to cross the bay by car, one must either use the San Francisco-Oakland Bay Bridge or take extensive detours through the Richmond-San Rafael and Golden Gate Bridges to the north (around 27 miles), or San Mateo-Hayward Bridge to the south (around 45 miles). The bridge consists of five lanes in each direction, with a toll facility on the westbound direction on the east side of the bay. The annual average daily traffic (AADT) is 253,000 vehicles per day, or 25,300 per lane (Caltrans, 2015a). Of these, around 124,750 vehicles per day pay tolls (Bay Area Toll Authority, 2016). This makes sense, as tolls are only collected in one direction, and buses do not pay tolls. As will be discussed in Section 3.4.1, the peak hour demand per direction is around 8,000 to 9,500 vehicles.
not tolled, nor are pedestrians and bicyclists (Bay Area Toll Authority, 2016). However, at present pedestrian and cyclist access only extends from Oakland to Yerba Buena Island, and not all the way to San Francisco.
1.1.2 Bus
Each weekday, Alameda County (AC) Transit provides over 500 bus trips across the bay on 28 lines (Transbay Service, 2016). See Figure 1.2. AC Transit carries 13,500 riders per day, which puts the system over capacity during peak periods and results in many complaints about overcrowding (Hursh, 2015). WestCAT Lynx, operated by the Western Contra Costa Transit Authority, provides 53 daily weekday bus trips between Hercules and downtown San Francisco (WestCAT Lynx, 2015). Fourteen daily bus trips are provided from Vallejo directly to the Transbay Terminal by SolTrans Route 200, operated by SolTrans and administered by the Water Emergency Transportation Authority (WETA) (Water Emergency Transportation Authority, 2013).
Greyhound and Amtrak also provide buses over the Bay Bridge for longer distance travel. For instance, Amtrak California provides 30 weekday buses per day between San Francisco and Emeryville, where each bus connects with a Capital Corridor train with service to either San Jose or Sacramento (Capital Corridor Joint Powers Authority, 2015). However, these are typically excluded from commuter considerations as their service is more oriented to long-distance travel. Private companies such as Google provide private buses, but it is hard to assess their actual significance in terms of addressing capacity constraints during peak hours without fixed routes or schedules.
1.1.3 Train
Figure 1.2: AC Transit Transbay Bus Service (Alameda County Transit, 2015)
1.1.4 Ferry
The San Francisco Bay Ferry provides service from Oakland, Alameda, and Vallejo, to South San Francisco and several locations in San Francisco (San Francisco Bay Ferry, 2016). These routes carry 11,200 weekday passengers across the Bay (Water Emergency Transportation Authority, 2013). However, due to inadequate docking facilities, service is currently at or near capacity.
1.2 INCREASING CAPACITY
short-term (e.g. more ferries and docks) (Cabanatuan, 2015; Metropolitan Transportation Commission [MTC], 2009; Water Emergency Transportation Authority, 2014). Regarding the San Francisco-Oakland Bay Bridge, since vehicular capacity has been reached, increasing person throughput is going to necessitate increasing vehicular occupancy. MTC has been considering two options: increasing the effectiveness of buses and of carpooling.
1.2.1 Buses
In order to increase both bus ridership and bus throughput, several tactics are needed. These include tactics already underway, such as upgrading bus capacity at the new Transbay Terminal in San Francisco (Alameda County Transit, 2015). This will help reverse terminal capacity restrictions compared to the current temporary terminal by tripling the number of buses that can simultaneously be served. As well, AC Transit plans to purchase 10 double-decker buses to add capacity to the transbay corridor. In the long-term, AC Transit is planning to offer bus rapid transit (BRT) service on the Grand-MacArthur corridor to the Bay Bridge and downtown San Francisco (Alameda County Transportation Commission, 2011). This includes implementing transit signal priority, shoulder running, and HOV/bus only lanes in strategic locations.
1.2.2 Carpool
Another way to increase person throughput without relying on increasing vehicle throughput is to increase the number of persons per car. This is best done through incentivizing carpooling. MTC has already implemented some tactics, such as high-occupancy vehicle (HOV) priority lanes at the Bay Bridge toll facility, and reducing carpool tolls to $2.50 (compared to $6.00 for non-HOVs) (Bay Area Toll Authority, 2016). MTC is considering other incentives, such as extending managed lanes (HOV or other express lanes) or more park-and-ride lots.
1.3 INCREASING DEMAND
2. LITERATURE REVIEW
In order to arrive at solutions to the problem of demand exceeding capacity on the Bay Bridge, research on the feasibility and efficacy of various incentives for increasing person throughput is needed. In order to best perform this research, a review of existing literature is conducted. Solutions, best practices, and prior pitfalls can be gleaned from completed papers and integrated into this research. To this end, a variety of papers have been surveyed and their results compiled below.
In their “West Grand Avenue On-Ramp and Immediate Transbay Mobility Improvement Projects” presentation, MTC outlines four elements towards improving Transbay mobility: West Grand Avenue on-ramp shoulder running lane, adding new Transbay buses and encouraging existing AC Transbay buses on I-580 westbound to use West Grand Avenue, providing commuter parking, and improving on-demand shared mobility (MTC, 2011).
Element 1, adding a shoulder running lane to the West Grand Avenue on-ramp onto the approach to the Bay Bridge, will allow buses to skip queues that arise from the presence of the metering lights at the toll plaza. See Figure 2.1. This will require several modifications, such as improving drainage grate durability.
Element 2, adding new Transbay buses and encouraging existing AC Transbay buses on I-580 westbound to use West Grand Avenue, will improve run times and service reliability. New routes will add to transit rider versatility, and using West Grand Avenue in conjunction with Element 1 will allow buses to skip toll plaza traffic.
Element 3, providing commuter parking, calls for adding three new park-and-ride facilities along the I-80 and I-880 corridors around Oakland. These three lots will add 700 spaces of capacity for users to either join in carpooling or board a bus. The first three elements are estimated to cost $35.6m.
Figure 2.1: Bus on Right Using Shoulder to Jump Queue (MTC, 2011)
Further insight on proposed transbay improvements can be gleaned from BATA’s San Francisco Bay Crossings Study Update. This report updates the 2000 San Francisco Bay Crossings Study, taking the previous study’s conclusions and updating them with findings from the twelve years between reports (AECOM, 2012). This includes predictions for reduced travel demand and tolling revenue, and increased environmental and construction costs. Despite the reduced travel demand, demand is still predicted to exceed capacity on the existing bridges and the Transbay Tube by 2035.
East Bay to I-380 on the Peninsula, widening the San Mateo Bridge, and improving the approaches to the Dumbarton Bridge.
The report introduces three new BART crossing alternatives, four new transit improvement alternatives, and 19 highway improvement alternatives. Of these, it recommends all four new transit improvement alternatives: BART station capacity improvements, BART skip-stop “metro” service, a bus terminal in the East Bay, and expanding bus service. It also recommends four of the highway improvement alternatives: adding a bus ramp to MacArthur Boulevard, improving HOV access at Powell Street and I-80, and implementing open road tolling on the San Mateo and Dumbarton bridges. None of the new BART crossing alternatives were recommended for further study.
Another study on public transit was performed by Jochum et al. in their 2015 capstone project entitled “Comprehensive Public Transportation.” This paper is a university capstone project that analyzes a Columbus, Ohio, initiative to reduce single-occupancy commutes to 70% of the mode share (Jochum, Clendenin, Good, Mescher, & Blevins, 2015). The team analyzed the best practices of five different modes of transportation (car, bus, bike, walk, and rail) in five different cities (Indianapolis, Austin, Minneapolis, Charlotte, and Paris), and conducted an interview with a director of the Charlotte Area Transportation System. They concluded that Columbus should unify transportation administrations, work with employers to develop incentive programs for using transit, and implement HOV lanes and light rail.
One theory is that middle-income earners tend to live in auto-dependent suburbs, whereas both the wealthy and poor typically live in central cities, which are better supported by transit. A solution Belmonte mentions to increasing transit usage is to switch gas tax over to a VMT tax, which would incentivize shorter commutes. In addition, he proposes government-supported ridesharing arrangements and telecommuting. Belmonte concludes with a proposed inequality-density matrix that charts various incentives for transit usage against axes of income inequality and urban density. After determining local conditions and what specific solution is desired, various proposals can be analyzed based on where they fall on the matrix.
Another way to reduce VMT is detailed in Mark Goh’s 2002 paper “Congestion Management and Electronic Road Pricing in Singapore.” This paper details Singapore’s experience in preparing the island nation for congestion management and capping the roadway vehicle population (Goh, 2002). Since Singapore is such a small and dense nation, the standard strategy of matching congestion with roadway widening is not an option. As well, many users only consider the personal cost of automotive usage (gas, maintenance, time, etc.) and not the greater societal costs (adding to congestion, greenhouse gas emissions, etc.). The Singaporean government has realized this, and since the 1970’s has aggressively implemented a variety of tactics to curtail automotive usage, ranging from making purchases more expensive, to levying fees to enter the central business district (CBD), to expanding public transit. These approaches have had varying levels of success.
Another idea involving toll tags is Kalon Kelley’s 2007 “Casual Carpooling – Enhanced” proposal. This paper assesses a technology that could incentivize carpooling by means other than access to an HOV lane (Kelley, 2007). Traditionally, carpool is incentivized through access to special, often faster HOV lanes, or reduced tolls. This does not promote increasing vehicle occupancy beyond the minimum to receive this benefit, nor in areas without HOV or toll incentives. Kelley proposes a system where each commuter carries a radio frequency identification device (RFID) that connects to the driver’s device and chimes in whenever passing a special gantry. This could help promote maximizing car occupancy and carpooling in places where HOV lanes or tolls are impractical (such as surface streets).
This system could also increase personal safety by ensuring that all drivers and passengers are held accountable by association with their RFID card and by extension, file on record. This could create a review system similar to Uber or other ridesharing programs, where passengers can see a driver’s ratings and vice versa. Lastly, supply and demand can be managed by increasing occupancy requirements during the most congested times of day, or increasing rewards for drivers who go to underserved casual carpool nodes.
One telling piece of evidence is that structural incentive programs, such as fee reduction or exemption for carpools, and ride-matching services, affect carpool rates by only one percent. Wang and Chen conclude that instead, psychosocial factors should be promoted as they are why most carpoolers made the switch. One proposed solution is to raise the commuting population’s awareness about the costs, personal and societal, of driving alone.
3. TIME-DEMAND-CAPACITY ON THE TRANSBAY CORRIDOR
3.1 INTRODUCTION
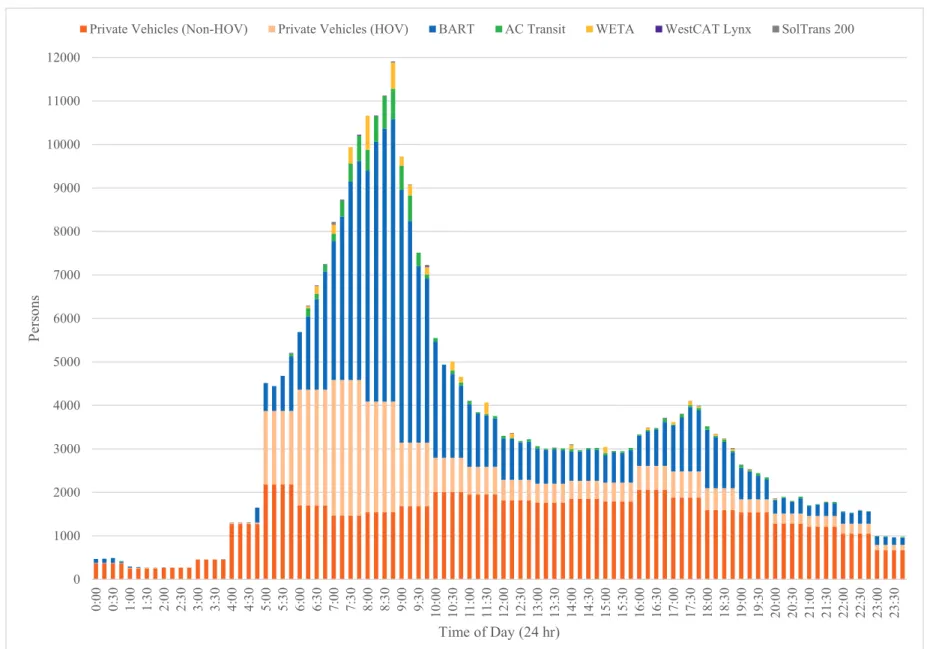
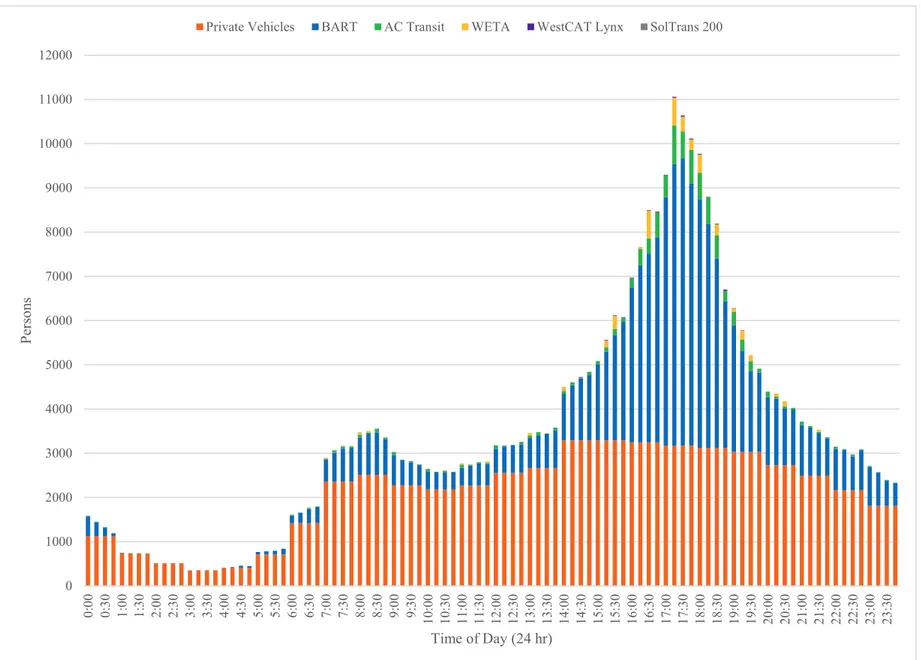
One powerful tool for analyzing the transbay situation is to compile a time-demand diagram. This diagram, presented as Figure 3.1 for westbound and Figure 3.2 for eastbound, lays out the fluctuations in throughput across the bay, broken down by mode. It is important to note that the data represented is throughput, not demand, as the data provided covers how many people or vehicles actually crossed the bay, not the number who attempted or otherwise desired to but did not. As outlined in the introduction, there are four primary modes connecting San Francisco to the East Bay: private vehicles, buses, BART, and WETA (the ferry). For this diagram, bus service has been broken down by agency: AC Transit, WestCAT Lynx, and SolTrans 200. Details on each of these modes is provided below.
3.1.1 Private Vehicles
3.1.2 BART
Data for BART ridership was provided by Brendan Monaghan (personal communication, October 4, 2016), and BART capacity was provided by Duncan Watry (personal communication, September 22, 2016), both with BART. The BART ridership data included station origin-destination pairs, sorted by origin-destination and recorded upon exit in 15 minute bins. This data covered August 1st, 2016 to September 30th, 2016. The provided capacity data was a train timetable, with the length of each train in terms of cars specified. Using data from BART’s website, seating capacity and crush capacity was found to be around 70 and 200 persons, respectively (BART, 2016a).
3.1.3 AC Transit
Data for AC Transit was provided by Michael Eshleman at AC Transit (personal communication, October 11, 2016). This data included ridership counts for every transbay trip made by an AC Transit bus, and their respective load factors. A load factor is the percentage of capacity used when the bus was at its maximum passenger load, which was used to compute bus capacities. For instance, a load factor of 0.5 in a bus with 25 riders would correspond to a capacity of 50 riders. The data provided covers June 27th, 2016 to August 19th, 2016.
3.1.4 WETA
Data for the ferry service was provided by WETA’s Scott Houston (personal communication, July 17, 2016). The data included passenger counts and ferry name for every trip operated by WETA in June of 2016. The ferry names were then matched to a separate table of capacities by ferry.
3.1.5 WestCAT Lynx
3.1.6 SolTrans 200
Data for Route 200 was provided by WETA’s Scott Houston (personal communication, October 4, 2016). This is because even though SolTrans operates Route 200, WETA administers it as a supplement to its ferry service, which is why the route only connects the Vallejo Ferry Building to the San Francisco Transbay Terminal. The data provided covers ridership for the month of June, 2016, and capacity is assumed to be 57 riders per bus, similar to WestCAT Lynx.
3.1.7 Data Processing
For all transit data, ridership per trip per day was provided. By averaging the ridership across the same trip on different days, average ridership per trip could be attained. For the private vehicle data, the number of vehicles through the toll plaza by hour and day were provided, which were then averaged to find the typical number of vehicles through the toll plaza by hour. This was then multiplied by the average occupancy rates mentioned before to convert vehicles into persons. All bus and ferry data was provided by trip, and so it was possible to ascertain the average ridership and capacity per trip. BART data was provided by 15 minute increments, and private vehicle data was provided hourly. For the sake of legibility, it was decided that 15 minute bins would be the best unit of time to work with. The bus and ferry runs were binned into 15 minute intervals, and the private vehicle data was simply quartered, so that the counts for four 15 minute intervals would equal the counts for one hour.
Figure 3.1: Westbound Person Throughput across the Transbay Corridor by Mode 0 1000 2000 3000 4000 5000 6000 7000 8000 9000 10000 11000 12000 0: 00 0: 30 1: 00 1: 30 2: 00 2: 30 3: 00 3: 30 4: 00 4: 30 5: 00 5: 30 6: 00 6: 30 7: 00 7: 30 8: 00 8: 30 9: 00 9: 30 10: 00 10: 30 11: 00 11: 30 12: 00 12: 30 13: 00 13: 30 14: 00 14: 30 15: 00 15: 30 16: 00 16: 30 17: 00 17: 30 18: 00 18: 30 19: 00 19: 30 20: 00 20: 30 21: 00 21: 30 22: 00 22: 30 23: 00 23: 30 Pe rs ons
Time of Day (24 hr)
Figure 3.2: Eastbound Person Throughput across the Transbay Corridor by Mode 0 1000 2000 3000 4000 5000 6000 7000 8000 9000 10000 11000 12000 0: 00 0: 30 1: 00 1: 30 2: 00 2: 30 3: 00 3: 30 4: 00 4: 30 5: 00 5: 30 6: 00 6: 30 7: 00 7: 30 8: 00 8: 30 9: 00 9: 30 10: 00 10: 30 11: 00 11: 30 12: 00 12: 30 13: 00 13: 30 14: 00 14: 30 15: 00 15: 30 16: 00 16: 30 17: 00 17: 30 18: 00 18: 30 19: 00 19: 30 20: 00 20: 30 21: 00 21: 30 22: 00 22: 30 23: 00 23: 30 Pe rs ons
Time of Day (24 hr)
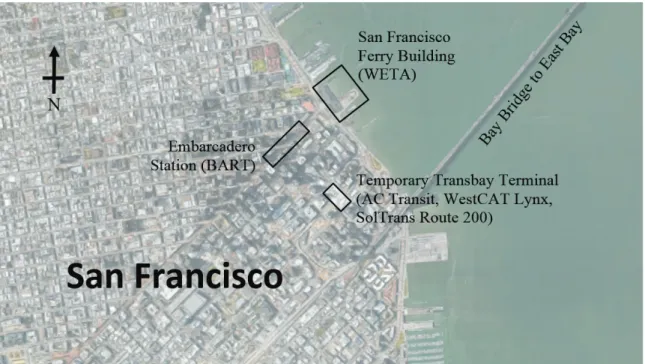
Figure 3.3: Location of Relevant Transit Nodes in Downtown San Francisco
3.2 PEAK HOUR DATA
Figure 3.4: Westbound Peak Hour Transbay Trips by Mode
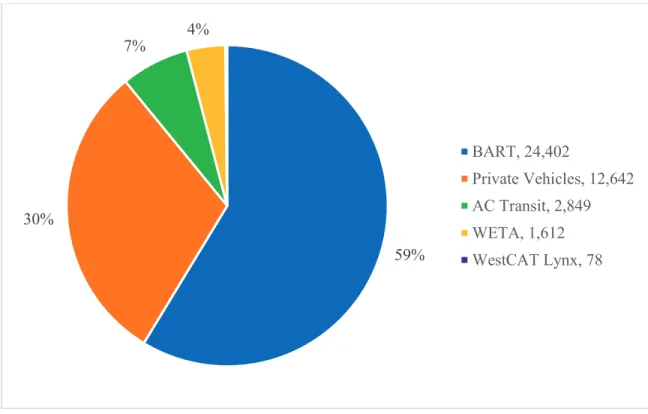
Figure 3.5: Eastbound Peak Hour Transbay Trips by Mode 54%
23% 14%
6% 3%
BART, 24,068
Private Vehicles (HOV), 10,162
Private Vehicles (non-HOV), 6,191
AC Transit, 2,492
WETA, 1,389
WestCAT Lynx, 49
59% 30%
7% 4%
BART, 24,402
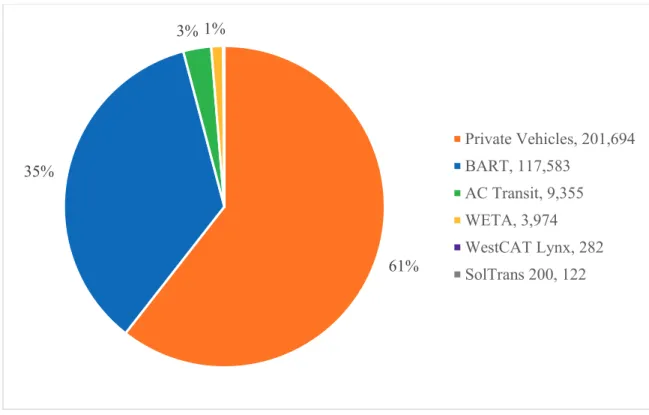
3.3 OVERALL DAILY DATA
Figure 3.6: Westbound Daily Transbay Trips by Mode
Figure 3.7: Eastbound Daily Transbay Trips by Mode 40%
21% 35%
3% 1%
Private Vehicles (non-HOV), 134,801
Private Vehicles (HOV), 69,874
BART, 116,398
AC Transit, 8,194
WETA, 4,148
WestCAT Lynx, 301
SolTrans 200, 110
61% 35%
3% 1%
Private Vehicles, 201,694 BART, 117,583
3.4 DEMAND, CAPACITY, AND OCCUPANCY
Demand (or more exactly, throughput) is only part of the equation. The problem with congestion is that inherently there is more demand than capacity. Therefore, it is important to consider limitations imposed by capacity as well. The easiest way to do this is to take a look at each mode individually.
3.4.1 Private Vehicles
With private vehicles, there are two forms of capacity: the number of vehicles able to cross the bridge, and the number of people able to sit in each vehicle.
3.4.1.1 Bridge Capacity of Vehicles
westbound and 120 eastbound vehicles (Caltrans, p. 133). This comes out to an equivalent of 9,352 westbound and 8,632 eastbound passenger cars.
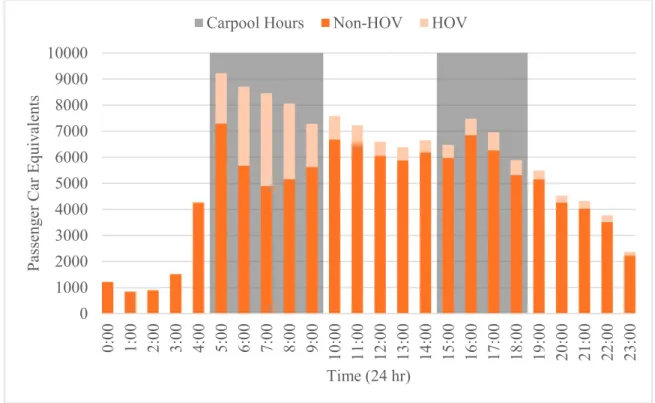
Another interesting point to note is that the observed peak hour for private vehicle counts preceded the peak hour for all modes. In the westbound direction, the all-mode peak hour is 8:00am to 9:00am, whereas the private vehicle peak hour is 5:00am to 6:00am. In the eastbound direction, the all-mode peak hour is 5:15pm to 6:15pm, whereas the private vehicle peak hour is 3:00pm to 4:00pm. This separation of peak hours is most likely due to congestion slowing down traffic during the all-mode peak hour. The private vehicle peak hour volume indicates the most amount of cars that are able to cross the bridge right before demand increases too high and conditions break down. Demand to cross may be higher at 8:00am and 5:15pm, but due to queuing delay less cars are able to get through. While actual demand is nearly impossible to measure, actual throughput is easy to obtain, as demonstrated before in Figures 3.1 and 3.2. This throughput is presented again below in Figure 3.8, this time in terms of passenger car equivalents rather than occupants or vehicles.
Figure 3.8: Average Bay Bridge Crossings by Hour in Terms of Passenger Car Equivalents
Figure 3.9: Westbound HOV and Non-HOV Counts by Hour
0 1000 2000 3000 4000 5000 6000 7000 8000 9000 10000 0: 00 1: 00 2: 00 3: 00 4: 00 5: 00 6: 00 7: 00 8: 00 9: 00 10: 00 11: 00 12: 00 13: 00 14: 00 15: 00 16: 00 17: 00 18: 00 19: 00 20: 00 21: 00 22: 00 23: 00 Passen ger C ar E qu iv al en ts
Time (24 hr)
Westbound Eastbound 0 1000 2000 3000 4000 5000 6000 7000 8000 9000 10000 0: 00 1: 00 2: 00 3: 00 4: 00 5: 00 6: 00 7: 00 8: 00 9: 00 10: 00 11: 00 12: 00 13: 00 14: 00 15: 00 16: 00 17: 00 18: 00 19: 00 20: 00 21: 00 22: 00 23: 00 Passen ger C ar E qu iv al en ts
Time (24 hr)
On the other hand, eastbound traffic seems to be much more stable during the afternoons, approximately 2:00pm to 8:00pm. This is most likely because without a toll plaza or metering lights, traffic is free to flow (and queue) without consideration for FasTrak versus cash or HOV versus non-HOV. Instead, demand hits capacity at around 8,632 passenger cars per hour as previously discussed, and any demand greater than that gets stuck in queues on I-80 and US-101 west of the bridge, and in downtown San Francisco.
3.4.1.2 Vehicle Capacity of Occupants
While the data for average passenger car size in terms of seats does not seem to be available, a value of five seats per car can be approximated as the median value. This value comes from an inventory of market share by vehicle that shows that SUVs, sedans, and other car types consist of around a third of sales each (IHS Markit, 2014). Typical capacity is seven or eight persons for SUVs, five persons for sedans, and two to five persons for the remainder, which includes coupes, pickups, hatchbacks, etc. Therefore, it is most prudent to use the median value of five seats per car. The major drawback to this methodology is that it relies on sales data rather than active private fleet data, which is not available. However, an inspection of actual traffic on the Bay Bridge confirms that five seats per vehicle is at minimum a reasonable estimate.
3.4.1.3 Total Private Vehicle Capacity
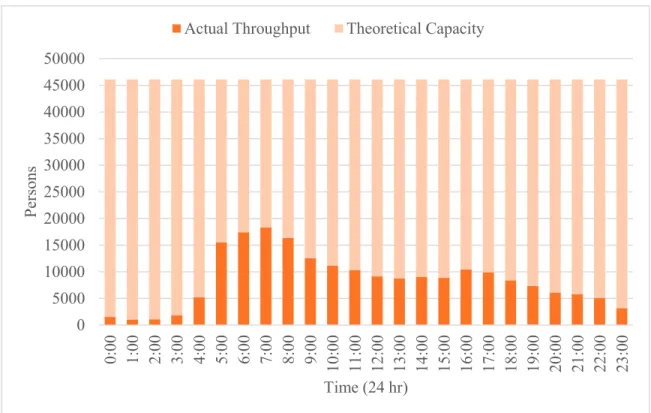
Figure 3.10: Westbound Actual Throughput and Theoretical Capacity of the Bay Bridge
Figure 3.11: Eastbound Actual Throughput and Theoretical Capacity of the Bay Bridge
0 5000 10000 15000 20000 25000 30000 35000 40000 45000 50000 0: 00 1: 00 2: 00 3: 00 4: 00 5: 00 6: 00 7: 00 8: 00 9: 00 10: 00 11: 00 12: 00 13: 00 14: 00 15: 00 16: 00 17: 00 18: 00 19: 00 20: 00 21: 00 22: 00 23: 00 Pe rs ons
Time (24 hr)
Actual Throughput Theoretical Capacity
0 5000 10000 15000 20000 25000 30000 35000 40000 45000 0: 00 1: 00 2: 00 3: 00 4: 00 5: 00 6: 00 7: 00 8: 00 9: 00 10: 00 11: 00 12: 00 13: 00 14: 00 15: 00 16: 00 17: 00 18: 00 19: 00 20: 00 21: 00 22: 00 23: 00 Pe rs ons
Time (24 hr)
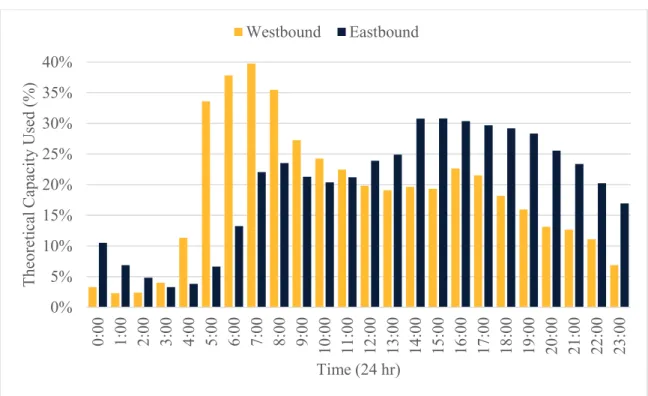
Figure 3.12: Percent of Theoretical Capacity Used on the Bay Bridge
The westbound capacity was found to be 46,108 persons per hour, from multiplying the greatest hourly throughput, 9,222 vehicles as discussed in Section 3.4.1.1, by five seats per vehicle. The eastbound capacity of 42,559 persons per hour was found the same way, using 8,512 vehicles per hour. Interestingly, due to varying rates of carpool usage, the greatest use of capacity in the westbound direction was during the 7:00am hour, at 40%, not at 5:00am when the greatest number of vehicles crossed. This means that from 7:00am to 8:00am, 40% of the private vehicle seats that crossed the Bay Bridge were occupied. In the eastbound direction, the greatest use of capacity was during both the 2:00pm and 3:00pm hours, with 31% each. Across the day, the westbound direction had an average of 18.5% use of capacity, and the eastbound had an average 19.7% use of capacity.
3.4.2 BART
For BART, complete origin-destination ridership numbers are available due to the nature of BART’s fare system, where users must tag in and tag out in order to charge the relevant fare.
0% 5% 10% 15% 20% 25% 30% 35% 40% 0: 00 1: 00 2: 00 3: 00 4: 00 5: 00 6: 00 7: 00 8: 00 9: 00 10: 00 11: 00 12: 00 13: 00 14: 00 15: 00 16: 00 17: 00 18: 00 19: 00 20: 00 21: 00 22: 00 23: 00 Th eo ret ical C ap aci ty U sed (% )
Time (24 hr)
The more complex task is assessing capacity. While a timetable of train lengths was provided, train length needed to be converted to passenger capacity. As mentioned before, two capacity numbers are provided on BART’s website: around 70 seated and 200 in crush conditions. It is important to note that perceived comfort is not tied to these numbers, however, due to the natural tendency for passengers to gravitate toward the center of the train. For instance, it is not uncommon for the middle cars to be standing-room only while the end cars have available seats. Likewise, some seats are disregarded outright by riders due to sanitary concerns or preference to stand rather than sit next to a stranger. Lastly, some riders consume multiple seats with bags or by spreading out.
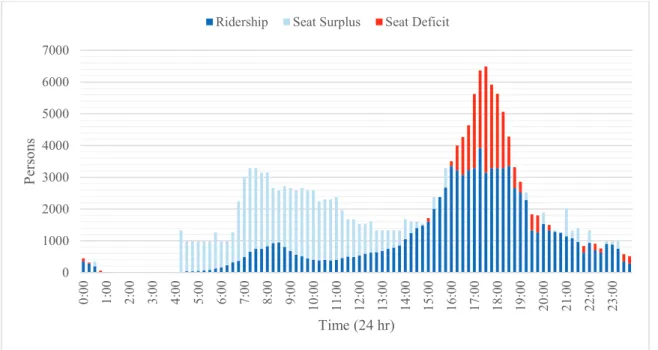
Figure 3.13: Westbound BART Transbay Tube Ridership and Seat Surplus or Deficit
Figure 3.14: Eastbound BART Transbay Tube Ridership and Seat Surplus or Deficit 0 1000 2000 3000 4000 5000 6000 7000 0: 00 1: 00 2: 00 3: 00 4: 00 5: 00 6: 00 7: 00 8: 00 9: 00 10: 00 11: 00 12: 00 13: 00 14: 00 15: 00 16: 00 17: 00 18: 00 19: 00 20: 00 21: 00 22: 00 23: 00 Pe rs ons
Time (24 hr)
Ridership Seat Surplus Seat Deficit
0 1000 2000 3000 4000 5000 6000 7000 0: 00 1: 00 2: 00 3: 00 4: 00 5: 00 6: 00 7: 00 8: 00 9: 00 10: 00 11: 00 12: 00 13: 00 14: 00 15: 00 16: 00 17: 00 18: 00 19: 00 20: 00 21: 00 22: 00 23: 00 Pe rs ons
Time (24 hr)
Figure 3.15: BART Transbay Tube Seat Occupancy Rates
3.4.3 AC Transit
AC Transit provided data for ridership and load factors for each run made over a two month time period. As previously discussed, the load factor is the percentage of capacity used. This relationship was used to determine capacities of AC Transit’s transbay services. It is important to note that these are crush capacities rather than seating capacities. While seating capacity data is not available, it can be assumed to be less than the average calculated capacity of 85, which is a reasonable capacity for a transbay bus between seated and standing riders. Figures 3.16 and 3.17 provide ridership versus capacity for the westbound and eastbound directions, respectively.
0% 50% 100% 150% 200% 250% 0: 00 1: 00 2: 00 3: 00 4: 00 5: 00 6: 00 7: 00 8: 00 9: 00 10: 00 11: 00 12: 00 13: 00 14: 00 15: 00 16: 00 17: 00 18: 00 19: 00 20: 00 21: 00 22: 00 23: 00 Seat O ccu pan cy R at e (% )
Figure 3.16: Westbound AC Transit Transbay Ridership and Seat Surpluses
Figure 3.17: Eastbound AC Transit Transbay Ridership and Seat Surpluses
The highest quarter-hourly occupancy for AC Transit is 61% at 5:15pm to 5:30pm in the eastbound direction. While this implies excess capacity, it is simply an average across all buses
0 200 400 600 800 1000 1200 1400 1600 0: 00 1: 00 2: 00 3: 00 4: 00 5: 00 6: 00 7: 00 8: 00 9: 00 10: 00 11: 00 12: 00 13: 00 14: 00 15: 00 16: 00 17: 00 18: 00 19: 00 20: 00 21: 00 22: 00 23: 00 Pe rs ons
Time (24 hr) Ridership Capacity Surplus
0 200 400 600 800 1000 1200 1400 1600 0: 00 1: 00 2: 00 3: 00 4: 00 5: 00 6: 00 7: 00 8: 00 9: 00 10: 00 11: 00 12: 00 13: 00 14: 00 15: 00 16: 00 17: 00 18: 00 19: 00 20: 00 21: 00 22: 00 23: 00 Pe rs ons
leaving the Transbay Terminal during those 15 minutes, while actual occupancies of each bus may differ. For instance, the 5:10pm eastbound Route C has an average occupancy of 32%, versus the 5:15pm eastbound Route J at 88%. Only one run of one route recorded operating above capacity: the 5:30pm eastbound Route FS at 105% occupancy. Figure 3.18 charts the average occupancy rate for both directions across the day.
Figure 3.18: AC Transit Transbay Occupancy Rates
3.4.4 WETA
Data for WETA included passenger counts and vessel names for each run made during the study month. Vessel capacities by name were also provided, so it was a trivial matter to match capacity to ridership. WETA operates 12 revenue ferries that range in capacity from Gemini at 149, to Zelinsky at 399. Additionally, the tourist company Blue & Gold Fleet provided four of its ferries to aid with vessel shortages over the course of the month, three with a capacity of 396 and one (the Bay Monarch) with a capacity of 693. Despite these seemingly large capacities, over the course of
0% 10% 20% 30% 40% 50% 60% 70% 0: 00 1: 00 2: 00 3: 00 4: 00 5: 00 6: 00 7: 00 8: 00 9: 00 10: 00 11: 00 12: 00 13: 00 14: 00 15: 00 16: 00 17: 00 18: 00 19: 00 20: 00 21: 00 22: 00 23: 00 Seat O ccu pan cy R at e (% )
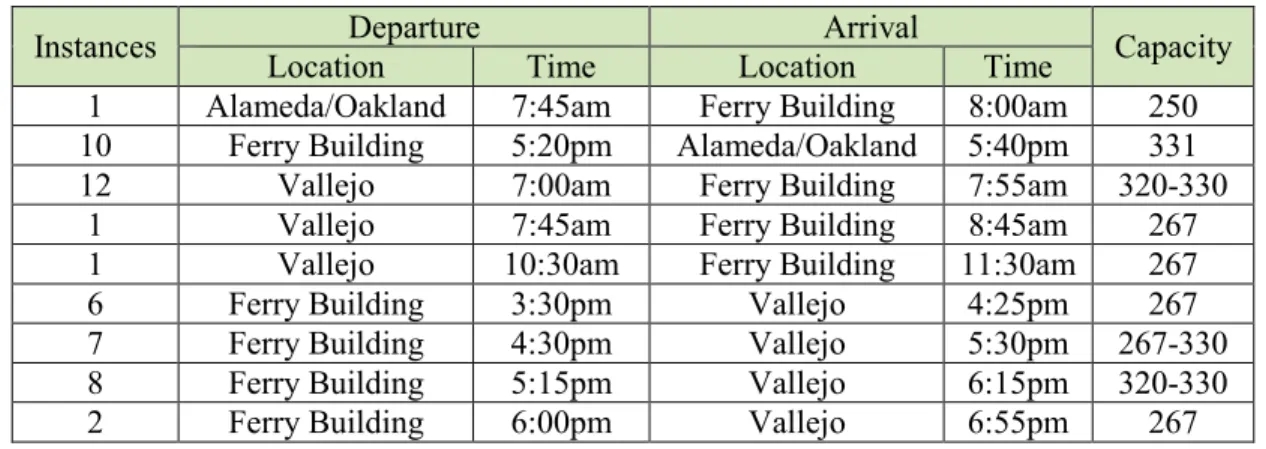
the month the ferry hit capacity a total of 48 times. Table 3.1 lists these full ferries. For some runs, the capacity is shown as a range because multiple ferries with different capacities were used.
Table 3.1: Instances When WETA Ferry Service Hit Capacity
Instances Location Departure Time Location Arrival Time Capacity 1 Alameda/Oakland 7:45am Ferry Building 8:00am 250 10 Ferry Building 5:20pm Alameda/Oakland 5:40pm 331
12 Vallejo 7:00am Ferry Building 7:55am 320-330
1 Vallejo 7:45am Ferry Building 8:45am 267
1 Vallejo 10:30am Ferry Building 11:30am 267
6 Ferry Building 3:30pm Vallejo 4:25pm 267
7 Ferry Building 4:30pm Vallejo 5:30pm 267-330
8 Ferry Building 5:15pm Vallejo 6:15pm 320-330
2 Ferry Building 6:00pm Vallejo 6:55pm 267
Figure 3.19: Westbound WETA Transbay Ridership and Capacity Surpluses
Figure 3.20: Eastbound WETA Transbay Ridership and Capacity Surpluses 0 100 200 300 400 500 600 700 800 900 1000 0: 00 1: 00 2: 00 3: 00 4: 00 5: 00 6: 00 7: 00 8: 00 9: 00 10: 00 11: 00 12: 00 13: 00 14: 00 15: 00 16: 00 17: 00 18: 00 19: 00 20: 00 21: 00 22: 00 23: 00 Pe rs ons
Time (24 hr) Ridership Capacity Surplus
0 100 200 300 400 500 600 700 800 900 1000 0: 00 1: 00 2: 00 3: 00 4: 00 5: 00 6: 00 7: 00 8: 00 9: 00 10: 00 11: 00 12: 00 13: 00 14: 00 15: 00 16: 00 17: 00 18: 00 19: 00 20: 00 21: 00 22: 00 23: 00 Pe rs ons
Figure 3.21: WETA Transbay Occupancy Rates
3.4.5 WestCAT Lynx
Data for the Lynx service from Hercules to San Francisco included fare tags for every rider during the study month. These were split by trip and direction based on timestamp and coordinates. Capacity was easy to quantify since WestCAT utilizes a standard commuter bus with a seated capacity of 57 riders on all runs. While potentially additional riders could stand, in practice that might prove uncomfortable for the 30-45 minute bus ride. Just as well that this is a rare concern given that the highest ridership instance during the study month was 41 riders. Ridership versus surplus capacity data is provided in Figures 3.22 and 3.23 for westbound and eastbound, respectively. The 57 rider capacity becomes apparent by the height of each bar, and the two bars in each direction that are twice that height are simply time bins with two runs. Occupancy rate data is provided in Figure 3.24.
0% 10% 20% 30% 40% 50% 60% 70% 80% 90% 100% 0: 00 1: 00 2: 00 3: 00 4: 00 5: 00 6: 00 7: 00 8: 00 9: 00 10: 00 11: 00 12: 00 13: 00 14: 00 15: 00 16: 00 17: 00 18: 00 19: 00 20: 00 21: 00 22: 00 23: 00 Seat O ccu pan cy R at e (% )
Figure 3.22: Westbound WestCAT Lynx Ridership and Capacity Surpluses
Figure 3.23: Eastbound WestCAT Lynx Ridership and Capacity Surpluses 0 20 40 60 80 100 120 0: 00 1: 00 2: 00 3: 00 4: 00 5: 00 6: 00 7: 00 8: 00 9: 00 10: 00 11: 00 12: 00 13: 00 14: 00 15: 00 16: 00 17: 00 18: 00 19: 00 20: 00 21: 00 22: 00 23: 00 Pe rs ons
Time (24 hr) Ridership Capacity Surplus
0 20 40 60 80 100 120 0: 00 1: 00 2: 00 3: 00 4: 00 5: 00 6: 00 7: 00 8: 00 9: 00 10: 00 11: 00 12: 00 13: 00 14: 00 15: 00 16: 00 17: 00 18: 00 19: 00 20: 00 21: 00 22: 00 23: 00 Pe rs ons
Figure 3.24: WestCAT Lynx Occupancy Rates
3.4.6 SolTrans 200
As previously mentioned, data for SolTrans Route 200 was provided by WETA as the ferry agency administers the route as a supplement for its Vallejo-San Francisco ferry service, even though SolTrans operates the bus route. Passenger counts for the month were provided and averaged, and capacity was given as 57 seated riders per bus, similar to WestCAT Lynx. Despite the infrequent service of the route, many of the runs were near capacity due to the route’s function as a relief service to the much more frequent ferry. Because of the difference in scale, it is easy to see how an overcrowded ferry with a capacity of 300+ riders would fill up a 57 seat commuter bus. During the study month, three runs hit capacity and another 16 had more than 50 riders, representing 7% of the 264 sample runs. Ridership versus surplus capacity data is provided in Figures 3.25 and 3.26 for westbound and eastbound, respectively. Occupancy rate data is provided in Figure 3.27.
0% 5% 10% 15% 20% 25% 30% 35% 40% 45% 50% 0: 00 1: 00 2: 00 3: 00 4: 00 5: 00 6: 00 7: 00 8: 00 9: 00 10: 00 11: 00 12: 00 13: 00 14: 00 15: 00 16: 00 17: 00 18: 00 19: 00 20: 00 21: 00 22: 00 23: 00 Seat O ccu pan cy R at e (% )
Figure 3.25: Westbound SolTrans Route 200 Ridership and Capacity Surpluses
Figure 3.26: Eastbound SolTrans Route 200 Ridership and Capacity Surpluses 0 10 20 30 40 50 60 0: 00 1: 00 2: 00 3: 00 4: 00 5: 00 6: 00 7: 00 8: 00 9: 00 10: 00 11: 00 12: 00 13: 00 14: 00 15: 00 16: 00 17: 00 18: 00 19: 00 20: 00 21: 00 22: 00 23: 00 Pe rs ons
Time (24 hr) Ridership Capacity Surplus
0 10 20 30 40 50 60 0: 00 1: 00 2: 00 3: 00 4: 00 5: 00 6: 00 7: 00 8: 00 9: 00 10: 00 11: 00 12: 00 13: 00 14: 00 15: 00 16: 00 17: 00 18: 00 19: 00 20: 00 21: 00 22: 00 23: 00 Pe rs ons
Figure 3.27: SolTrans Route 200 Occupancy Rates
3.4.7 All Modes
Now that the occupancy rate has been assessed by mode, the total throughput and capacity for the transbay corridor can be compiled. Of note, converting the private vehicle data from hourly to every 15 minutes was done by simply quartering the hourly data, similar to Section 3.1.7. In Figure 3.28 for westbound and Figure 3.29 for eastbound, the total number of persons crossing the bay is charted against the total number of seats crossing the bay. A line denoting the percentage of seats occupied accompanies these charts.
During the early morning hours of 1:00am to 4:00am, the total capacity is simply the theoretical 15 minute private vehicle capacity with five seats each. This amounts to 11,527 seats every 15 minutes westbound and 10,640 seats every 15 minutes eastbound. All greater capacity values are from transit services. Interestingly, during one 15 minute interval in each direction, the number of riders exceeded the theoretical 15 minute private vehicle capacity. This was 11,905 riders at 8:45am in the westbound direction, and 11,047 riders at 5:15pm in the eastbound direction. The greatest westbound capacity was 17,261 seats at 8:00am, and the greatest eastbound capacity was 16,712 seats at 5:15pm. The greatest westbound occupancy was 69% at both 8:30am and 8:45am, and the greatest eastbound occupancy was also 69%, at 5:30pm. The total occupancy across the day was 25.6% in the westbound direction and 27.2% in the eastbound direction.
0% 20% 40% 60% 80% 100% 0: 00 1: 00 2: 00 3: 00 4: 00 5: 00 6: 00 7: 00 8: 00 9: 00 10: 00 11: 00 12: 00 13: 00 14: 00 15: 00 16: 00 17: 00 18: 00 19: 00 20: 00 21: 00 22: 00 23: 00 Seat O ccu pan cy R at e (% )
Figure 3.28: Westbound Actual Throughput versus Excess Capacity and Occupancy Rate 0% 10% 20% 30% 40% 50% 60% 70% 80% 90% 100% 0 2000 4000 6000 8000 10000 12000 14000 16000 18000 20000 0: 00 1: 00 2: 00 3: 00 4: 00 5: 00 6: 00 7: 00 8: 00 9: 00 10: 00 11: 00 12: 00 13: 00 14: 00 15: 00 16: 00 17: 00 18: 00 19: 00 20: 00 21: 00 22: 00 23: 00 O ccu pan cy R at e Pe rs ons pe r 15 M inut es
Time (24 hr)
Figure 3.29: Eastbound Actual Throughput versus Excess Capacity and Occupancy Rate 0% 10% 20% 30% 40% 50% 60% 70% 80% 90% 100% 0 2000 4000 6000 8000 10000 12000 14000 16000 18000 20000 0: 00 1: 00 2: 00 3: 00 4: 00 5: 00 6: 00 7: 00 8: 00 9: 00 10: 00 11: 00 12: 00 13: 00 14: 00 15: 00 16: 00 17: 00 18: 00 19: 00 20: 00 21: 00 22: 00 23: 00 O ccu pan cy R at e Pe rs ons pe r 15 M inut es
Time (24 hr)
3.5 FUTURE CAPACITY TARGETS
The above discussion covers demand and capacity as it stands today, but what about in the future? As mentioned in Section 1.3, the Bay Area population is predicted to grow by 30% from 2010 to 2040 (MTC, 2013, p. 32). If there is an equal increase in demand, then a matching increase in capacity will be necessary to simply maintain existing occupancy levels and prevent additional overcrowding. Table 3.2 lists the total present daily trips by mode, and total daily trips with a 30% increase in demand per mode. Additionally, it includes a tally of how many vehicles per mode would be needed to handle this added demand, assuming each vehicle is at capacity using the shown vehicle capacities. Lastly, it demonstrates how many additional vehicles would be needed if the fleet size per mode was also increased 30% to keep each vehicle at its current occupancy.
Table 3.2: Vehicle Capacity Needed for Increased Demand
Mode Vehicle BART Private Transit WETA AC WestCAT Lynx SolTrans Route
200 Total Present Daily Trips 406,369 233,981 17,549 8,122 583 232 666,836 30% of Present Daily Trips 121,911 70,194 5,265 2,437 175 70 200,051 Maximum Vehicle
Occupancy 5 200 85 310 57 57 -
Additional Vehicle-Trips Needed to Handle Future Demand, at Maximum Vehicle Capacity
24,383 351 62 8 4 2 24,810
Current Vehicle Occupancy 1.54 52 30 99 9 20 -
Additional Vehicle-Trips Needed to Handle Future Demand, at Current Vehicle Capacity
However, MTC and ABAG also desire to increase the non-private vehicle mode share by 10%, from the current region-wide average of 16% to 26% (MTC, 2013, p. 106). As can be deduced from Figures 3.6 and 3.7, the current non-private vehicle mode share on the transbay corridor exceeds this goal already, at 39%. This corridor does not get a pass though, as the goal is to increase the region as a whole, and the best way to do so would be to increase the non-private vehicle mode share on all corridors, transbay included. Table 3.3 copies Table 3.2, but redistributes the 200,051 new trips in order to reduce the future private vehicle mode share by 10%, from 61% to 51%, with the trips being proportionally distributed to the remaining modes.
Table 3.3: Vehicle Capacity Needed for Increased Demand, with Adjusted Mode Shares
Mode Vehicle BART Private Transit WETA AC WestCAT Lynx SolTrans Route
200 Total Present Daily Trips 406,369 233,981 17,549 8,122 583 232 666,836 Future Additional Daily
Trips 35,743 147,600 11,070 5,124 368 146 200,051
Future Mode Share 51.0% 44.0% 3.3% 1.5% 0.1% 0.0% 100%
Maximum Vehicle
Occupancy 5 200 85 310 57 57 -
Additional Vehicle-Trips Needed to Handle Future Demand, at Maximum Vehicle Capacity
7,149 738 131 17 7 3 8,045
Current Vehicle
Occupancy 1.54 52 30 99 9 20 -
Additional Vehicle-Trips Needed to Handle Future Demand, at Current Vehicle Capacity
Comparing these two tables shows the power of the goal to increase non-private vehicle modes of transportation. Whereas 24,810 vehicle-trips are needed with each vehicle at capacity using the current modal split, only 8,045 are needed by moving 10% of private vehicle users to transit. It is important to note that this would not be done only by convincing all but 35,743 of the future daily trips to take public transportation, but by convincing some future users in conjunction with some of the existing 406,369 users to switch as well.
4. ALTERNATIVE ANALYSIS
Now that it has been shown that the transbay services are straining to keep up with demand during peak commute hours, solutions can be explored. As mentioned in the introduction, a second bridge or tube will take many decades to come to fruition. Therefore, the focus here is on solutions that are more short-term. Sixteen strategies have been proposed in two broad categories: capacity enhancement and demand management.
4.1 CAPACITY ENHANCEMENT
The first category, capacity enhancement, contains twelve strategies that focus on improving the capacity of the transbay corridor. These include tactics focusing on adding onramp HOV queue jumps, incentivizing carpooling, and increasing transit capacity.
4.1.1 Strategy 1: Upgrade West Grand Avenue Onramp to Bus Lane Standards
Currently, there is a wide shoulder on the West Grand Avenue onramp onto I-80 that is unused except by occasional buses or HOVs jumping the queue of cars waiting for the toll plaza. This tactic would legitimize this queue jump by improving the hardscape to bus lane standards, including restriping, signage, upgrading drainage inlets, and enforcement. This incentive was first proposed by MTC as Element 1 in their presentation, “West Grand Avenue On-Ramp and Immediate Transbay Mobility Improvement Projects,” outlined in the literature review and included in Appendix A.
Figure 4.1: West Grand Avenue Queue Jump Overview
4.1.1.1 Base Queue Jump Proposal
The most instrumental part of this strategy is extending the existing HOV lane upstream from its current start, where the West Grand Avenue to I-80 westbound onramp splits into two structures, one for general purpose traffic and one for HOV. By extending it to the I-580 eastbound onramp, HOVs and especially buses coming from West Grand Avenue will be able to jump the toll plaza queue that backs up onto West Grand Avenue during peak hours.
(a)
(b)
Figure 4.2: West Grand Avenue Before (a) and After (b) HOV Lane Extension
4.1.1.2 I-580 Ramp Queue Jump Extension
I-580 eastbound onramp, the lane can be signed and striped for general purpose traffic heading to I-580 east and HOV traffic heading to I-80. Since traffic on this ramp is only 1500 vehicles daily (Caltrans, 2015c, p. 133), this should not greatly impact the HOV functionality of the proposed lane.
By taking 3ft. from the left shoulder, 4.5ft. from the right shoulder, and 1.5ft. from each lane, three even lanes of 10.5ft each can be generated with a remainder of 2ft. for the left shoulder and 2.5ft. for the right shoulder. The narrow lanes are acceptable as this is right before a merge on a curve, so site geometry warrants slower speeds. A cross section of this segment is provided in Figure 4.3.
(a)
(b)
4.1.1.3 Maritime Intersection Queue Jump Extension
Lastly, HOV operations can be further improved by extending this queue jump past West Grand Avenue’s intersection with Maritime Street. This will allow buses and other HOVs to make use of a dedicated lane to help jump past the queue to pass through the intersection and rush hour gridlock all the way from the toll plaza. Traffic turning right onto Wake Avenue could also use this lane. Impact to HOV traffic is estimated to be minimal, as there are only a few tenants on Wake Avenue. By taking a foot from each lane and adding it to the current 8ft. shoulder, four 11ft. lanes can be generated. A cross section of this segment is provided in Figure 4.4.
(a)
(b)
4.1.1.4 Overall Proposal
With all elements combined, a bus or HOV can skip past the queue for the Maritime Street intersection and all the way to the toll plaza, without having to merge into general purpose traffic and potentially getting stuck there. This can result in major time savings for HOVs and buses; AC Transit transbay services could save eleven minutes during peak demand times by their estimate. AC Transit can make extensive use of this shortcut by rerouting Transbay service from south of the Bay Bridge through West Grand Avenue, in conjunction with transit signal priority on the West Grand Avenue corridor. MTC anticipates the cost of this project to be around $3,000,000 for around 9,700 linear feet of restriping to accommodate the HOV lane, seventeen drain grate replacements, and signal and signage changes at the Maritime intersection (MTC, 2011, p. 11).
As shown in Appendix A, a number of design exceptions will be required for this proposal: 1. Nonstandard lane widths: 11.5ft. from the existing HOV ramp to the I-580 eastbound ramp, 10.5ft. from the I-580 eastbound ramp to the Maritime Street intersection, and 11ft. from the Maritime Street intersection to the end of the queue jump.
2. Nonstandard shoulders: 4ft. left and 2ft. right from the existing HOV ramp to the I-580 eastbound ramp, 2ft. left and 2.5 ft. right from the I-580 eastbound ramp to the Maritime Street intersection, and 2ft. left from the Maritime Street intersection to the end of the queue jump, with no right shoulder.
4.1.2 Strategy 2: HOV Improvements at Powell Street and I-80 in Emeryville
Several changes to the Powell Street and I-80 interchange in Emeryville, as well as to I-80 through Emeryville, can improve the attractiveness of HOV and transit. These changes include adding a side HOV lane on I-80 from the southbound Powell off-ramp to the existing right-side HOV lane before the toll plaza, converting the existing southbound Powell onramp to HOV and adding movements from the Powell Street intersection to allow more approaches to access the ramp, and building a new park-and-ride lot under the I-80 overpass.
4.1.2.1 I-80 Right-Side HOV Lane
Currently, there is a wide right shoulder along most of I-80 through Berkeley and the toll plaza. This could be upgraded to an HOV lane to help buses and carpoolers bypass queues from the toll plaza. The lane would start just past the southbound Powell Street off-ramp, where the rightmost lane ends in a merge. It will extend this merge through the interchange with a few feet of pavement widening to connect to the southbound West Frontage Road onramp. There, restriping would allow the HOV lane to continue through the merge. This merge of HOV and general purpose traffic could be managed with an “all access okay next ½ mile” policy similar to the left-side onramp from the Watt/I-80 light rail station in Sacramento.
and connects with the existing HOV lane from the right. This alternative is estimated to cost around $868,500, as outlined in Table 4.2. These alternatives are shown in Figure 4.6.
Table 4.1: Cost Estimate for I-80 Right-Side HOV Lane Improvements, Alternative 1
Cost Type Amount Unit Unit Cost Total Cost Source
New Pavement 530 Square Yards $151.11 $80,088.30 (Plotner, 2015) New Paint 4900 Linear Feet $1.52 $7,448.00 (Caltrans, 2016e) Remove Paint 2500 Linear Feet $1.00 $2,500.00 (Caltrans, 2016d)
Total: $90,036.30 53% Soft Costs (20% contingency, 15% overhead and
profit, 10% general requirements, 5% permit and
inspection, 3% bonds and insurance): $47,719.24 Total: $137,755.54 20% Soft Costs (10% time-related overhead and 10%
mobilization): $27,551.11 Total: $165,306.65 Rounded: $165,500.00
Table 4.2: Cost Estimate for I-80 Right-Side HOV Lane Improvements, Alternative 2 Cost Type Amount Unit Unit Cost Total Cost Source New Pavement 3000 Square Yards $151.11 $453,330.00 (Plotner, 2015) Remove Barrier 165 Linear Feet $33.90 $5,593.50 (Caltrans, 2016f)
New Paint 7300 Linear Feet $1.52 $11,096.00 (Caltrans, 2016e) Remove Paint 2900 Linear Feet $1.00 $2,900.00 (Caltrans, 2016d)
Total: $472,919.50 53% Soft Costs (20% contingency, 15% overhead and
profit, 10% general requirements, 5% permit and
inspection, 3% bonds and insurance): $250,647.34 Total: $723,566.84 20% Soft Costs (10% time-related overhead and 10%
Currently, AC Transit routes FS, G, H, L, LA, and LC, WestCAT Lynx, and SolTrans Route 200 all use I-80 southbound through the area this improvement would serve, representing 1,824 daily riders and 713 AM peak hour riders who would receive a time-savings benefit. Additionally AC Transit routes C, F, J, and Z enter on Powell, representing an additional 1,879 daily and 413 AM peak hour riders, for a total ridership of 3,703 per day and 1,126 during the AM peak hour.
4.1.2.2 Improve HOV Access at Powell Street and I-80
BATA’s “San Francisco Bay Crossings Study Update,” outlined in the literature review, recommends improving HOV access to the freeway from this important arterial. Currently, the only direction that can access the Powell Street diagonal onramp onto I-80 west is from the west. While there is demand for this movement, the majority of traffic seeking to get onto I-80 west is coming from the east, and must turn right from Powell onto West Frontage Road to get to the freeway. Operationally, this makes sense as it eliminates left-turn traffic from westbound Powell Street to the I-80 west onramp. However, only 2,400 daily vehicles make use of the restricted Powell Street onramp, versus 20,300 daily vehicles for the West Frontage Road onramp (Caltrans, 2015c, p. 28). This leaves much unused capacity that could be utilized by HOV movements from westbound Powell Street.
BATA’s diagram of this proposed change is included in Appendix B. According to their cost estimates, this conversion will cost $1,248,000 and have a time-savings benefit of $6,468,000, for a cost-benefit ratio of 5.18 (AECOM, 2012).
4.1.2.3 New Park-and-Ride at Powell Street under I-80
The last element of this strategy is to construct a park-and-ride lot underneath I-80 on the south side of Powell Street. This lot could potentially contain 60 regular stalls, 3 handicap stalls, 3 compact stalls, and 6 motorcycle stalls, for 72 spots total, as well as amenities for transit pickup/drop-off. Currently, AC Transit routes C, F, J, and Z pass by this proposed lot and so could easily serve the lot. Figure 4.7 shows a possible configuration for this lot in conjunction with the improved HOV access at Powell Street and westbound I-80 onramp. Figure 4.8 shows how buses could navigate the lot. This element is estimated to cost $494,000, from $6,857.14 per stall times 72 stalls and rounded up to the nearest thousand dollars. The per-stall value comes from MTC’s estimate for new park-and-ride lots, as will be outlined in Section 4.1.5. It is important to note that this cost does not overlap BATA’s estimate for the intersection modifications at Powell and West Frontage Road/I-80 Westbound Onramp.
Figure 4.8: Proposed Bus Reroutes to Serve Park-and-Ride Lot
4.1.3 Strategy 3: MacArthur Onramp Bus Lane