Received 27 Dec 2015|Accepted 26 Feb 2016|Published 4 Apr 2016
A miR-192-EGR1-HOXB9 regulatory network
controls the angiogenic switch in cancer
Sherry Y. Wu
1, Rajesha Rupaimoole
1, Fangrong Shen
1,2, Sunila Pradeep
1, Chad V. Pecot
3,4, Cristina Ivan
1,5,
Archana S. Nagaraja
1, Kshipra M. Gharpure
1, Elizabeth Pham
1,6, Hiroto Hatakeyama
1, Michael H. McGuire
1,
Monika Haemmerle
1, Viviana Vidal-Anaya
1, Courtney Olsen
1, Cristian Rodriguez-Aguayo
3,7, Justyna Filant
1,
Ehsan A. Ehsanipour
8, Shelley M. Herbrich
1,9, Sourindra N. Maiti
10, Li Huang
8, Ji Hoon Kim
11, Xinna Zhang
5,
Hee-Dong Han
1,12, Guillermo N. Armaiz-Pena
1, Elena G. Seviour
11, Sue Tucker
9, Min Zhang
13, Da Yang
13,
Laurence J.N. Cooper
10, Rouba Ali-Fehmi
14, Menashe Bar-Eli
8, Ju-Seog Lee
11, Prahlad T. Ram
11, Keith A.
Baggerly
9, Gabriel Lopez-Berestein
4,7, Mien-Chie Hung
15,16& Anil K. Sood
1,5,8A deeper mechanistic understanding of tumour angiogenesis regulation is needed to improve current anti-angiogenic therapies. Here we present evidence from systems-based miRNA analyses of large-scale patient data sets along with in vitro and in vivo experiments that miR-192 is a key regulator of angiogenesis. The potent anti-angiogenic effect of miR-192 stems from its ability to globally downregulate angiogenic pathways in cancer cells through regulation ofEGR1andHOXB9. Low miR-192 expression in human tumours is predictive of poor clinical outcome in several cancer types. Using 1,2-dioleoyl-sn-glycero-3-phosphati-dylcholine (DOPC) nanoliposomes, we show that miR-192 delivery leads to inhibition of tumour angiogenesis in multiple ovarian and renal tumour models, resulting in tumour regression and growth inhibition. This anti-angiogenic and anti-tumour effect is more robust than that observed with an anti-VEGF antibody. Collectively, these data identify miR-192 as a central node in tumour angiogenesis and support the use of miR-192 in an anti-angiogenesis therapy.
DOI: 10.1038/ncomms11169 OPEN
1Department of Gynecologic Oncology, The University of Texas MD Anderson Cancer Center, Houston, Texas 77030, USA.2Department of Obstetrics and
Gynecology, The First Affiliated Hospital of Soochow University, Suzhou, Jiangsu Province 215006, China.3Division of Cancer Medicine, The University of Texas MD Anderson Cancer Center, Houston, Texas 77030, USA.4Department of Medicine, The University of North Carolina, Chapel Hill, North Carolina 27599 USA.5Center for RNA Interference and Non-Coding RNA, The University of Texas MD Anderson Cancer Center, Houston, Texas 77030, USA.
6Biological Sciences Platform, Sunnybrook Research Institute, Toronto, Ontario, Canada, M4N 3M5.7Department of Experimental Therapeutics,
The University of Texas MD Anderson Cancer Center, Houston, Texas 77030, USA.8Department of Cancer Biology, The University of Texas MD Anderson Cancer Center, Houston, Texas 77030, USA.9Department of Bioinformatics, The University of Texas MD Anderson Cancer Center, Houston, Texas 77030, USA.10Division of Pediatrics, The University of Texas MD Anderson Cancer Center, Houston, Texas 77030, USA.11Department of Systems Biology, The University of Texas MD Anderson Cancer Center, Houston, Texas 77030, USA.12Department of Immunology Laboratory, School of Medicine, Konkuk University, Chungju 380-701, South Korea.13Department of Pharmaceutical Sciences, University of Pittsburgh, Pittsburgh, Pennsylvania 15213, USA. 14Department of Pathology, Wayne State University School of Medicine, Karmanos Cancer Institute, Detroit, Michigan 48201, USA.15Department of
Molecular and Cellular Oncology, The University of Texas MD Anderson Cancer Center, Houston, Texas 77030, USA.16Center for Molecular Medicine, China
A
ngiogenesis plays a central role in tumour progression. However, targeting tumour vasculature has thus far resulted in only modest improvement in progression-free survival, with most patients still experiencing disease progressiondespite an initial response1–3. Emerging pre-clinical and
clinical evidence indicates that upregulation of compensatory pro-angiogenic signalling cascades contributes significantly to the suboptimal therapeutic response in multiple cancer types,
including ovarian and renal cancer4–8. In patients with
glioblastoma, treatment with cediranib, a pan-VEGFR inhibitor, also resulted in subsequent increases inFGF-2andSDF-1levels, which can in turn contribute to tumour progression1,6. In a phase II trial of FOLFIRIþB (folinic acid, fluorouracil, irinotecan and bevacizumab) in colorectal cancer, significant increases in several pro-angiogenic factors were also observed following the treatment5. The identification of new anti-angiogenic approaches that can overcome this compensatory mechanism are, therefore, critical for improved therapeutic outcomes.
MicroRNAs (miRNAs) are endogenous small RNA molecules that have the ability to target multiple genes concurrently9. This unique property enables us to simultaneously target multiple important pathways involved in angiogenesis. Pathway redundancy is, thus, less likely to occur with such molecules. Despite the promise, a systematic evaluation of miRNAs that have a global impact on angiogenesis has not yet been reported. To address this knowledge gap, we utilized a systems-based approach integrating global miRNA profiling of highly and poorly angiogenic tumours, large-scale patient data sets and miRNA (microRNA)–mRNA (messenger RNA) correlation analyses, to identify key miRNAs that are critical for regulating tumour angiogenesis. This unbiased approach led us to identify miR-192 as a key regulator of tumour angiogenesis. In both highly angiogenic ovarian and renal cancer models, we show that miR-192 significantly disrupts the crosstalk between tumour and endothelial cells by targeting two key transcription factors,
EGR1 and HOXB9. This led to global downregulation of
pro-angiogenic factors. Delivery of miR-192 to tumours using the 1,2-dioleoyl-sn-glycero-3-phosphatidylcholine (DOPC) nano-liposomal platform significantly inhibited tumour angiogenesis, resulting in a much more profound anti-tumour effect compared with that observed with murine anti-VEGF antibody (equivalent to bevacizumab, a clinically approved anti-angiogenic agent). Collectively, these findings provide an understanding of the mechanisms by which miR-192 can regulate tumour angiogenesis and supports its use as an effective therapeutic means of inhibiting tumour angiogenesis.
Results
Effect of miR-192 on angiogenesis. To systematically identify
miRNAs that play critical roles in tumour angiogenesis, integrative computational analyses were performed using clinically annotated ovarian tumour samples to identify miRNAs with low endogenous levels that correlate with (1) high microvessel density (Fig. 1a), (2) high levels of angiogenic factors and (3) poor clinical outcome (Fig. 1b). First, human high-grade serous ovarian cancers (HGSC) were assessed for microvessel
density (MVD) by CD31 immunohistochemical staining
(n¼133, Fig. 1a). High-throughput miRNA profiling was
subsequently performed using Nanostring technology in 24 tumour samples with very high (436 vessels per high power field
(HPF), n¼12) or low (o16 vessels per HPF, n¼12) MVD
(Supplementary Data 1). All the 24 samples hado25% stromal content, as confirmed by microscopic examination of the tumour sections. For this study, we focused our efforts on identifying miRNAs that are downregulated in tumours with high MVD.
From this analysis, 13 miRNAs were found to be decreased by more than 80% (median miRNA expression) in highly angiogenic tumours when compared with poorly angiogenic tumours. We next examined the correlation between tumoral expression of miRNAs and pro-angiogenic factors for these 13 miRNAs in The Cancer Genome Atlas (TCGA) ovarian cancer data set (n¼559). For each sample in TCGA data set, an angiogenesis score was calculated based on the overall relative expression values for each of the pro-angiogenic factors listed in Supplementary Data 2 (ref. 10). The correlation coefficient between angiogenesis scores and miRNA expression was subsequently computed for each miRNA (Fig. 1b). Among all the miRNAs examined, miR-96, -192, -194 and -200b were found to display the strongest negative correlations with pro-angiogenic factors (Po0.0001, Supplementary Table 1). We next assessed the impact of these four miRNAs on patient survival. High tumoral miR-192 and miR-194 correlated with prolonged overall survival (OS; both
Po0.05). In contrast, tumoral miR-96 expression correlated with poor OS, while no correlation was observed for miR-200b.
To study the roles of miR-192 and miR-194 in tumour angiogenesis, we first examined the expression levels of these miRNAs in endothelial cells isolated from human normal ovaries or HGSCs. No statistically significant differences in miR-192 or miR-194 expression were observed between normal versus tumoral endothelial cells (Supplementary Fig. 1a). We thus reasoned that the effect of these miRNAs on angiogenesis may result from a paracrine effect from tumour cells. To test this hypothesis, we introduced miRNA mimics into SKOV3ip1 ovarian cancer cells, which have low endogenous expression of these two miRNAs (Supplementary Fig. 1b). RF-24, human endothelial cells, were then exposed to conditioned media obtained from control miRNA, miR-192 or miR-194-treated SKOV3ip1 cells (48 h post transfection). Compared with control
miRNA treatment, miR-192 treatment resulted in 490%
reduction in endothelial tube formation (Fig. 1c), while only a 20% reduction was observed in the miR-194 treatment group (Supplementary Fig. 1c). A similar result was also observed with HeyA8 cells (Supplementary Fig. 1d). Consistent with these findings, miR-192 transfection in SKOV3ip1 and HeyA8 cells resulted in a significant downregulation of several important angiogenic factors includingIL6,IL8andFGF2levels (75, 80 and 50% decrease, respectively; Supplementary Fig. 1e), while only a minimal downregulation of these factors was observed following miR-194 treatment (Supplementary Fig. 1f). Incubation of the RF24 cells with conditioned media collected from the SKOV3ip1 cells treated with miR-215, a miRNA closely associated with
miR-192, did not significantly inhibit tube formation,
demonstrating the unique ability of miR-192 to regulate tumour angiogenesis (Supplementary Fig. 1g). Of note, direct expression of miR-192 in RF-24 cells resulted in modest reduction in their tube formation potential (Supplementary Fig. 1h). This indicates that miR-192 mediates its anti-angiogenic effect mainly from its effect on cancer cells. To further evaluate the impact of miR-192
on tumour angiogenesis, an in vivo matrigel plug assay was
next performed using conditioned media collected from the SKOV3ip1 cells treated with control miRNA or miR-192. Compared with VEGF (positive control) and conditioned media obtained from control miRNA-treated cells, miR-192 treatment led to substantial reductions in MVD and haemoglobin content (58% decrease,Po0.05), a surrogate marker for functional blood flow (Fig. 1d).
Control miR
133 Human HGSCs Correl. with
angio. scores Impact on O.S.
MVD Low
Hoechst/CD31 High
NS
NS
NS NS NS
–0.25
–0.25 0.25
1
0.01 0.001
Ratios of miR expression
(Tumours with high versus low MVDs)
0.1 1,000
100 10 1 0.1 0.01 0.001
100
50
50
25 75 100
Months 0
0
miRs
6 3 0
300
150 100 50 0
100 200
0
No. of nodes / HPF
No. of vessels/field
Haemoglobin (mg dl
–1)
Control miR
Low miR-192High miR-192 miR-192
miR-192
* *
****
Control miR
Control miR
Low miR-192 High miR-192
High miR-192
Probability (%)
Low miR-192 miR-192
miR-192 VEGFα
0 NS NS Positive
Negative Positive
miR-191-5p
miR-182-5p miR-192-5p miR-522-3p miR-378g miR-663a miR-181c-5p miR-200b-3p miR-96-5p miR-378b miR-1206 miR-205-5p miR-194-5p miR-191-5p
miR-192-5p miR-194-5p miR-181c-5p miR-200b-3p miR-182-5p miR-96-5p miR-205-5p miR-522-3p miR-663a miR-191-5p miR-192-5p
miR-194-5p miR-181c-5p miR-200b-3p miR-182-5p
miR-96-5p miR-205-5p miR-522-3p miR-663a
P<0.0001
P<0.001
P<0.05 P>0.05
ANGPTL1 ANGPTL7 ITGA10 EPHA4 EPHB2 HIF1A VEGFA EPHA2 PDGFA MMP23B EPHB4 EPHA1 MMP15 MMP17 EPHA6 MMP27 PTN ANGPTL4 ANGPT1 EPHA3 FGF2 FGF1 IL6 LEP MMP14
MMP2
MMP1 MMP3 MMP24 EFNA5 ITGB1BP2
ITGB1BP1 LEPR MMP13 NRP1 ITGA2 CXCL1 CXCL2
CXCR4 CCR3 ITGAD PLAT MMP7
MMP10 EFNA1 MMP9 MMP12
MMP25
MMP26 MMP21 MMP28 EPHB3 TGFA EPHA10 FLT4 MMP20 ITGA7 IL8 ITGB3 EPHB1 ITGBL1 MMP11 PDGFRB ANGPTL2 PTGS2
High throughput miRNA profiling
Correlation with angiogenic scores
Correlation with patient overall survival
Validation in clinical samples miR-192
In vitro and in vivo angiogenesis assay
MVD assessement in ovarian tumours (n= 133) MiRNA profiling in tumours with high versus low MVD (n= 24)
TCGA ovarian dataset (n= 559)
TCGA ovarian dataset (n= 561) 4 miRNAs showed significant negative
2 miRNAs correlated with prolonged survival
miR-192 showed promising anti-angiogenic property
An independent cohort of ovarian tumours (n= 128)
Negatively correlated with MVD in tumors Positively correlated with OS
miR-192; miR-194 13 miRNAs are highly downregulated in
tumours with high MVD
correlation with angiogenic factors
a b
c
d
e
f
VEGF
68% reduction in MVD in tumours with high levels of miR-192 compared with those with low tumoral levels of miR-192 (percentile cutoff¼0.33, Po0.0001, Fig. 1e). In this patient cohort, low tumoral miR-192 expression was also found to be significantly associated with worse OS (3.86 versus 6.85 years, log-rank P¼0.001, Supplementary Table 2), consistent with the results from TCGA ovarian data set. Importantly, tumoral miR-192 expression remained an independent predictor of survival following the multivariate analysis accounting for age, stage, grade and extent of cytoreduction (Po0.001, Cox proportional-hazards model). Our systematic analyses thus identified miR-192 as a key player in tumour angiogenesis (Fig. 1f). Indeed, pathway analysis of genes that are negatively associated with miR-192 expression in TCGA ovarian data set also revealed angiogenesis as one of the major pathways affected by this miRNA (Supplementary Table 3).
MiR-192 mediates global downregulation of angiogenic factors.
To identify the dominant angiogenic factors regulated by miR-192, we first examined the correlation between miR-192 and mRNA level of 65 angiogenic factors in TCGA ovarian cancer data set
(Supplementary Data 2). PTGIS and IL6 were among the top
molecules identified to have the strongest negative correlation with tumoral miR-192 expression (levels increased by 84%, P¼2.32
108 and 43%, P¼0.018 in tumours with low miR-192
compared with the ones with high miR-192, respectively; miR-192 percentile cutoff of 0.26 was used for defining high versus low expression). In contrast toPTGISwhere the level was not altered following miR-192 transfection, the cells treated with miR-192 displayed significantly lowerIL6mRNA levels compared with the
cells treated with control miRNA (45–95% reduction,
Supplementary Figs 1e and 2a). However, a luciferase assay using the entire 30-untranslated region (30-UTR) ofIL6revealed the lack of direct binding of miR-192 toIL6(Supplementary Fig. 2b).
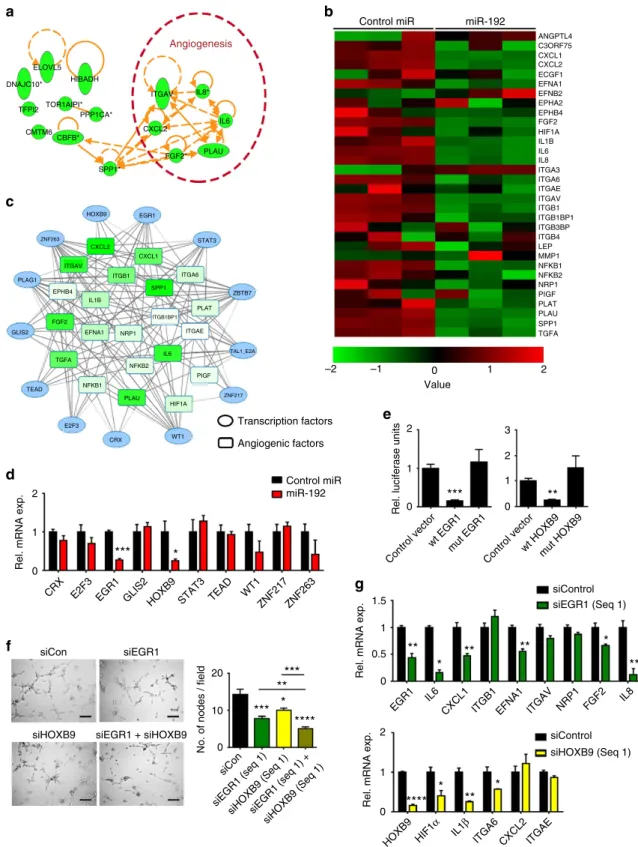
To systematically examine the molecular mechanisms by which miR-192 mediates its anti-angiogenic effect, a microarray was performed following miR-192 transfection in the SKOV3ip1 cells (Supplementary Data 3). Zinc Finger E-Box Binding Homeobox 2 (ZEB2), a known miR-192 target11, was used as a positive control for this experiment (Supplementary Fig. 2c). Pathway enrichment analysis using Netwalker12 showed that miR-192 significantly alters the angiogenesis pathway (P¼7.8106, Supplementary Data 4) and 6 out of the 15 most significantly downregulated genes are pro-angiogenic (Fig. 2a). Further examination of all pro-angiogenic factors that have log2 expression levels above 8 (control miRNA-treated cells) in the microarray data set revealed the ability of miR-192 to globally downregulate angiogenic pathways (Fig. 2b). We subsequently hypothesized that miR-192
mediates its global anti-angiogenic effect by targeting
transcription factors that regulate multiple angiogenic
molecules. Using the list of pro-angiogenic molecules shown in Fig. 2b, transcription factor analysis was performed using Genomatix software at a stringent matrix similarity score cutoff of 0.9. A total of 158 transcription factors were predicted to regulate more than five angiogenic factors with 13 of them predicted to be direct targets of miR-192 by at least four miRNA target prediction algorithms (Supplementary Table 4 and Fig. 2c). We next assessed the ability of miR-192 to target these transcription factors in SKOV3ip1 cells. The levels of ZBTB7,
PLAG1 and TAL1-E2A were not examined due to their low
expression levels in SKOV3ip1 cells. At 48 h following miR-192
transfection, EGR1 and HOXB9 mRNA levels were the most
downregulated by approximately 75% (Fig. 2d). The
downregulation of EGR1 and HOXB9 by miR-192 was further
confirmed in another ovarian cancer cell line, HeyA8
(Supplementary Fig. 2d). The EGR1 and HOXB9 protein levels were also both significantly downregulated following miR-192 transfection in both the cell lines examined (Supplementary Fig. 2e). Using the data set described in Supplementary Table 2, we further assessed the correlation between miR-192 and EGR1 or HOXB9 protein expression levels in human ovarian epithelial tumours. Tumoral miR-192 expression levels showed significant
inverse correlations with EGR1 (Po0.001) and HOXB9
(Po0.05) protein expression (n¼98, Supplementary Fig. 2f). Their expression in tumours also correlated with poor overall survival (Supplementary Fig. 2g). To assess whether EGR1and
HOXB9are direct targets of miR-192, luciferase assays using the
entire 30-UTR were performed. As compared with cells
transfected with control miRNA, the relative luciferase activity
for EGR1and HOXB9 were both significantly reduced by
miR-192 (Fig. 2e). For both genes, mutation of the predicted binding site (Supplementary Fig. 2h) abrogated knockdown, indicating
thatEGR1andHOXB9are both direct miR-192 targets.
We next examined the effect of EGR1 and HOXB9 on
angiogenesis. Tube formation assays were performed using RF24 cells exposed to conditioned media collected from either SKOV3ip1 (Fig. 2f) or HeyA8 cells (Supplementary Fig. 2i)
following silencing of EGR1 and/or HOXB9. Compared with
control short interfering RNA (siRNA), EGR1 silencing in the SKOV3ip1 cells resulted in 40% decrease in tube formation potential. Silencing of EGR1using another siRNA sequence in HeyA8 cells also produced a similar effect (Supplementary Fig. 2i). Exposing RF24 cells to conditioned media collected
from HOXB9 silenced cells also reduced their tube formation
potential irrespective of the cell line or siRNA sequence used (Fig. 2f and Supplementary Fig. 2i). Silencing both EGR1 and
HOXB9 resulted in a further reduction of tube formation
potential (Fig. 2f,Po0.01 orPo0.0001, compared with siEGR1
or siHOXB9 treatment alone, respectively). This effect was not fully rescued by replacing IL6 and IL8, two cytokines that are most downregulated by miR-192 treatment, in the conditioned media (Supplementary Fig. 2j). Importantly, we further showed that the observed decrease in tube formation potential upon
EGR1 or HOXB9 silencing in these cells is not a result of
decreased cell viability (Supplementary Fig. 2k).
To investigate whether the decrease in angiogenic potential
upon EGR1 or HOXB9 silencing is a result of the decreased
production of pro-angiogenic cytokines, we examined mRNA levels of pro-angiogenic factors that are predicted to be directly
regulated byEGR1orHOXB9.EGR1silencing in the SKOV3ip1
cells resulted in significant downregulation of IL6, IL8,CXCL1,
EFNA1 and FGF2 whereas HOXB9 silencing mediated
downregulation of HIF1a, IL1b and ITGA6 (Fig. 2g). Notably,
EGR1 and HOXB9 were both regulated by miR-192 but had
different downstream targets. Similar effects were observed in HeyA8 cells (Supplementary Fig. 2l). We further showed, via chromatin immunoprecipitation (ChIP) assays, that EGR1 and
HOXB9 can directly bind to the promoter regions of IL6 and
EFNA1 (EGR1) and IL1b and ITGA6 (HOXB9; Supplementary
Fig. 2m). Next, EGR1 and HOXB9 constructs which lack the
30-UTR component were used to generate cells that are insensitive
to miR-192 treatment. Importantly, restoring EGR1 abrogated
the miR-192 induced downregulation of EFNA1 and CXCL1.
In contrast, expression of bothEGR1andHOXB9was necessary to completely abrogate the effects of miR-192 on IL6, IL8, and
IL1b levels, with a rebound effect observed withIL1b (Fig. 3a). This rescue of pro-angiogenic factor expression in EGR1and/or
HOXB9 expressing cells resulted in significant abrogation of the
anti-angiogenic effects of miR-192. In contrast to empty lentiviral
vector (EV)-transduced SKOV3ip1 cells where miR-192
Transcription factors Angiogenic factors
siCon
siHOXB9 siEGR1 + siHOXB9 siEGR1
0 –1
–2 1 2
Value
Rel. luciferase units 0
1 2 3
Control vector Control vector wt EGR1 wt HOXB9
mut HOXB9 mut EGR1
miR-192 Control miR
0 2
1
siControl siEGR1 (Seq 1) 0
1 2
Rel. mRNA exp.
EGR1 CRX
STAT3 WT1ZNF217ZNF263 HOXB9
GLIS2
E2F3 TEAD
No. of nodes / field 0
20
10
* ***
*** **
0 1 1.5
0.5
Rel. mRNA exp.
*** * **** **
***
siCon
siHOXB9 (Seq 1) siHOXB9 (Seq 1) siEGR1 (seq 1)
siEGR1 (seq 1) +
Angiogenesis
HOXB9 HIF1
α
IL1β
ITGA6 CXCL2 ITGAE siControl siHOXB9 (Seq 1)
EGR1 IL6 ITGB1 ITGAV NRP1 FGF2
IL8
CXCL1 EFNA1
Rel. mRNA exp.
0 1 2
**** *
** ** ** *
***
** *
ANGPTL4
Control miR miR-192
C3ORF75 CXCL1 CXCL2 ECGF1 EFNA1 EFNB2 EPHA2 EPHB4 FGF2 HIF1A IL1B IL6 IL8 ITGA3
ITGAE ITGAV ITGB1
ITGB4 LEP MMP1
NFKB2 NRP1 PIGF PLAT PLAU SPP1 TGFA NFKB1 ITGB1BP1 ITGB3BP ITGA6 ELOVL5
DNAJC10* HIBADH
ITGAV
TFPI2
FGF2* PLAU
CMTM6 CXCL2
CBFB*
SPP1*
IL8*
IL6 TOR1AIPI*
PPP1CA*
HOXB9
CXCL2
ITGAV ITGB1
PLAU HIF1A
PIGF EPHB4
FGF2
TGFA IL1B
EFNA1 NRP1
NFKB2
NFKB1
IL6
ITGB1BP1
SPP1 ITGA6
ITGAE PLAT CXCL1
WT1 CRX
E2F3 TEAD GLIS2
PLAG1
EGR1
STAT3
ZBTB7
TAL1_E2A
ZNF217 ZNF263
a b
c
e
d
g
f
*
potential, only 30 and 20% downregulation in tube formation potential was achieved using conditioned media collected from
EGR1- and HOXB9-expressing SKOV3ip1 cells following
miR-192 treatment, respectively (Fig. 3b). Dual EGR1 and
HOXB9 expression resulted in complete rescue of the
anti-angiogenic effect of miR-192. Similar findings were also observed in HeyA8 cells (Supplementary Fig. 3). These results indicate that
EGR1andHOXB9are necessary and sufficient to account for the
anti-angiogenic effects of this miRNA.
Upstream regulation of miR-192. Next, we investigated the
potential mechanism by which miR-192 is downregulated in tumours. We first correlated miR-192 expression with copy number alteration and promoter methylation in each of the TCGA data sets (21 cancer types). No significant correlation was noted between copy number and expression. However, we observed strong negative correlations between methylation levels of four probes, which target miR-192 directly and overall
miR-192 expression levels in multiple cancer types
(Supplementary Table 5). Correlation in ovarian cancer was not assessed here as insufficient number of ovarian cancer samples had methylation 450 data available. As an alternative, to assess whether miR-192 expression is indeed regulated by methylation in ovarian cancer, we treated the SKOV3ip1 cells with azacitidine,
a methylation inhibitor. Unexpectedly, no rescue of miR-192 level was observed following the azacitidine treatment in the SKOV3ip1 cells (Supplementary Fig. 4a), despite successful demethylation of the miR-192 promoter region (Supplementary Fig. 4b). Minimal rescue of miR-192 levels was observed follow-ing the azacitidine treatment in HeyA8 cells (Supplementary Fig. 4a,b).
To examine other potential regulators of miR-192, we used Genomatix software to predict potential transcription factors that can bind to the miR-192 promoter region. Eighty-three potential candidates were identified using a stringent matrix similarity score cutoff of 0.95. Of these genes,ZEB1, ETV1and
TWIST1 were found to have significant correlations with
miR-192 expression in TCGA ovarian database (n¼559,
Po0.0001). Upon examining expression levels of these genes
and miR-192 in the NCI-60 cell line database13, we found
TWIST1 to have the most significant negative correlation with
miR-192 expression (Supplementary Fig. 4c). We, thus,
hypothesized that TWIST1, a transcription factor commonly
upregulated in hypoxia, can act as a transcriptional repressor for
miR-192. Indeed, when we introduced TWIST1 into both
SKOV3ip1 and HeyA8 cells, miR-192 levels were significantly decreased (Supplementary Fig. 4d). The ability of TWIST1 to bind to the promoter region of miR-192 was further assessed using a ChIP assay with an anti-TWIST1 antibody. Significant
a
b
SKOV3ip1-EV
miR-192
SKOV3ip1-EGR1 SKOV3ip1-HOXB9
SKOV3ip1-EGR1+HOXB9
Control miR
0 5 10 15
Control miR
miR-192
Control miR
miR-192
Control miR
miR-192
Control miR
miR-192
No
. of nodes / HPF
*** *
**
Rel.
mRNA e
x
p
.
0 0.5 1
1.5 EFNA1 FGF2
*
Rel.
mRNA e
x
p
.
IL-6
SKOV3ip1-EV SKOV3ip1-EGR1 SKOV3ip1-HOXB9 SKOV3ip1-EGR1+HOXB9 IL-8
***
0 0.5 1 1.5
Control miR
miR-192
Control miR
miR-192
Control miR
miR-192
Control miR
miR-192
Control miR
miR-192
Control miR
miR-192
Control miR
miR-192
Control miR
miR-192
Control miR
miR-192
Control miR
miR-192
* *
* **
** CXCL1
** **
*
IL-1
* * **
*
0 1 2 3
Control miR
miR-192
Control miR
miR-192
Control miR
miR-192
Control miR
miR-192
Control miR
miR-192
Control miR
miR-192
Control miR
miR-192
Control miR
miR-192
SKOV3ip1-EV SKOV3ip1-EGR1 SKOV3ip1-HOXB9 SKOV3ip1-EGR1+HOXB9
fold enrichment in the binding of TWIST1 to the miR-192 promoter region was observed compared with the IgG
control (Supplementary Fig. 4e, Po0.01). These results
indicate the potential role of TWIST1 in regulating miR-192 in
ovarian tumours. Given the role of TWIST1 in regulating
epithelial–mesenchymal transition, we further assessed whether there is a relationship between miR-192 level and epithelial morphology of ovarian tumours. We examined miR-192 expression in mesenchymal versus epithelial subtypes of ovarian tumours using TCGA ovarian data set14. We found thatTWIST1
is expressed at a much higher level in the mesenchymal group when compared with the epithelial group (Supplementary Fig. 4f,
P¼2.2e16). In contrast, miR-192 was expressed at a
significantly lower level in the mesenchymal group (P¼0.02), but the difference in expression between the epithelial and mesenchymal groups was marginal. This indicates that changes in epithelial–mesenchymal transition phenotype may not be the main function of this miRNA. We, thus, reasoned that while
TWIST1 and miR-192 are closely linked with each other, the
survival benefit that we observed with miR-192 is not purely a reflection of the difference inTWIST1expression.
In vivoeffects of miR-192 on ovarian cancer progression. Given the anti-angiogenic property of miR-192, we next examined the effect of miR-192 on tumour progression in orthotopic mouse models of ovarian cancer. We first introduced lentiviral vectors expressing control miRNA (SKOV3ip1-NC) or miR-192 (SKOV3ip1-miR-192) into SKOV3ip1 cells. Compared with
SKOV3ip1-NC cells, SKOV3ip1-miR-192 cells exhibit a
significant increase in miR-192 level (Supplementary Fig. 5a). Similar to the SKOV3ip1 cells treated with miR-192 mimics (Supplementary Fig. 1d), the RF24 cells treated with conditioned
media collected from SKOV3ip1-miR-192 cells showed
significantly reduced tube formation potential compared with that of SKOV3ip1-NC cells (Supplementary Fig. 5b). We subsequently injected SKOV3ip1-NC or SKOV3ip1-miR-192 cells into the peritoneal cavity of athymic nude mice (n¼10 per group). Tumour burden was assessed 4 weeks following the cell injection. Mice bearing SKOV3ip1-miR-192 tumours showed a 70% decrease in tumour burden (Po0.05, Fig. 4a) compared with mice in the SKOV3ip1-NC group. The number of tumour nodules was also decreased in mice bearing miR-192-expressing tumours (Supplementary Fig. 5c). Compared with SKOV3ip1-NC tumours, SKOV3ip1-miR-192 tumours showed a significant 55%
reduction in MVD (Po0.05), with a 50% increase in the
percentage of blood vessels covered with pericytes (Po0.05, Fig. 4b). This further corroborates the paracrine effect of tumoral miR-192 expression on blood vessel maturation. Notably, stable transduction of SKOV3ip1 with miR-192 had no effect on the growth rate compared with cells transduced with control miRNAin vitro (Supplementary Fig. 5d). These findings further point to the role of tumour microenvironment in mediating the anti-tumour effects of miR-192.
Having established the anti-tumour effect of miR-192in vivo, we next tested the feasibility of using miR-192 therapeutically to treat ovarian cancer. MiRNAs were delivered via intraperitoneal injection twice weekly using a well-characterized nanoparticle
platform, neutral DOPC nanoliposomes15–17. The SKOV3ip1
cells were injected into the peritoneal cavity of mice (n¼10 per group). There were two treatment groups: (1) non-targeting control (NC) miRNA-DOPC or (2) miR-192-DOPC. After 4 weeks of therapy, the animals were killed and necropsies were performed. Significant decreases in tumour weight
(85%, Po0.01), number of tumour nodules (80%, Po0.01)
and volume of ascites (95%, Po0.05) were observed following
miR-192-DOPC treatment when compared with mice treated with NC miRNA-DOPC (Fig. 4c, Supplementary Fig. 5e). No group showed decreased body weight, a major indicator of toxicity (Supplementary Fig. 5f). Moreover, histopathological examination of major organs following 4 weeks of miR-192-DOPC therapy revealed no abnormalities (Fig. 4d). Importantly, significant reductions inEGR1andHOXB9levels were observed in tumours following two doses of miR-192-DOPC treatments, compared with tumours treated with control miRNA-DOPC (Fig. 4e). Next, a survival experiment was carried out to assess the impact of miR-192 on survival in mice (n¼7). Mice bearing SKOV3ip1 tumours were treated with control miR or miR-192 containing DOPC nanoliposomes. The mice were killed individually once they became moribund, and a Kaplan–Meier curve was used to analyse the survival difference between the different treatment groups. We showed that miR-192 significantly enhanced survival (P¼0.009, Supplementary Fig. 5g).
Given the ability of miR-192 to modulate tumour angiogenesis, we next assessed the feasibility of treating ovarian tumours with combined therapy of miR-192 and topotecan, a chemotherapeutic agent with anti-angiogenic activity18. The mice were treated with miRNAs-DOPC twice weekly as described above and
topotecan was administered once weekly (intravenously,
5 mg kg1) starting 7 days after tumour cell implantation. The mice were killed after 4 weeks of therapy. Similar to the results obtained previously, miR-192-DOPC treatment reduced the tumour burden by approximately 85% (SKOV3ip1 model, Supplementary Fig. 5h). Compared with NC miRNA-DOPC alone, the mice treated with topotecan and NC miRNA-DOPC resulted in a 50% reduction in tumour burden. Combination treatment of miR-192 and topotecan resulted in a 40% further reduction in tumour weight compared with mice treated with NC miRNA-DOPC plus topotecan. We next sought to compare the anti-angiogenic and anti-tumour effect between miR-192 and murine anti-VEGF antibody, B20-4.1.1 (equivalent to bevacizumab, a clinically used anti-VEGF agent for the treatment of multiple cancer types). OVCA-432 high-grade serous ovarian cancer cells were injected into the peritoneal cavity of mice (n¼10 per group) and all the treatments started after tumours had been established (3 weeks following the tumour cell injection). There were four treatment groups: (1) Phosphate-buffered saline (PBS), (2) B20-4.1.1, (3) NC miRNA-DOPC and (4) miR-192-DOPC. All the mice were killed after 3 weeks of therapy. As expected, B20-4.1.1 treatment resulted in a significant reduction in tumour burden (60% reduction compared with PBS treatment, Po0.01, Fig. 4f). Notably, miR-192-DOPC therapy induced an even more profound tumour regression effect,
resulting in 490% reduction in tumour weight compared with
PBS treatment (Po0.0001). As miR-192 expression has been
previously reported to be associated with VEGF levels19, we assessed both miR-192 and miR-194 levels in tumours treated with B20. As expected, there was a modest increase in miR-192 level in B20-treated tumours when compared with the PBS control group, although the difference was not statistically significant (Supplementary Fig. 5i). This degree of increase in miR-192 level was significantly lower than that observed from miR-192-DOPC treatment (Supplementary Fig. 5j). Importantly, miR-192-DOPC treatment resulted in significant reduction in blood vessel density as well as increased pericyte coverage of residual blood vessels (Supplementary Fig. 5k). We showed that the ability of miR-192 to reduce blood vessel density was more
profound than that observed with the B20 treatment.
Importantly, B20 treatment did not affect the percentage of pericyte coverage of residual blood vessels. We further showed that miR-192-DOPC treatment resulted in a significant increase
0
*
1.5
Tumour weight (g)
0.5 1
SKOV3ip1-NC
SKOV3ip1-miR-192
CD31
Hoechst
/
Desmin
/
CD31
SKOV3ip1-NC SKOV3ip1-miR-192
No. of vessels
/HPF
0
*
*
**
6 12
Tumour weight (g) 0
3
1 2
Control miR miR-192
% Pericyte coverage
0 50 100
SK-NC
SK-miR-192
Spleen Liver Kidney Lung Heart
Control miR
miR-192
0 1 1.5
Rel. EGR1 exp.
0.5
**** ***
Control miR miR-192
Rel. HOXB9 exp. 0
1 1.5
0.5
Control miR miR-192
EV EGR1 HOXB9 EGR1+HOXB9
Control miR
miR-192
Tumour weight (g) 0 0.6
0.3
**** **** ******
PBS B20
Control miR miR-192
Tumour weight (g) 0
1 2 3
** ***
*
Control miR
miR-192
Control miR
miR-192
Control miR
miR-192
Control miR
miR-192
Control miR
miR-192
SKOV3ip1-EV SKOV3ip1-EGR1+HOXB9
SKOV3ip1-EV
SKOV3ip1-EGR1+HOXB9
Hoechst/Desmin/CD31
0 5 10 15
No. of
vessels/HPF
*
*
% Pericyte coverage
0 50 100
Control miR
miR-192
Control miR
miR-192
SKOV3ip1-EV SKOV3ip1-EGR1
SKOV3ip1-HOXB9 SKOV3ip1-EGR1+HOXB9
a b c
d e
f g
h
Figure 4 | Anti-angiogenic and therapeutic effects of miR-192 in orthotopic mouse models of ovarian cancer.(a) Aggregate mass of intraperitoneal implanted SKOV3ip1-NC and SKOV3ip1-miR192 tumours (n¼10, Student’st-test). (b) Effect of miR-192 expression on MVD and vessel pericyte coverage in SKOV3ip1 tumours (n¼5, Student’st-test). Higher magnification images are shown in the insets. (c) Effect of miR-192-DOPC treatment on tumour weight in SKOV3ip1 tumour-bearing mice (n¼10, Student’st-test). (d) Histopathological examination of major organs following 4 weeks of control miRNA-DOPC or miR-192-DOPC therapy (n¼3). (e) TumoralEGR1andHOXB9levels following two doses of control miRNA-DOPC or miR-192-DOPC therapies in SKOV3ip1 tumours (n¼5, Student’st-test). (f) The effects of B20, control miRNA-DOPC or miR-192-DOPC on tumour burden in mice bearing OVCA-432 tumours (n¼10, studentt-test). (g) The impact of miR-192-DOPC on tumour burden in orthotopic SKOV3-EV,EGR1,HOXB9and
Supplementary Fig. 5l). Collectively, these results indicate that significant therapeutic benefit can be derived from miR-192-mediated inhibition of multiple pro-angiogenic pathways simultaneously.
We next assessed whether the anti-angiogenic effect of
miR-192 can be abrogated by EGR1and/or HOXB9 expression
in SKOV3ip1 tumours. EGR1and HOXB9 constructs that lack
the 30-UTR component were used to generate cells that are
insensitive to miR-192 treatment. SKOV3ip1-empty vector (EV),
SKOV3ip1-EGR1, SKOV3ip1-HOXB9 and SKOV3ip1-EGR1þ
HOXB9 cells were injected into the peritoneal cavity of mice.
The mice were then treated with control miRNA-DOPC or miR-192-DOPC twice weekly for 4 weeks. In contrast to the SKOV3ip1-EV tumours where miR-192 treatment resulted in a 90% reduction in tumour burden, only 65 and 30% reduction in
tumour burden was observed for tumours expressing EGR1and
HOXB9, respectively (Fig. 4g). The expression of bothEGR1and
HOXB9in tumours completely abrogated the anti-tumour effect
of miR-192. Only minimal decreases in MVD and increases in the extent of pericyte coverage of residual blood vessels were observed
in tumours expressing bothEGR1andHOXB9after the miR-192
treatments (Fig. 4h), emphasizing the key rolesEGR1andHOXB9
play in mediating the anti-angiogenic effects of miR-192. We
further confirmed that while EGR1 and HOXB9 expression
decreased the extent of pericyte coverage around the blood vessels, their expression has minimal effect on desmin levels in pericytes or pericyte-like cells (Fig. 4h and Supplementary Fig. 5m). Importantly, in SKOV3ip1-EV tumours, tumour vasculature following the miR-192 treatment was significantly less permeable than the control miRNA group (Supplementary Fig. 5n). In contrast, minimal difference in vessel permeability
was observed between SKOV3ip1-EGR1þHOXB9 tumours
treated with control miRNA and miR-192.
Effects of miR-192 on angiogenesis in renal cancer. To assess
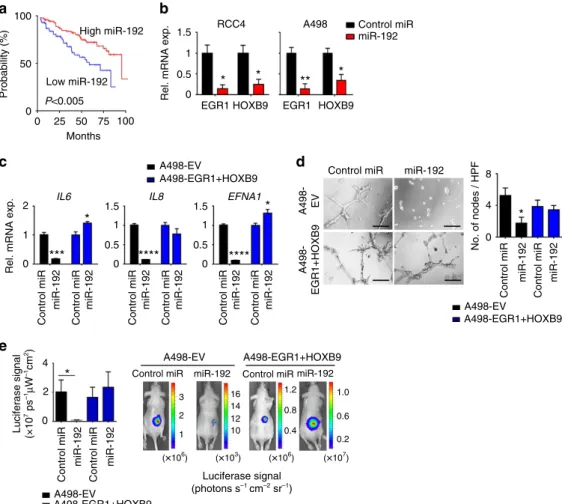
whether miR-192 can also affect tumour angiogenesis in other cancer types, we examined the level of miR-192 in tumours across 19 cancer types using TCGA data sets (Supplementary Fig. 6a). Since clear-cell renal carcinomas are highly angiogenic20, and anti-angiogenic agents are the mainstay of treatment for kidney cancer, we hypothesized that miR-192 treatment may show therapeutic benefit in renal cancer patients with low endogenous tumoral miR-192 expression. Indeed, renal cancers were found to have a large dynamic range of miR-192 expression (Supplementary Fig. 6a), and patients with tumours expressing low levels of miR-192 had significantly worse OS (median OS of 69 versus 147 months for tumours with low versus high miR-192 expression, respectively, Po0.005; percentile cutoff¼0.29; Fig. 5a).
We introduced miR-192 mimics into two renal cancer cell lines, RCC4 and A498. Similar to ovarian cancer, miR-192
treatment mediated a robust downregulation of EGR1 and
HOXB9 levels (Fig. 5b) and significant decreases in several
angiogenic factors including IL6, IL8 and EFNA1 (Fig. 5c);
consistent with the pattern observed after siEGR1/siHOXB9
treatment (Supplementary Fig. 6b,c). Exposing the RF24 cells to conditioned media collected from RCC4 or A498 cells treated with miR-192 resulted in 50–70% decrease in tube formation potential when compared with control miRNA treatment (Fig. 5d, Supplementary Fig. 6d). This miR-192-mediated anti-angiogenic effect was significantly reduced following the rescue of
EGR1 and/or HOXB9 levels by lentiviral transduction in these renal cancer cells (Fig. 5c,d, Supplementary Fig. 6d).
To assess the therapeutic effect of miR-192 in renal cancer, we injected A498 renal cancer cells expressing an EV or bothEGR1
and HOXB9(A498-EV and A498-EGR1þHOXB9, respectively)
into the subcapsular space in the kidneys of mice. All the cells were luciferase-labelled to enable the assessment of tumour burden. Starting 7 days following the cell implantation, the mice were treated with DOPC nanoliposome-delivered control miRNA or miR-192 twice a week. MiR-192 treatment resulted in a495% decrease in tumour burden in mice bearing A498-EV tumours (Fig. 5e). In contrast, the tumours expressing EGR1 and HOXB9 proteins failed to respond to miR-192 therapy, again demonstrating the central role of these two proteins in miR-192-mediated anti-tumour effect. Collectively, both the in vitro and
in vivoresults shown here were consistent with those observed in
ovarian cancer models, indicating the broad implications of modulating miR-192 in different cancer types.
Discussion
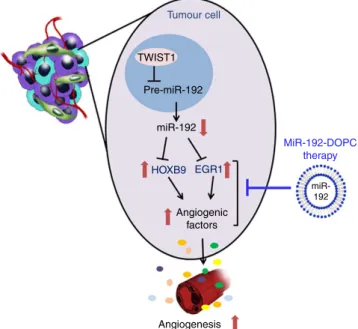
Using an integration of systems-based bioinformatics coupled with experimental models, we rigorously document here the central role of miR-192 in regulating tumour angiogenesis. To date, no other miRNA has been identified to have such a global effect on angiogenesis. We demonstrated that the potent anti-angiogenic effect of miR-192 stems from its ability to globally downregulate angiogenic pathways in cancer cells
through regulating two key transcription factors, EGR1 and
HOXB9(Fig. 6). Using the DOPC nanoliposomal platform, which
is currently being tested in clinical trials, we showed that miR-192 can mediate potent anti-angiogenic and anti-tumour effects in multiple orthotopic mouse models of ovarian and renal cancer. The anti-angiogenic and anti-tumour effects of miR-192 were found to be much more robust than that achieved with anti-VEGF antibody. As upregulation of the compensatory pro-angiogenic signalling cascades has been shown to play a crucial role in resistance to anti-angiogenic therapy, our finding of the global anti-angiogenic effect of miR-192 represents a promising new approach for targeting tumour angiogenesis.
Although the downregulation of miR-192 has been previously observed in multiple cancer types21–25, its clinical relevance and the feasibility of using it as a therapeutic agent are currently unknown. Here, using large-scale patient data sets, we demonstrated that decreased tumoral miR-192 levels are associated with increased angiogenesis and poor overall survival in patients with high-grade serous ovarian or renal clear cell carcinomas. We further presented several lines of pre-clinical evidence demonstrating the marked therapeutic potential of miR-192 in ovarian and renal cancer models without causing toxicity in normal organs. To date, the biological function of miR-192 has been reported predominantly in the areas of cell survival26and metastasis through direct targeting of MDM2, TYMS, SIP1 or
ZEB2 (refs 21,24,27–29). While its effect on these genes could contribute partially to its anti-tumour activity, recent studies that used systematic translational approaches to identify key microRNAs important for metastasis did not identify miR-192 to be the top regulator for cancer metastasis30–32. In contrast, the miR-200 family, which has been reported to play key roles in angiogenesis16 and metastasis33, was identified in both our angiogenesis-specific analysis as well as the metastasis focused analysis reported by Mudduluruet al.30The investigation of the specific role of miR-192 in regulating tumour angiogenesis is thus warranted. Previous reports have documented the ability of
miR-192 to negatively regulate factors such as VEGFA34 or
ICAM1(ref. 35) leading to inhibition of metastatic colonization of
tumour cells. However, the mechanism by which this miRNA mediates its broad anti-angiogenic effect was not established. We
report here that EGR1 and HOXB9 transcription factors are
responsible for mediating the broad anti-angiogenic function of
rescued this effect. Importantly, we showed that miR-192 is able to mediate profound anti-angiogenic and anti-tumour effects
in vivo, independent of its impact on cancer cell growth.
The central role ofEGR1andHOXB9in tumour angiogenesis
has recently been recognized. For instance,EGR1was shown to be important in mediating angiopoietin-1-induced endothelial cell proliferation, migration and differentiation36. Both these transcription factors have been reported to bind directly to the promoter regions of several angiogenic factors, such as IL8,
VEGF and FGF2, resulting in increased production of these
cytokines37–41. Through integrative analyses in this study, we uncovered the new roles ofEGR1andHOXB9in regulating other important angiogenic factors, including CXCL1,EFNA, IL6and
IL1b. Importantly,EGR1and HOXB9have both been shown to
correlate with poor patient survival in multiple cancer types42–46. The identification of miR-192 as a common upstream regulator of these two key transcription factors is thus of high importance
given that to date, mechanisms ofEGR1andHOXB9regulation
are still largely unknown and no effective therapeutic means has been developed to regulate their expression.
Given the ability of miR-192 to globally downregulate the angiogenic pathways, it provides a central node to potently block
tumour angiogenesis. The ovarian and renal cancers are both highly angiogenic cancer types, with high miR-192 levels correlating with significantly improved patient survival. As such, it is anticipated that patients whose tumours have low miR-192 expression would greatly benefit from miR-192 therapy. Collectively, our data provide an important advance in understanding the importance and mechanism of miR-192 in regulating tumour angiogenesis. Our complete understanding of this mechanistic pathway will open rational avenues for therapeutic interventions and novel combination therapies for cancer patients.
Methods
Cell lines and cell growth assays.All ovarian cancer cell lines (SKOV3ip1, HeyA8, OVCAR-8, OVCA-432) were maintained in RPMI 1640 media supplemented with 15% fetal bovine serum (FBS) and 0.1% gentamicin sulfate (GeminibBioproducts, Calabases, CA, USA; refs 47,48). The A498 and RCC4 cell lines were kindly provided by Dr Eric Jonasch (M.D. Anderson Cancer Center) and were maintained in DMEM-high glucose supplemented with 10% FBS and 0.1% gentamicin. The RF24 cells were maintained in MEM supplemented with 10% FBS, sodium pyruvate, MEM vitamins,L-glutamine, and MEM non-essential amino acids. 10T1/2 pericyte-like cells were maintained in DMEM-high glucose supplemented with 10% FBS and 0.1% gentamicin. All the cell lines were routinely
0 50 100
Probability (%)
P<0.005
High miR-192
Low miR-192
0 50 100
Months
25 75
0 0.5 1 1.5
Rel. mRNA exp.
EGR1 HOXB9 RCC4
* *
A498 Control miR miR-192
EGR1 HOXB9
** *
A498-EV
A498-EGR1+HOXB9 Control miR miR-192
Rel. mRNA exp. 0
1
2 IL6
Control miR
miR-192
Control miR
miR-192
*** *
0 0.5 1 1.5
Control miR
miR-192
Control miR
miR-192
IL8
****
0 0.5 1 1.5
**** *
Control miR
miR-192
Control miR
miR-192
EFNA1
A498- EV
A498-EGR1+HOXB9
0 4 8
No. of nodes / HPF
Control miR
miR-192
Control miR
miR-192
*
A498-EV
A498-EGR1+HOXB9
Luciferase signal (×10
7 ps –1μ
W
–1cm 2)
0 4
2
Control miR
miR-192
Control miR
miR-192
*
A498-EV
A498-EGR1+HOXB9
A498-EV A498-EGR1+HOXB9
Control miR miR-192 Control miRmiR-192
(×106)
1 2 3
(×103)
10 12 14 16
Luciferase signal (photons s–1
cm–2
sr–1
)
1.2
0.4 0.8
(×106) (×107)
0.2 0.6 1.0
a b
c d
e
tested to confirm the absence of Mycoplasma. Cell lines were validated by Short Tandem Repeat (STR) DNA fingerprinting using the Promega 16 High Sensitivity STR Kit. The STR profiles were compared with online search databases (DSMZ/ATCC/JCRB/RIKEN) of 2,455 known profiles; along with the MD Anderson Characterized Cell Line Core database of 2,556 known profiles. The STR profiles matched known DNA fingerprints or were unique. All thein vitro experiments were conducted with 60–80% confluent cultures. For cell growth assays, the cells were plated in six-well plates in triplicate and were counted each day for 6 days using a Beckman Coulter cell counter.
TCGA data exploratory analyses.We used clinically annotated data from TCGA obtained from the Open-Access and Controlled-Access tiers of the TCGA Data Portal (http://tcga-data.nci.nih.gov/tcga/findArchives.htm) with NIH approval. The expression data for all the miRNAs were obtained from Agilent miRNA microarrays and Illumina miRNA-Seq data sets. For the miRNA-Seq data, we derived the ‘reads_per_million_miRNA_mapped’ values for mature forms for each miRNA from the ‘isoform_quantification’ files. For the miRNA-Seq data sets, the following MIMAT numbers were analysed: MIMAT0000259 (hsa-miR-182-5p), MIMAT0000222 (hsa-miR-192-5p), MIMAT0002868 (hsa-miR-522-3p), MIMAT0018937 (hsa-miR-378g), MIMAT0003326 (hsa-miR-663a), MIMAT0000258 (hsa-miR-181c-5p), MIMAT0000318 (hsa-miR-200b-3p), MIMAT0000095 (hsa-miR-96-5p), MIMAT0014999 (hsa-miR-378b), MIMAT0005870 (hsa-miR-1206), MIMAT0000266 (hsa-miR-205-5p), MIMAT0000460 (hsa-miR-194-5p) and MIMAT0000440 (hsa-miR-191-5p). The analyses were carried out in R statistical environment (version 3.0.1) (http:///www.r-project.org/). All the tests were two-sided and considered statistically significant at the 0.05 level. Clinical associations were used to prioritize the 13 anti-angiogenic miRNAs for further investigation (Fig. 1). Kaplan–Meier curves were plotted for all the data sets. For each miRNA, the tumour samples were dichotomized into high and low miRNA expression groups at percentile cutoffs between 0.25 and 0.75 with a step of 0.01. The optimal cutoff percentile (as determined by the lowestPvalue) was identified for each miRNA. For each miRNA, we tested whether a log-rank test applied at any cut-point would yield a nominalPvalueo0.05; this flagged three miRNAs for further investigation.
For the miRNA-angiogenic factor correlation study, we examined the expression levels of all the previously reported pro-angiogenic factors in the TCGA ovarian data set (Agilent miRNA microarray and Agilent mRNA data sets were used). The list of pro-angiogenic factors examined is presented in Supplementary Data 2. We first checked and selected those pro-angiogenic genes that are consistently expressed in TCGA samples. A ‘pro-angiogenic’ signature score was subsequently computed for each TCGA sample using the formulae below
(equation (1))10:
Score¼X N
n¼1
geneexpr;n ð1Þ
Here,Nis the number of genes in the list, the parameter geneexpr,nfor a sample is 1
if the sample has a level of genenabove the median for all the TCGA samples and
1 otherwise. The list of samples used for this analysis is presented in Supplementary Table 6. The median expression of each angiogenic factor is included in Supplementary Data 2. The correlation between the angiogenesis score and miRNA expression was subsequently assessed for each miRNA for all the samples (Spearman rank correlation). The contrasts between the angiogenic score and component miRNA expression values were also used for filtering miRNAs for follow-up; nominalPvalues for our best four miRNAs wereo0.0001 (Fig. 1).
For the methylation analyses, we examined all the tumour tissue types in TCGA that have methylation 450 data available. After eliminating the data from replicate samples, we plotted miR-192 expression against the beta value for each of the associated methylation probes (cg02258444-11-64658622, cg09349409-11-64658765, cg18262830-11-64658819 and cg27083891-11-64658726). We subsequently performed Spearman correlation analyses between miR-192 expression and the beta values for each probe.
Effect of miR-192 expression on mesenchymal phenotype.Agilent 244K gene expression data and miRNA-seq expression data were obtained from the open-access and controlled-access tiers of the TCGA data portal, with NIH approval. The ovarian cancer tumour subtype information was obtained using a previously established protocol14. The expression of miR-192 and TWIST1 were compared between the mesenchymal and epithelial groups using the Wilcoxon rank-sum test.
In vitromiRNA and siRNA transfection.The cells were transfected with 100 nM of specified siRNAs using RNAiMax reagent (Invitrogen) at 3ml reagent: 1mg siRNA ratio49. The cells were treated with siRNAs for 4 h in serum-free media before incubation in fresh complete media for the specified time frame. All the siRNA sequences are listed in Supplementary Table 7. For miRNA, reverse transfection technique was used16. The cells were transfected with 40 nM miRNA in media containing 10% FBS and the media were changed 4 h following transfections to minimize toxicity. All the siRNAs were obtained from Sigma and miRNAs were obtained from Life Technologies. MiRVana miRNA mimic negative control #1 (catalogue number 4464061, ThermoFisher Scientific) was used as the negative control.
Quantitative reverse transcription polymerase chain reaction.RNA was isolated from the cells or tumours using Direct-zol RNA miniprep kit (Zymo Research) according to the manufacturer’s protocol. cDNA was synthesized using a Verso cDNA kit (Thermo Scientific) as per manufacturer’s instructions. Quanti-tative reverse transcription PCR (RT–PCR) was performed on a 7500 Fast Real-Time PCR System (Applied Biosystems)48. All primer sequences for mRNA detection are listed in Supplementary Table 8.b-actin mRNA was used as the normalizing control. For miRNA detection, Ambion assay probe sets (Life technologies) were used according to the manufacturer’s protocol. RNU44 and RNU6B were used as the normalizing control.
Cell apoptosis assay.Cell apoptosis assay was performed using the Annexin V/propidium iodide (Invitrogen) staining kit according to the manufacturer’s instructions. Cells were stained with fluorescein isothiocyanate-conjugated Annexin V and propidium iodide for 30 min and were analysed by flow cytometry to determine the percentage of apoptotic cells.
Methylation-specific PCR.MethPrimer software (http://www.urogene.org/meth-primer/) was used for design of methylation-specific primers for miR-192 (Supplementary Table 8). Total DNA was isolated from cells using the DNeasy blood and tissue kit (Qiagen) as per the manufacturer’s protocol, followed by treatment with bisulphite using a methylation kit (EZ DNA Methylation-Direct; Zymo Research, Orange, CA). Using real-time PCR, as described above, quantification of methylation was performed by comparing the ratios of unmethylated/methylated levels in the control sample and the samples treated with 5-azacytidine (Sigma).
30-UTR assay.GoClone pLightSwitchIL-6,EGR1andHOXB930-UTR luciferase reporter constructs were obtained from SwitchGear genomics (Menlo Park, CA, USA). ForEGR1andHOXB9, mutated constructs were also synthesized with the predicted miR-192 binding sites deleted (Supplementary Fig. 2h). The SKOV3ip1 cells were transfected with FuGENE HD reagent in a 96-well plate with control miRNA or miR-192 (40 nM) along with the 30-UTR reporter constructs, and Cypridina TK control construct (pTK-Cluc) as per the manufacturer’s protocol50. After 24 h of transfection, luciferase activity was obtained using LightSwitch Dual Luciferase assay kits. All the assays were performed in quadruplicate.
Tumour cell
TWIST1
Pre-miR-192
miR-192
HOXB9 EGR1
Angiogenic factors
Angiogenesis
MiR-192-DOPC therapy
miR-192
Immunoblotting.Protein lysates were prepared from cultured cells using RIPA buffer supplemented with protease and phosphatase inhibitors51. The protein concentrations were determined using a BCA Protein Assay Reagent kit (Pierce Biotechnology, Rockford, IL, USA). The lysates were loaded and separated on 10% SDS–polyacrylamide gels. Nitrocellulose membranes were subsequently probed with primary antibodies against EGR1 (1:1,000, Cell Signaling, Catalogue number 4153), HOXB9 (1:1,000, Abcam, Catalogue number ab66765) andb-actin (1:5,000, Sigma, Catalogue number A5316) in 5% BSA in TBS-T overnight at 4°C. After washing with TBS-T, the membranes were incubated with horseradish peroxidase (HRP)-conjugated secondary antibodies (1:2,000, GE Healthcare, Catalogue numbers NA931 and NA934) for 2 h. HRP was visualized using an enhanced chemiluminescence detection kit (PerkinElmer, Catalogue number NEL104001EA). Full scans of important western blots are provided in Supplementary Fig. 7.
ChIP assay.ChIP assays were performed using ChIP-IT Express Kit (Active Motif) as per the manufacturer’s instructions. Briefly, crosslinked cells were collected, lysed, sonicated and subjected to immunoprecipitation with TWIST1 (Abcam, Catalogue number Ab50887), EGR1 (Cell Signaling, Catalogue number 4153), HOXB9 (Abnova, Catalogue number H00003219-M05) or IgG isotype control (Millipore, Catalogue number 12–371B for mouse IgG and Cell Signaling, Catalogue number 2729, for rabbit IgG) antibodies. Immunocomplexes were collected using protein A/G agarose magnetic beads and were eluted. PCR-based quantification of fold enrichment in TWIST1, EGR1 or HOXB9 binding to miR-192,IL6,EFNA1,IL1borITGA6promoter regions was subsequently performed.
Liposomal nanoparticle preparation.MiRNA forin vivodelivery were incorporated into DOPC liposomes49,52. DOPC and miRNA were mixed in the presence of excess tertiary butanol at a ratio of 1:10 (w/w) miRNA/DOPC. Tween 20 was added to the mixture in a ratio of 1:19 Tween 20:miRNA/DOPC. The mixture was then vortexed, frozen in an acetone/dry ice bath and lyophilized. Beforein vivoadministration, this preparation was hydrated with PBS at room temperature (5mg miRNA per 200ml).
Orthotopicin vivomodels of ovarian and renal cancer.Female athymic nude mice (8–12 weeks old) were obtained from the National Cancer Institute, Frederick Cancer Research and Development Center (Frederick, MD, USA). All the mouse studies were approved and supervised by the M.D. Anderson Cancer Center Insti-tutional Animal Care and Use Committee. For the therapeutic experiments, 10 mice were assigned per treatment group. This sample size gave 80% power to detect a 50% reduction in tumour weight with 95% confidence. To establish intraperitoneal ovarian tumours, cells were injected into the peritoneal cavity (intraperitoneally) at a concentration of 5–15106cells ml1(200ml per injection). For the renal cancer model, renal cancer cells were injected into the renal subcapsular space in the right kidney (0.3 million cells in 30ml HBSS). For therapeutic tumour growth inhibition experiments, all the mice were treated with miRNA-DOPC (5mg, intraperitoneally) twice a week beginning at 1 week following the tumour cell injection. For tumour regression experiments, the mice received miRNA-DOPC treatments (5mg, intra-peritoneally) twice a week starting on day 21 following the tumour cell injection. Luciferase imaging was used to confirm tumour establishment before initiation of the treatments16. Anti-VEGF B20–4.1.1 antibodies were administered intraperitoneally twice a week (5 mg kg1, Genetech) and topotecan was administered intravenously once a week (5 mg kg1, Sigma). The mice (n¼10 per group) were monitored for adverse effects and the tumours were harvested after 3–4 weeks of therapy or when any of the mice began to appear moribund. To examine the vessel permeability and structure, three mice per treatment group received FITC-dextran (100ml, 10 mg ml1, 2,000,000 MW; Sigma) before being killed. Ten minutes following the dextran injection, the mice were perfused through the left ventricle with 4% paraformaldehyde in PBS16. The mouse weight, tumour weight and the number/ location of tumour nodules were recorded. The tissues were fixed in 10% formalin or embedded in Tissue-Tek optimal cutting temperature formulation for subsequent sectioning16,49. For the survival experiment, mice bearing SKOV3ip1 tumours were treated with control miRNA-DOPC or miR-192-DOPC twice a week starting at 1 week following the tumour cell injection. The mice were killed individually once they became moribund. A Kaplan–Meier curve was used to analyse the survival difference between control and treatment groups.
In vivomatrigel plug assay.After transfecting the SKOV3ip1 cells with either control miRNA or miR-192 (40 nM), cells were exposed to serum-free media for 48 h. We then collected the supernatants and centrifuged them to remove cells. The conditioned media were then mixed with phenol-red-free Matrigel (2:3 proportion, total 0.5 ml; BD Biosciences). The mixture was then injected into each mouse subcutaneously (n¼3 per group)16. VEGF (0.25 nM, R & D Systems) was used as a positive control. The mice were killed on day 8 and matrigel plug was examined for haemoglobin content using the QuantiChrom hemoglobin assay kit as per the manufacturer’s protocol (BioAssay Systems).
High-throughput miRNA profiling.Total RNA from human ovarian tumours was extracted using mirVana RNA isolation labeling kit (Ambion) according to the manufacturer’s protocol. RNA purity was assessed by a Nanodrop spectro-photometric measurement (Thermo Scientific) of the OD260/280 ratio with acceptable values falling between 1.9 and 2.1. RNA was diluted to 50mgml1using RNase-free water and 3ml was used for miRNA profiling on the multiplexed nCounter Human v2 miRNA platform (NanoString Technologies, Seattle, WA, USA)53. RNA samples were prepared by ligating a specific DNA tag (miR-tag) onto the 30end of each mature miRNA as per the manufacturer’s instructions. Excess tags were removed by restriction digestion at 37°C. Hybridizations were carried out by combining 5ml of each miRNA-Tag sample with 20ml of nCounter Reporter probes in hybridization buffer and 5ml of nCounter Capture probes at 65°C for 16–20 h. Excess probes were removed using a two-step magnetic bead-based purification on the nCounter Prep Station. Abundance of specific target molecules was quantified using the nCounter Digital Analyzer by counting the individual fluorescent barcodes and assessing target molecules. The data were collected using the nCounter Digital Analyzer and were analysed using the nCounter Analysis system as per the manufacturer’s instruction.
Microarray and pathway enrichment analyses.Microarray was performed on Human HT-12 v4 Beadchip (Illumina) as per the manufacturer’s protocol50. The SKOV3ip1 cells were treated with control miRNA or miR-192 (40 nM) using RNAiMAX transfection reagent. Total RNA was extracted 48 h following transfection using mirVana RNA isolation labeling kit (Ambion). RNA purity was assessed by a Nanodrop spectrophotometric measurement (Thermo Scientific) of the OD260/280 ratio with acceptable values falling between 1.9 and 2.1. Five hundred nanograms of total RNA were used for labelling and hybridization according to the manufacturer’s protocols. After the bead chips were scanned with an Illumina BeadArray Reader (Illumina, San Diego, CA, USA), the microarray data were normalized using the quantile normalization method in the Linear Models for Microarray Data package in the R language environment. The expression level of each gene was transformed into a log2base before further analysis. Ingenuity IPA software was used to identify the genes that are most significantly downregulated following the miR-192 treatment. The pathway enrichment analyses were performed using NetWalker software16,54. Briefly, scoring of network components (nodes, edges) for their relevance to a given data set is done by a random walk-based scoring strategy by using the data values of nodes as transition probabilities. Each interaction is assigned a probability value based on the data values of nodes in the
neighbourhood. Final relevance scores of nodes are given by their visitation frequencies by the random walk at the end of infinite iterations.
Immunohistochemistry and immunofluorescence analyses.Staining was per-formed in paraffin-embedded tumour sections as described previously16,49. For patient samples, tissue microarray slides containing 128 ovarian cancer samples were obtained from Wayne State University following approval by the Institutional Review Board. All participants provided written informed consent. The three most hypervascular areas in each tumour sample were selected for MVD assessment (CD34 staining, 1:20, BioGenex Laboratories). The mean value for the three fields was recorded and was expressed as the number of vessels per HPF (200). For EGR1 and HOXB9 staining, antigen retrieval was performed using Borg Decloaker solution (Biocare Medical). The slides were subsequently incubated with primary antibodies against EGR1 (1:50, Cell Signaling, Catalogue number 4153) or HOXB9 (1:200, Abcam, Catalogue number ab66765) at 4°C overnight, followed by incubation with DAKO EnVision Dual link system-HRP (Dako). The stained slides were scored by two investigators blinded to patient survival information or miR-192 expression levels. A scoring system, which considered both the intensity of staining and the percentage of cells stained, was used55,56. H scores of4100 andr100 were defined as high and low expression, respectively. All the slides were counterstained with Gill’s hematoloxylin #3.
For cleaved caspase-3 staining, formalin-fixed paraffin sections were deparaffinized, and endogenous peroxide was blocked by incubating the slides with 3% hydrogen peroxide in PBS. The slides were incubated in 4% fish gelatin in PBS, followed by an overnight incubation with the cleaved caspase-3 primary antibody (1:100, Biocare Medical, Catalogue number CP229C). The slides were then incubated with biotinylated goat anti-rabbit secondary antibody (Biocare Medical, Catalogue number GR602H) for 20 min, after which they were washed with PBS and were later incubated with streptavidin HRP label (Biocare Medical, Catalogue number HP604H) for 20 min. All the slides were counterstained with Gill’s hematoloxylin #3.