APPLICATIONS OF SENSORY PERCEPTUAL METRICS TO SCREEN, TO TRACK CHANGES IN, AND TO DIFFERENTIATE
CLINICAL POPULATIONS
Richard Hajime Nguyen
A dissertation submitted to the faculty of the University of North Carolina at Chapel Hill in partial fulfillment of the requirements for the degree of Doctor of Philosophy
in the Department of Biomedical Engineering.
Chapel Hill 2014
Approved by:
Mark A. Tommerdahl
Robert G. Dennis
Oleg V. Favorov
James C. Garbutt
©2014
ABSTRACT
RICHARD NGUYEN: Applications of sensory perceptual metrics to screen, to track changes in, and to differentiate clinical populations.
(Under the direction of Mark A. Tommerdahl, Ph.D.)
In order to overcome limitations in current neurological screening methods, a portable, non-invasive, vibrotactile mechanical stimulator was developed to rapidly and quantitatively analyze various features of central information processing. Understanding the neurobiological processes involved in somatosensory perception of particular types of tactile stimulation, the general hypothesis on which these studies are based is that any systemic changes in central information processing can be attributed to variations observed in sensory perceptual metrics. These evaluations were designed to allow investigation into fundamental neurobiological mechanisms involved in cortical interactions and brain functionality. The uniqueness of each of the protocols has thus far demonstrated significant sensitivity to detecting alterations in various types of central information processing. This research explores the application of the method within young adult clinical populations—migraine,
alcoholism, and concussion—which can benefit from additional or improved assessments. Analysis of the results revealed that sensory perceptual metrics could screen, track changes in, and
ACKNOWLEDGEMENTS
This research could not have been conducted without the guidance from my advisors, the
assistance from my colleagues and collaborators, and the support from my family. Firstly, I am
grateful to Dr. Mark Tommerdahl, Dr. Oleg Favorov, and Dr. Bob Dennis for their mentorship
and insight throughout this research. Furthermore, I would like to thank Jameson Holden, Eric
Francisco, and Zheng Zhang as well as other colleagues and staff members for assisting me in
the laboratory. I would like to also especially thank the collaborators, Dr. J.C. Garbutt and Dr.
Rick Gracely, for their support. Lastly, I thank my family members, Linda, Chanh, and Catherine
TABLE OF CONTENTS
LIST OF TABLES ... viii
LIST OF FIGURES ... ix
LIST OF ABBREVIATIONS ... x
CHAPTER 1. INTRODUCTION ... 1
Problems with Current Methods of Neuropsychological Screening ... 1
Sensory Perceptual Metrics ... 3
Somatosensory System ... 4
CHAPTER 2. METHODS ... 6
Device ... 6
Experimental Session ... 7
Neurosensory Assessments ... 9
Tracking Algorithm ... 15
Data Analysis ... 15
CHAPTER 3. CLINICAL APPLICATIONS ... 20
Section 3.1. Migraines ... 21
Background ... 21
Methods ... 24
Results ... 26
Discussion ... 29
Section 3.2. Alcoholism ... 32
Background ... 32
Methods ... 33
Results ... 36
Discussion ... 41
Section 3.3. Concussion ... 45
Background ... 45
Methods ... 47
Results ... 49
CHAPTER 4. DISCUSSION ... 55
Summary ... 55
Machine Learning Algorithms for Classification ... 57
Limitations ... 61
Future Directions ... 63
Dual-Site Protocols ... 63
Quad-Site Protocols ... 66
Bilateral Protocols ... 69
Conclusions ... 77
APPENDIX: ADDITIONAL PROTOCOLS ... 80
Temporal Order Judgment ... 80
Duration Discrimination ... 83
LIST OF TABLES
Table 2.1. Summary of Control Metrics for Young Adults. ... 19
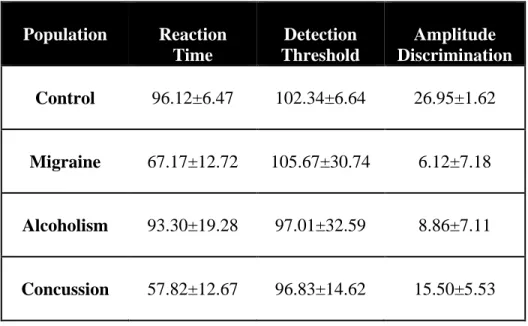
Table 4.1. Comparison of Metrics in Control and Clinical Populations. ... 56
Table 4.2. Summary of Additional Sensory Perceptual Metrics. ... 64
LIST OF FIGURES
Figure 2.1. Cortical Metrics Vibrotactile Stimulator. ... 7
Figure 2.2. Schematic Diagrams of Experimental Protocols. ... 14
Figure 2.3. Tracking Algorithm for Amplitude Discrimination. ... 16
Figure 2.4. Summary of Control Metrics by Age. ... 18
Figure 3.1. Sensory Perceptual Metrics of Episodic Migraineurs versus Controls. ... 27
Figure 3.2. Amplitude Discrimination Thresholds across Other Pain Conditions. ... 28
Figure 3.3. Sensory Perceptual Metrics over Alcohol Consumption. ... 38
Figure 3.4. Additional Metrics Comparing Alcohol Consumption and Adaptation. ... 40
Figure 3.5. Principal Component Analysis for Concussed Athletes versus Controls. ... 50
Figure 3.6. Sensory Perceptual Metrics and SCAT Scores Recover over Time. ... 52
Figure 4.1. k-Nearest Neighbors Analysis for Classification. ... 58
Figure 4.2. Support Vector Machine Analysis for Classification. ... 60
Figure 4.3. Principal Component Analysis with Additional Metrics for Concussed Athletes. .... 65
Figure 4.4. Quad-Site Stimulation on Spatial Localization and Amplitude Discrimination. ... 68
Figure 4.5. Contralateral Stimulation on Amplitude Discrimination. ... 76
Figure 4.6. Classes of Protocols and Clinical Populations Assessed. ... 79
LIST OF ABBREVIATIONS
2AFC Two-Alternative Forced-Choice Tracking Algorithm
AD Amplitude Discrimination (ADs: simple; ADssa: single-site adaptation)
AMPA α-amino-3-hydroxy-5-methyl-4-isoxazolepropionic acid
ASAP Alcohol and Substance Abuse Program, Chapel Hill, North Carolina
AUDIT Alcohol Use Disorders Identification Test
BES Gormally Binge Eating Scale
CANTAB Cambridge Neuropsychological Test Automated Battery
CATI Computer-Assisted Telephone Interview
CM Cortical Metrics
CNS Central Nervous System
CSD Cortical Spreading Depression
CT Computed Tomography
D# Digit Number (D2=index, D3=middle, D4=ring, D5=little)
DT Detection Threshold (DTs: static, DTd: dynamic)
DRC Dental Research Center
DPM Drinks per Month
DSM-V Diagnostic and Statistical Manual of Mental Disorders
EEG Electroencephalography
GABA γ-aminobutyric acid
Hx Previous History
IBS Irritable Bowel Syndrome
ICDH-2 International Classification of Headache Disorders
ITI Inter-trial Interval
k-NN k-Nearest Neighbors Algorithm
MEG Magnetic Encephalography
MMSE Mini Mental State Examination
MRCP Motor-Related Cortical Rotentials
mTBI Mild Traumatic Brain Injury
NIAAA National Institute on Alcohol Abuse and Alcoholism
NMDA N-methyl-D-aspartate
NS Novelty Seeking
PCA Principal Component Analysis
PET Positron Emission Topography
PM&R Physical Medicine and Rehabilitation
PNS Peripheral Nervous System
RAPI Rutgers Alcohol Problem Index
RI Response Interval
RT Reaction Time (RTs: simple, RTc: choice)
S# Somatosensory Cortex (S1=primary, S2=secondary)
SCAT Standardized Concussion Assessment Tool
S/T Standard/Test Amplitudes
SVM Support Vector Machine
TLFB Timeline Followback
TMD Temporomandibular Disorder
TMS Transcranial Magnetic Stimulation
TPQ Tridimensional Personality Questionnaire
UNC-CH University of North Carolina at Chapel Hill
VAS Visual Analog Scale
VVS Vulvar Vestibulitis Syndrome
WAIS Wechsler Adult Intelligence Scale
CHAPTER 1. INTRODUCTION
Problems with Current Methods of Neuropsychological Screening
The primary purpose of conducting neurological diagnostic tests and screening
assessments is to understand brain functionality and to reveal information about the structural
integrity of the brain. Various advanced screening methods have been developed and clinically
implemented over the years to analyze cognitive function, but several problems exist in the
current approaches. Two common types of minimally-invasive neurological screening methods,
namely a variety of neuropsychological assessments and imaging techniques, are briefly
reviewed for their efficacy and limitations, and the quantitative method used throughout this
research is subsequently introduced as either an alternative or complement to these existing
methods of evaluation (Neurological Diagnostic Tests and Procedures., 2005).
Full neuropsychological evaluations consist of a series of lengthy assessments which can
potentially reveal information about various cognitive processes including intelligence, attention,
learning and memory, executive function, personality traits, speed of sensory and motor
processing, among other significant functional domains. Common diagnostic measures might
include identifying signs and/or symptoms within the Diagnostic and Statistical Manual of
Mental Disorders (DSM-V) or implementing batteries of neurological tests such as the
Cambridge Neuropsychological Test Automated Battery (CANTAB), the Mini Mental State
Examination (MMSE), the Wechsler Adult Intelligence Scale (WAIS), and the Halstead-Reitan
functional impairment in the absence of imaging biomarkers (Harvey, 2012), evaluations can last
for several hours with many assessments being subjective with self-reporting of symptoms and
estimated recollection of notable incidences of neurological dysfunction.
The use of various imaging modalities, while providing a useful, more quantitative
method of analyzing the structural integrity and functional correlates of the brain, are costly,
require a significant amount of time for data acquisition and analytical processing, and are
limited in accessibility. Common imaging modalities include computed tomography (CT),
positron emission topography (PET), electroencephalography (EEG), magnetic encephalography
(MEG), and functional magnetic resonance imaging (fMRI) among others. Although each of the
imaging techniques can reveal particular systemic or regional aspects associated with brain
functionality, single modalities alone may be incapable of comprehensively analyzing the
complex nature of certain types of neurological dysfunction in various clinical populations
(Shenton, et al., 2012).
In order to overcome the limitations of current diagnostic tests and screening methods, a
portable and non-invasive system was developed to analyze particular features of central
information processing and to rapidly conduct quantitative sensory testing in a variety of clinical
populations. A four-site mechanical stimulator was designed to optimally deliver non-painful
vibrotactile stimuli to the fingertips and has been utilized to assess a number of neurosensory
information processing characteristics in various subject populations. The protocols developed
for testing are unique in that they have demonstrated significant sensitivity to detecting
In the following chapters, the rationale for the somatosensory testing is described and
current literature claims are briefly summarized. Next, the experimental methods utilized for
testing and data analysis are explained, and establishment of objective standards for healthy
controls are defined. Finally, differences among measures are highlighted within three different
clinical populations, and, after understanding their etiologies, the results are subsequently used to
draw conclusions about various features of central information processing.
Sensory Perceptual Metrics
Quantitative sensory testing has been shown to be an effective, non-invasive, non-painful,
alternative approach to measuring and analyzing brain functionality (Chong & Cros, 2004). In
particular, the neurobiological dynamics involved in central information processing have been
thoroughly investigated through the implementation of vibrotactile psychophysics and
subsequent analysis and comparison of sensory perceptual metrics. This type of testing has been
utilized to explore somatosensory pathways, target neurobiological processes, detect
neuropathies, and associate cortical functionality with measurable aspects of behavior (Gandhi,
Sesek, Tuckett, & Bamberg, 2011). Because the relationship between cortical mechanisms and
sensory perception is particularly relevant with respect to clinical populations in which central
information processing is impaired, the feasibility of implementing a battery of tests to evaluate
various clinical populations is further explored in order to understand the particular neurological
mechanisms involved in their etiologies (Puts, Edden, Wodka, Mostofsky, & Tommerdahl,
Somatosensory System
Somatosensation is an ideal sensory modality to analyze for neurological screening
assessments of central information processing because the system is somatotopically organized,
stimulation results in a high signal-to-noise ratio, and the system is uniquely integrated with pain
pathways. The somatotopic organization allows for observations of cortico-cortical interactions
among adjacent and/or near-adjacent cortical regions. Furthermore, ambivalent environmental
noise can be easily controlled. Finally, the somatosensory system is highly integrated with pain
processing, which is often an important aspect of clinical diagnosis. A key concept in this model
is that changes in sensory perception occur in parallel with systemic cortical alterations, and
sensory perceptual metrics can allow for a non-invasive, functional biopsy of the cerebral cortex.
These benefits, among others, are advantageous in understanding timing as well as spatial
representations of sensory perception.
The somatosensory system, like most sensory systems, primarily consists of two
components: sensory receptors in the peripheral nervous system (PNS) and somatotopic
representations of these receptors in the cerebral cortex of the central nervous system (CNS).
While the presence and density of each type of receptor varies according to the specific location
of the body, a high density of tactile mechanoreceptors are localized in the digits due to their
involvement with manual interactions. Tactile cutaneous mechanoreceptors can detect and
transmit sensations of touch, pressure, and vibration through slowly-adapting (SA) receptors
(Merkel discs and Ruffini endings) and rapidly-adapting (RA) receptors (Meissner’s and
projection fibers through the thalamus to the primary somatosensory cortex (S1), specifically to
areas 1 and 3b, where the signal is processed into a percept (Abraira & Ginty, 2013; Roudaut, et
al., 2012). Because the fingers contain a large density of mechanoreceptors, the digit tips were
appropriately chosen for analysis of adjacent and/or near-adjacent cortical information
processing.
Somatosensory studies have progressed from implementing single-site stimulation in
analyzing the effects of specific types of stimulation on cortical responses to utilizing dual-site
stimulation to characterize the discriminative abilities among adjacent and/or near-adjacent
spatial regions. The nature of the stimuli, being punctate or vibrotactile, as well as the
combination of the digits being tested, have been shown to significantly affect the outcome of the
resulting percept (Chiu, Tommerdahl, Whitsel, & Favorov, 2005; Favorov, Hester, Lao, &
Tommerdahl, 2002; Friedman, Chen, & Roe, 2008). Results from animal studies have been
compared with human experiments to form more accurate characterizations of the
neurobiological mechanisms underlying somatosensory information processing (LaMotte &
Mountcastle, 1975; Mountcastle, LaMotte, & Carli, 1972; Mountcastle, Talbot, Sakata, &
Hyvärinen, 1969; Talbot, Darian-Smith, Kornhuber, & Mountcastle, 1968). While the animal
studies have allowed the cortical mechanisms to be analyzed through electrophysiological and/or
imaging techniques, the human studies have been capable of confirming these findings through
CHAPTER 2. METHODS
Device
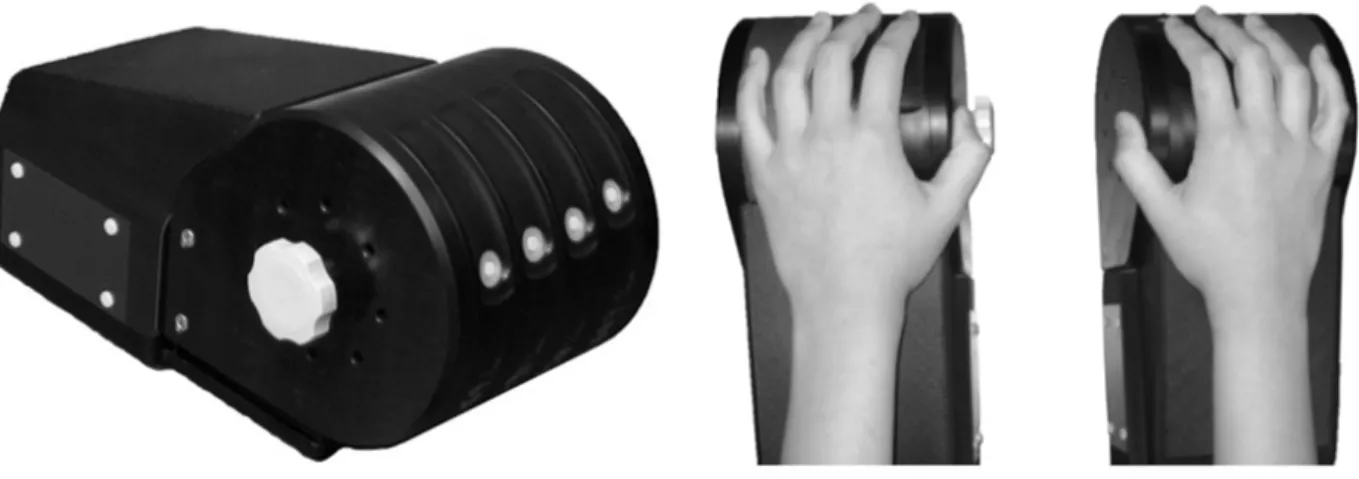
A portable, non-invasive, four-site mechanical stimulator (Cortical Metrics, CM-5),
designed and fabricated to optimally deliver non-painful vibrotactile stimuli to the fingertips,
was implemented in the following studies (Figure 2.1.). The independent, computer-controlled
probe tips were able to deliver a wide range of vibrotactile stimulation of varying amplitudes
(sinusoidal peak-to-peak displacements in μm), durations (ms), and frequencies (Hz). A number
of protocols were developed to assess particular features of information processing in various
populations (Holden, et al., 2012; Puts, Edden, Wodka, Mostofsky, & Tommerdahl, 2013;
Tannan, Dennis, & Tommerdahl, 2005; Tannan, Dennis, Zhang, & Tommerdahl, 2007; Zhang,
Tannan, Holden, Dennis, & Tommerdahl, 2008). These groups range from typically-developing
individuals (Zhang, Francisco, Holden, Dennis, & Tommerdahl, 2011) to subjects with autism
spectrum disorders (Tannan, Holden, Zhang, Baranek, & Tommerdahl, 2008; Tommerdahl,
Tannan, Cascio, Baranek, & Whitsel, 2007; Tommerdahl, Tannan, Holden, & Baranek, 2008;
Puts, Edden, Wodka, Mostofsky, & Tommerdahl, 2013) to patients with chronic pain conditions
(Nebel, et al., 2010; Zhang, et al., 2011) as well as those with other neurological dysfunctions
systemic mechanistic changes which occur within and among cortical regions. The uniqueness of
each of the protocols has thus far demonstrated significant sensitivity to alterations in central
information processing.
Figure 2.1. Cortical Metrics Vibrotactile Stimulator.
Experimental Session
Following International Review Board approval and informed consent, over 200 subjects
ranging from 18 to 70 years of age were recruited from the University of North Carolina at
Chapel Hill (UNC-CH) to participate in the study. All subjects completed a survey on current
medications and medical history prior to the experimental tests to exclude participants with any
history of neurological impairment. The subjects were naïve to the study design and blinded to
the issue under investigation.
During the experimental session, subjects were seated comfortably in a chair with the test
(left) arm situated on an armrest attached to the head unit of the four-site vibrotactile stimulator.
In these studies, vibrotactile flutter stimulation (25 Hz) were delivered via 5 mm Delrin probes
of the test hand. These digits were chosen as the test sites not only for convenience and comfort
but also because of the wealth of neurophysiological data which supports the evaluation of these
somatotopic regions in the non-human primate cerebral cortex (Chiu, Tommerdahl, Whitsel, &
Favorov, 2005; Favorov, Hester, Lao, & Tommerdahl, 2002; Friedman, Chen, & Roe, 2008). A
semi-automated procedure guided subjects through a series of assessments relating to the
perception of the mechanical stimuli delivered (see Neurosensory Assessments). The right hand
was placed on a two-button response device, and, throughout testing, subjects were instructed to
press the left or right button when the correct response was perceived on the middle (D3) or
index (D2) finger, respectively.
Visual cueing was provided through a computer monitor during each of the experimental
runs. The cues indicated when the experimental stimuli were being delivered and when subjects
were to respond. Training trials conducted prior to each task familiarized subjects with the tests,
and correct responses on three consecutive training trials were required prior to the start of each
assessment. For some tests, subjects were provided with performance feedback during data
acquisition. Certain protocols implemented a two-alternative forced-choice (2AFC) paradigm to
determine sensory perceptual thresholds (see Tracking Algorithm).
Sensory perceptual metrics were easily and rapidly obtained for each subject (1 to 3
minutes per test), and the battery of tests consisted of three classes of protocols: reaction times
(RT), vibrotactile detection thresholds (DT), and amplitude discrimination thresholds (AD) (see
Neurosensory Assessments). The battery, from start to finish, lasted between 10 and 20 minutes
Neurosensory Assessments
Reaction Times: Simple and Choice
The reaction time tasks required subjects to quickly and accurately respond to a tap
(Figure 2.2.A.). Previous studies indicate that reaction times are correlated with white matter
integrity (Kerchner, et al., 2012; Tamnes, Fjell, Westlye, Ostby, & Walhovd, 2012),
sensorimotor integration, and attentional aspects in addition to other neurological mechanisms
(Puts, Edden, Wodka, Mostofsky, & Tommerdahl, 2013).
For the simple reaction time (RTs) task, a single tap (300 μm amplitude, 40 ms duration)
was delivered to one digit. Subjects were subsequently instructed to quickly click the response
device as soon as the tap was perceived.
For the choice reaction time (RTc) task, the single tap was delivered to one of two digits
(D2 or D3), the location of which was randomly selected on a trial-by-trial basis. Subjects were
subsequently instructed to quickly click the left or right side of the response device
corresponding to the stimulated digit as soon as the tap was perceived.
A randomized delay ranging from 2 to 7 seconds occurred between each of the 20 trials.
Response times and accuracies were recorded for each of the trials, and the mean reaction times
were determined by excluding the two slowest and two quickest reaction times and averaging the
remaining 16 reaction times.
Detection Thresholds: Static and Dynamic
The detection threshold tasks required subjects to respond to a vibrotactile stimulus by
accurately identify the locus of stimulation (Figure 2.2.B.). Previous studies indicate that
mechanisms presumed to occur in somatosensory cortical input layer IV (Favorov & Kurson,
2011; Gabernet, Jadhav, Feldman, Carandini, & Scanziani, 2005) in addition to others (Puts,
Edden, Wodka, Mostofsky, & Tommerdahl, 2013). Two types of detection thresholds were
determined and have been previously defined as static and dynamic thresholds (Zhang,
Francisco, Holden, Dennis, & Tommerdahl, 2011). Static thresholds (DTs) were those obtained
using suprathreshold stimuli which were constant in amplitude during an individual trial (the
minimum detectable constant-amplitude stimulus) while dynamic thresholds (DTd) were those
obtained using subthreshold stimuli in which the amplitude was modulated at a defined rate
during an individual trial (the minimum detectable increasing-amplitude stimulus).
The feed-forward inhibitory mechanisms for the dynamic threshold task may occur as the
initial subthreshold stimulus gradually increases in amplitude the detectable level. Inhibitory
neurons are thought to respond more to subthreshold afferent thalamocortical drive than
excitatory neurons effectively sharpening receptive field properties through excitatory
suppression and consequently raising the threshold at which excitatory neurons begin to respond
to peripheral stimuli (Favorov & Kurson, 2011).
For the static detection threshold (DTs) task, a vibrotactile stimulus (initial parameters:
15 μm amplitude, 500 ms duration, 25 Hz flutter frequency) was delivered to one of the two
digits (D2 or D3). Following each stimulus, subjects were prompted to select the digit on which
they perceived a weak stimulus. Thresholds were determined over 20 trials using a
two-alternative forced-choice (2AFC) tracking algorithm (see Tracking Algorithm).
stimulus increased at a rate of 2 μm/s, and subjects were instructed to select the digit on which
they first perceived the stimulus. The dynamic threshold task consisted of 7 trials (two trials with
no delay), and the stimulus amplitude at the time of the response was recorded.
A fixed inter-trial interval (ITI) of 5 s occurred between each of the trials, and the
stimulus location was randomly selected on a trial-by-trial basis. Detection thresholds were
recorded for each of the trials, and the mean static thresholds were determined by averaging the
last 5 test amplitudes recorded. The mean dynamic thresholds were determined by averaging the
test amplitudes recorded across all trials.
Amplitude Discrimination Thresholds: without and with Adaptation
The amplitude discrimination tasks required subjects to accurately identify one of two
digits (D2 or D3) which received the larger of two simultaneously-delivered vibrotactile stimuli
(Figure 2.2.C.). Amplitude discriminative capacity was defined as the minimal, or
just-noticeable, difference in amplitudes of two mechanical sinusoidal vibratory stimuli in which an
individual was able to successfully identify the stimulus of larger magnitude. Previous studies
indicated that amplitude discrimination thresholds are correlated with lateral inhibitory
mechanisms (Tannan, Dennis, & Tommerdahl, 2005), that they follow Weber’s Law (Francisco,
Tannan, Zhang, Holden, & Tommerdahl, 2008), and that pre-exposure to relatively brief periods
of single-site conditioning stimulation significantly elevates discriminative thresholds (Tannan,
Simons, Dennis, & Tommerdahl, 2007; Tannan, Whitsel, & Tommerdahl, 2006).
Sensory adaptation is an important fundamental neural mechanism involved in central
information processing (Hollins, Goble, Whitsel, & Tommerdahl, 1989; Tannan, Simons,
ability to adapt to conditioning stimulation is suspected to be associated with disruption in the
balance of excitation and inhibition (Heiss, Katz, Ganmor, & Lampl, 2008; Higley & Contreras,
2006), which can lead to inefficient neural coding (Reinagel, 2001). Neurophysiological studies
have demonstrated that repetitive stimulation results in temporal changes in cortical activity, the
most prominent of which is a reduction in cortical response with extended stimulus duration. At
the single-cell level, somatosensory cortical pyramidal neurons have been shown to undergo
prominent stimulus-dependent modifications of their receptive fields and their response
properties with repetitive stimulation. These alterations can develop within milliseconds of
stimulus onset and can diminish within seconds following stimulus termination (Kohn &
Whitsel, Sensory cortical dynamics., 2002; Tommerdahl, et al., 1996; Tommerdahl, Delemos,
Favorov, Metz, & Whitsel, 1998; Tommerdahl M. , Simons, Chiu, Favorov, & Whitsel, 2005;
Tommerdahl M. , et al., 2005). At the neuronal population level, optical imaging studies have
also characterized the short-term dynamics of the primary somatosensory (S1) cortical response
using various amplitudes and durations of vibrotactile stimulation (Chiu, Tommerdahl, Whitsel,
& Favorov, 2005; Simons, et al., 2005; Simons, Chiu, Favorov, Whitsel, & Tommerdahl, 2007).
Previous studies led to the hypothesis that centrally-mediated adaptation is dependent on several
factors including, but not limited to, the balance between inhibitory γ-aminobutyric acid (GABA)
and excitatory N-methyl-D-aspartate (NMDA) receptor-mediated neurotransmission in addition
to neuron-glial interactions. Reduced adaptation in a number of clinical populations have
suggested imbalance in these mechanisms (Tannan, Holden, Zhang, Baranek, & Tommerdahl,
NMDA receptor antagonist, can also suppress the effects of sensory adaptation (Folger, Tannan,
Zhang, Holden, & Tommerdahl, 2008).
For the simple amplitude discrimination (ADs) task, the device delivered simultaneous
stimuli (initial stimulus parameters: 400 μm test, 200 μm standard, 25 Hz, 500 ms, 20 μm step
size) to D2 and D3 over 20 trials. Thresholds were determined over 20 trials using a
two-alternative forced-choice (2AFC) tracking algorithm (see Tracking Algorithm), and test
amplitudes were recorded for all trials.
For the amplitude discrimination task in the presence of single-site adaptation (ADssa),
the device delivered a vibrotactile conditioning stimulus (constant stimulus parameter: initial test
amplitude in μm, 25 Hz, 1000 ms) one second prior to the delivery of the paired test and standard
stimuli. The result of such a protocol modification is that the discriminative threshold, or
difference limen (DL), is typically significantly elevated following pre-exposure to a single-site
conditioning stimulation compared to the simple amplitude discrimination threshold (Tannan,
Simons, Dennis, & Tommerdahl, 2007; Tannan, Whitsel, & Tommerdahl, 2006). Thresholds
were determined over 20 trials using a two-alternative forced-choice (2AFC) tracking algorithm
(see Tracking Algorithm), and test amplitudes were recorded for all trials.
A fixed inter-trial interval (ITI) of 5 s occurred between each of the trials, and the loci of
the test and standard stimuli were randomly selected on a trial-by-trial basis. The magnitude of
the test stimulus was always greater than that of the standard stimulus. The mean thresholds were
determined by averaging the last 5 test amplitudes recorded in each task. The standard amplitude
was subtracted from the mean thresholds to obtain difference limens (DL), and these DLs were
then divided by the standard to obtain the Weber fraction (WF) for comparison across different
stimulus, the gain effect of adaptation, or the reduction of the perceived intensity of the stimulus,
can be quantified by comparing thresholds obtained in absence and in the presence of single-site
Tracking Algorithm
Thresholds (DTs, ADs, and ADssa) for each subject were obtained via a two-alternative
forced-choice (2AFC) modified Georg von Békésy tracking algorithm (Green & Swets, 1966)
(Figure 2.3.). Based on previous responses of the subjects, test stimulus amplitudes were
modified until the completion of the protocols. During the first 10 trials, a 1-up/1-down
algorithm was implemented for the purposes of rapid amplitude modification. Correct responses
resulted in the lowering of the magnitude of the test stimulus while incorrect responses raised the
amplitude of the test stimulus. In the remaining 10 trials, the amplitude was varied using a
2-up/1-down algorithm whereby two incorrect responses were required to raise the amplitude of
the test stimulus. The rationale for implementing these algorithms was to initially expedite
determination of vibrotactile discriminative range (Tannan, Dennis, Zhang, & Tommerdahl,
2007).
Data Analysis
Reaction times, detection thresholds, and Weber fractions were calculated for each
subject, and metrics were averaged across each population by age. In order to normalize the
results by each subject and analyze the effect of the secondary metric based on the primary
metric (the effect of choice on reaction time, the effect of feed-forward inhibition on detection
thresholds, and the effect of single-site adaptation on amplitude discrimination), the ratios of the
metrics were also calculated. These calculations were arbitrarily converted to percentages where
larger values implied that the secondary metric significantly affected performance compared to
Two-sample, one-tailed t-tests, were used to evaluate the difference in the performance of
healthy control metrics on primary and secondary metrics across the age spectrum. The data are
presented as means and standard errors of the means. A probability (p-value) of less than 0.05
was considered statistically significant.
Summary of Control Metrics
Control data from previous studies were analyzed to provide a foundation with which to
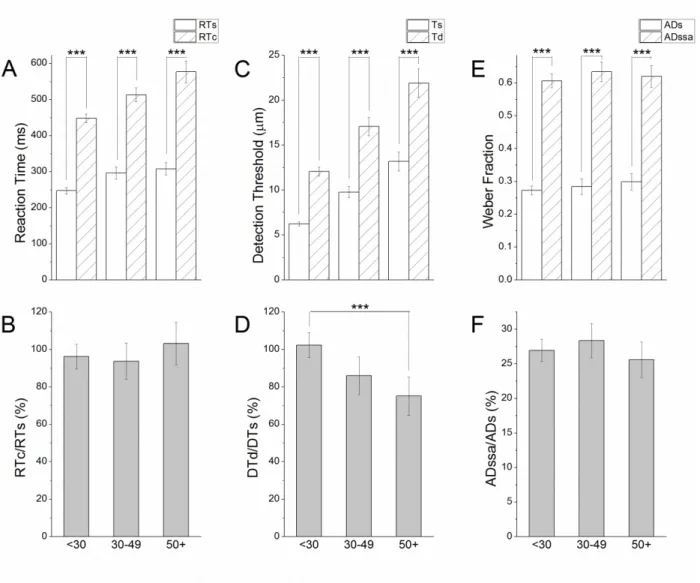
compare metrics obtained from clinical populations. The majority of subjects performed worse
on secondary metrics than on primary metrics (RTc>RTs=92.73 %, DTd>DTs=93.33 %, and
ADssa>ADs=76.22 %) across all classes of protocols (Table 2.1., Figure 2.3., ***p<<0.01).
With increasing age, reaction times became significantly slower (Figure 2.3.A.) and detection
thresholds became significantly higher (Figure 2.3.C.) while there was little effect of age on
amplitude discrimination thresholds (Figure 2.3.E.). Furthermore, the ratio of the secondary
metric to the primary metric was reduced with increasing age only for the detection threshold
task suggesting progressive impairment in feed-forward inhibitory mechanisms (Figure 2.3.D.,
***p=0.0006) while there was no significant change in the reaction time (Figure 2.3.B.) or
amplitude discrimination tasks (Figure 2.3.F.) over increasing age. The results of the analysis
were in accordance with previously-published data exploring the effect of age on sensory
perceptual metrics (Zhang, Francisco, Holden, Dennis, & Tommerdahl, 2011).
These sensory perceptual metrics can be useful in assessing brain dysfunction as a
database has been developed in order to establish standard cutoff thresholds for healthy
performance. These data can be age-matched and compared to patient populations in order to
evaluate brain functionality under the rationale that these populations undergo systemic
alterations and plastic changes in central information processing. Understanding the average
control values can reveal insight into defining healthy and unhealthy information processing. In
order to avoid effects of age on the sensory perceptual metrics, the clinical applications focused
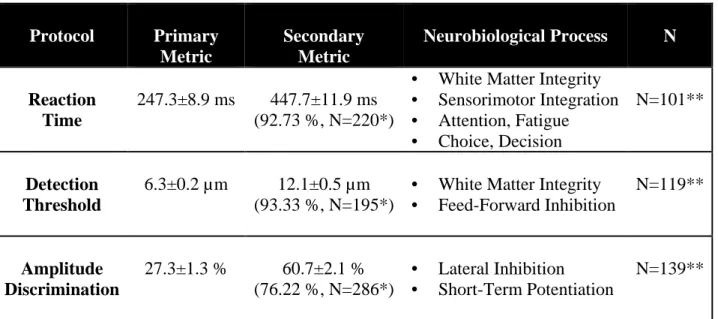
Table 2.1. Summary of Control Metrics for Young Adults.
Protocol Primary
Metric
Secondary Metric
Neurobiological Process N
Reaction Time
247.3±8.9 ms 447.7±11.9 ms (92.73 %, N=220*)
• White Matter Integrity • Sensorimotor Integration • Attention, Fatigue • Choice, Decision
N=101**
Detection Threshold
6.3±0.2 µm 12.1±0.5 µm (93.33 %, N=195*)
• White Matter Integrity • Feed-Forward Inhibition
N=119**
Amplitude Discrimination
27.3±1.3 % 60.7±2.1 % (76.22 %, N=286*)
• Lateral Inhibition • Short-Term Potentiation
N=139**
CHAPTER 3. CLINICAL APPLICATIONS
Sensory perceptual metrics were assessed in young adults (ages 18 to 29 years) in three
different clinical populations—migraines, alcoholism, and concussion—to analyze if particular
measures were uniquely sensitive to changes in central information processing. Results from
Section 3.1 and Section 3.2 were adapted from published work (Nguyen, et al., 2013a; Nguyen,
et al., 2013b). The migraine population was analyzed as an extension of previous research
regarding the effect of chronic pain conditions on these metrics (Nebel, et al., 2010; Zhang, et al.,
2011). The effect of alcohol consumption on these metrics was also analyzed due to previous
research supporting particular neurobiological mechanisms involved in modulating vibrotactile
adaptation (Folger, Tannan, Zhang, Holden, & Tommerdahl, 2008). Lastly, the impact of
mechanical injury on these metrics was assessed in order to determine if recovery could be
tracked over time following concussions. The results are expected to show that, throughout these
populations, systemic and focal effects on central information processing through endogenous
neurological imbalance, chronic drug exposure, and mechanical injury, respectively, account for
significant alterations in sensory perceptual metrics. Differences among these metrics are
Section 3.1. Migraines
Background
Pain perception is a unique sensory experience involving complex associations among
sensory stimuli and neuropsychological factors such as cognition and emotion. Peripheral
nociceptors in the form of free nerve endings detect and transmit two forms of pain: sharp and
aching. While sharp pain is quickly transmitted via Aδ fibers (5-30 m/s), aching pain is
processed more slowly via C fibers (0.5-2 m/s) (Abraira & Ginty, 2013). These pain signals
propagate through spinothalamic tracts where they are somatotopically processed in the primary
(S1) and/or secondary (S2) somatosensory cortices (Omori, et al., 2013). Because pain
perception can be modulated through central mechanisms, objective approaches to quantifying
pain have been extensively studied in order to understand the neurobiological and psychological
influences involved in the experience (Cruz-Almeida & Fillingim, 2014).
The presence of pain can affect the perception of non-painful somatosensory stimuli
through touch gating, a phenomenon involving sensory interactions rather than resulting from
attentional distraction (Apkarian, Stea, & Bolanowski, 1994; Harper & Hollins, 2012). In some
instances, pain sensitivity can increase due to temporal summation, an NMDA
receptor-dependent wind-up mechanism that occurs resulting from repetitive, frequency- and
intensity-dependent stimulation over time (Herrero, Laird, & Lopez-Garcia, 2000). This mechanism may
be responsible for hyperalgesia, where normally painful stimuli are perceived as increasingly
painful, or allodynia where non-painful stimuli are perceived as painful (Sandkuhler, 2009).
Chronic pain conditions may induce sensitization through cortical reorganization and/or
descending modulations resulting in altered sensory thresholds and/or pain tolerances (Gustin, et
Many chronic pain conditions are poorly understood, have few quantifiable biological
markers for screening, and can involve a variety of differential or comorbid diagnoses inclusive
of, but not limited to, migraines, fibromyalgia (FM), irritable bowel syndrome (IBS), temporal
mandibular disorder (TMD), and vulvar vestibulitis syndrome (VVS) among others. Evaluations
are primarily dependent on subjective reports of pain and subsequent impact on mood and/or
function, all of which are difficult to objectively standardize among clinical populations. This
dependence on subjectivity begins from diagnosis and continues throughout evaluation of
treatment efficacy in order to determine the severity of impairment or disability. These
qualitative reports may be biased by various factors that are unrelated to symptoms resulting in
patients who might catastrophize symptoms due to anxiety, depression, or other issues related to
secondary pain (Quartana, Campbell, & Edwards, 2009). Thus, there is a compelling need for a
more objective measure of pain that can track deteriorations or improvements in, and/or
chronification of, chronic pain symptoms over time.
In the case of primary headache disorders such as migraines, few objective tests are
available to assess the burden of illness or track progression over time. This may be due to the
fact that the causes of migraines are still poorly understood. The etiology of migraines is
presumed to involve triggers such as cortical spreading depression, trigeminovascular activation,
and/or sensitization mechanisms (Eikermann-Haerter & Ayata, 2010; Kojic & Stojanovic, 2013).
More specifically, trigeminal activation is thought to trigger neuropeptide release subsequently
leading to meningeal vasodilation and neuroinflammation. Signals are then transmitted through
(topiramate, divalproex) or modulation of trigeminovascular activation (propanalol, timolol, and
onabotulinumtoxin A).
Sensory assessments of migraines have been previously explored with the rationale that
many patients are particularly vulnerable to sensory stimuli such as light (photophobia), noise
(phonophobia), and even odors (osmophobia) during attacks (Ambrosini & Schoenen, 2006).
These alterations are supported by the observation of abnormal response patterns in the primary
sensory cortices in relation to neuronal excitability and habituation mechanisms in subjects with
migraine (Ambrosini & Schoenen, 2006; Coppola & Schoenen, 2012; Coppola, Pierelli, &
Schoenen, 2009; Schoenen, 1996). The evaluations revealed altered sensory thresholds for
certain forms of non-painful and painful somatosensory stimuli (Karanovic, Thabet, Wilson, &
Wilkinson, 2011; Ladda, Straube, Förderreuther, Krause, & Eggert, 2006; Schwedt, Krauss,
Frey, & Gereau IV, 2011; Zappaterra, Guerzoni, Cainazzo, Ferrari, & Pini, 2011). Based on
previous research, alterations in central information processing due to migraines are expected to
be reflected in sensory perceptual metrics, which have been demonstrated to be sensitive to
evaluating chronic pain conditions (Nebel, et al., 2010; Zhang, et al., 2011), neurodegenerative
conditions (Nelson, et al., 2012) and developmental conditions such as autism (Tannan, Holden,
Zhang, Baranek, & Tommerdahl, 2008).
A battery of tests (see Neurosensory Assessments) was administered to young adults
screened as healthy controls as well as those screened to have symptoms of episodic migraines
(EM). These sensory perceptual metrics provided quantitative indices of brain function which
were presumed to be associated with chronic pain conditions. In particular, discriminative
sensory metrics for episodic migraineurs in the presence of conditioning stimulation were
cortical spreading depression resulting in cortical hyper-excitability (Coppola & Schoenen,
2012), impairment of habituation mechanisms (Ambrosini & Schoenen, 2006; Coppola, Pierelli,
& Schoenen, 2009; Schoenen, 1996), and/or sensitization (Nebel, et al., 2010; Zhang, et al.,
2011). The results of this study demonstrated that certain metrics of central information
processing were significantly altered in young adult episodic migraineurs. The long-term
objective of the study was to develop methods that can improve diagnosis and can enable more
accurate assessments of treatment efficacy for migraineurs. Such quantitative metrics could
significantly improve the analysis of underlying mechanisms as these objective measures could
be used for quantitatively assessing impact of treatment on patient-centered studies. Furthermore,
this method of non-painful quantitative sensory testing allows analysis of metrics that cannot be
gained by pain testing and that may serve as an alternative biomarker for pain processes.
Methods
Subjects
Following International Review Board approval and informed consent, 43 subjects
ranging from 18 to 29 years of age were recruited from the Dental Research Center (DRC) at the
University of North Carolina at Chapel Hill (UNC-CH) to participate in the study. These subjects
included healthy controls (n=30) and episodic migraineurs (EM, n=13). All subjects completed a
survey on current medications and medical history prior to the experimental tests to exclude
Screening Assessments
Subjects were screened via Computer-Assisted Telephone Interviews (CATI) resulting in
a subset of the episodic migraineurs (n=7) being categorized with one or more comorbidities
including FM, IBS, TMD, and/or VVS.
Neurosensory Assessments
Six sensory perceptual metrics were analyzed. The reaction times (RTs and RTc) and
detection thresholds (DTs and DTd) were determined according to standard protocol parameters
(see Neurosensory Assessments). The amplitude discrimination task was performed in the
absence (ADs) and presence (ADssa) of single-site adaptation with standard amplitude of 400
µm and initial test amplitude of 800 µm.
Data Analysis
Two-sample, one-tailed t-tests, were used to evaluate the difference in the performance of
the episodic migraine population as compared to control metrics. The data are presented as
means and standard errors of the means. A probability (p-value) of less than 0.05 was considered
Results
Reaction times and detection thresholds in episodic migraineurs were similar to those in
controls.
The mean simple reaction times were significantly quicker than choice reaction times for
both the episodic migraineurs (361.2±36.7 ms versus 566.1±43.9 ms, ***p=0.0002, n=13, Figure
3.1.A) and for the controls (314.0±16.8 ms versus 536.0±25.1 ms, ***p<<0.01, n=30, Figure
3.1.A). Furthermore, both the simple and choice reaction times (p=0.13 and p=0.28,
respectively), as well as the effect of choice on reaction times (85.5±13.5 % for controls versus
67.2±12.7 % for migraineurs, p=0.17, Figure 3.1.B) were similar across both populations.
The mean static detection thresholds were significantly lower than dynamic detection
thresholds for both the episodic migraineurs (6.7±1.2 µm versus 10.7±0.8 µm, *p=0.02, Figure
3.1.C) and for the controls (5.8±0.3 µm versus 10.1±0.5 µm, ***p<<0.01, Figure 3.1.C).
Furthermore, both the static and dynamic detection thresholds (p=0.23 and p=0.29, respectively),
as well as the effect of feed-forward inhibition on detection thresholds (86.1±11.0 % for controls
versus 105.7±30.7 % for migraineurs, p=0.28, Figure 3.1.D) were similar across both
populations.
The effect of adaptation on amplitude discrimination was reduced for episodic migraineurs
as compared to that in controls.
adaptation conditions for amplitude discrimination (p=0.47) were similar across both populations
(Figure 3.1.E). Additionally, while the mean effect of adaptation on amplitude discrimination
was lower in episodic migraineurs versus controls, this effect was not statistically significant
(16.5±4.0 % for controls vs 6.1±7.2 % for migraineurs, p=0.11, Figure 3.1.F).
Amplitude discrimination thresholds varied across other pain conditions.
Amplitude discrimination difference limens in the absence and presence of single-site
adaptation were compared among healthy controls (n=80) and chronic pain subjects regardless of
age (EM, n=47; FM, n=23; IBS, n=44; TMD, n=19; VVS, n=15) (Figure 3.2.). While subjects
with FM and IBS responded to conditioning stimulation, subjects with EM, TMD, and VVS
showed a reduced ability to adapt, which is in accordance with some previous findings (Zhang,
Discussion
In this study, six sensory perceptual metrics were obtained in young adults screened for
symptoms of episodic migraines. The results of the study demonstrated that, although reaction
times and detection thresholds of episodic migraineurs did not significantly differ from controls,
metrics reflecting lateral inhibitory mechanisms and the effect of adaptation on amplitude
discriminative thresholds were significantly different from controls. Furthermore, differences in
lateral inhibitory mechanisms and adaptation may vary across chronic pain conditions.
There were no significant differences found between observations obtained from the
episodic migraineurs and healthy control subjects on reaction time and detection threshold tasks
which suggest that, for the subjects within this study, peripheral neuropathy may not appear to be
a manifestation of migraine. While previous research has shown increased thresholds for thermal
and mechanical noxious stimuli (an anti-nociceptive effect), there have been few reports
analyzing differences in detection thresholds of non-noxious vibrotactile stimuli (Ladda, Straube,
Förderreuther, Krause, & Eggert, 2006). Reduced dynamic thresholds relative to static thresholds
have been previously observed in particular groups of women with vulvodynia (Zhang, et al.,
2011). In a larger or more specific population of migraine patients, similar trends might be more
evident, so future research must necessarily be conducted to verify if sensory thresholds are
altered in this clinical population.
Previous reports have suggested that there may be dysfunction in the balance between
excitatory and inhibitory neurotransmission with migraine (Cosentino, et al., 2011; Coppola &
Schoenen, 2012), and this imbalance could be caused either by excessive excitation or by
insufficient inhibition. Such systemic cortical hyper-excitability would predictably interfere with
discrimination task. Previous studies have shown that suppressing inhibition with GABA
receptor antagonists decreases the resolution of the activity evoked by two electrically-stimulated
sites in sensorimotor cortical slice (Kohn, Metz, Quibrera, Tommerdahl, & Whitsel, 2000). Thus,
amplitude discriminative capacity might prove to be a sensitive metric of cortical
hyper-excitability for sufferers of episodic migraines.
Impairment of sensory habituation in migraineurs has been a promising biomarker for
headache research and has shown to affect multiple sensory modalities (Ambrosini & Schoenen,
2006; Coppola, Pierelli, & Schoenen, 2009). In the young adult episodic migraine population,
although amplitude discriminative capacity was relatively elevated in comparison to controls, the
impact of the conditioning stimulation on the discriminative task was also reduced. These results
indicate that the healthy controls adapted to the conditioning stimulus while the episodic
migraineurs failed to do so. Previous studies support the concept that lack of habituation in
migraineurs may be to be due to increased neuronal excitability or decreased inhibitory
mechanisms while conflicting evidence suggest that lowered pre-activation levels may contribute
to lack of habituation (Coppola, et al., 2005). The results of this study are more consistent with
previous research analyzing the balance between excitatory and inhibitory neurotransmission in
observing that migraineurs show a reduced adaptation metric, which is associated with
short-term potentiation or habituation, in comparison to healthy control subjects (Ambrosini &
Schoenen, 2006; Coppola & Schoenen, 2012; Coppola, Pierelli, & Schoenen, 2009; Schoenen,
1996).
white matter lesions and iron deposits in the periaqueductal gray region (Kruit, van Buchem,
Launer, Terwindt, & Ferrari, 2010). Functional alterations include focal areas of brain
hypo-metabolism, cortical hyper-excitability, central sensitization, and dysfunction in thalamic gating
to modulate sensory input (Brighina, Palermo, & Fierro, 2009; Coppola & Schoenen, 2012;
Siniatchkin, et al., 2011). Previous studies also suggest involvement from pre- and post-synaptic
mechanisms as well as glial interactions that may be associated with hyper-responsiveness and/or
cortical spreading depression (Aurora, Kulthia, & Barrodale, 2011; Weir & Cader, 2011).
Pharmacologic influences include paradoxical responses to opioids and changes in levels of
excitatory amino acids in the anterior cingulate gyrus and insula (Bahra, Walsh, Menon, &
Goadsby, 2003). The presence of such alterations in brain physiology suggests the potential for a
biologically-based assessment to quantify and measure these differences with scores that could
be characterized, validated, and tracked over time. The long-term objective of this work is to
develop methods that can improve diagnosis and enable more accurate assessments of treatment
efficacy for headache populations. Currently, there are no standardized methods for objective,
quantitative tools to measure the impact that headache has on cortical information processing, or
the degree to which treatments are effective. The non-invasive technique reported in this study
has the potential to be utilized in a manner that could enable improvements in diagnosis and
Section 3.2. Alcoholism
Background
A number of studies have shown that chronic alcohol use can lead to sensory impairment
and/or altered central processing. Sensory assessments of individuals with alcoholism, in
particular assessments of vibration thresholds, thermal sensitivities, and pain tests, have provided
useful metrics in detecting and describing alcoholic peripheral neuropathy (Hilz, Claus,
Neundorfer, Zimmermann, & Beric, 1994; Hilz, et al., 1995; Jochum, Boettger, Burkhardt,
Juckel, & Bar, 2010; Sosenko, et al., 1991; Yamitsky & Zaslansky, 1998). Impairment in central
neural mechanisms in individuals with alcohol use disorders has also been demonstrated by
analyzing sensory evoked potentials (Marco, Fuentemilla, & Grau, 2005).
Alcohol consumption among college students, a population which is particularly
susceptible to moderate to heavy binge drinking (Grant, et al., 2004; Wechsler & Nelson, 2001;
Wechsler, et al., 2002), has been shown to impair a variety of centrally-mediated functions of the
nervous system inclusive of, but not limited to, spatial memory judgment and decision-making,
mood and behavior, motor performance, learning, executive functioning, and rate of information
processing (Courtney & Polich, 2009). These studies suggest that central information processing
could be significantly impacted with long-term alcohol use by college-aged students.
A battery of tests (see Neurosensory Assessments) was administered to college students
screened for alcohol consumption and related behaviors. This study serves as an extension of
Personality Questionnaire, TPQ; Family History, FH) and hedonic preferences to sucrose
solutions (sweet liking phenotype, SL) were paired with sensory perceptual metrics in order to
assess potential sensory information processing changes in college-aged students who consumed
alcohol on a regular basis. Evaluations assessing hedonic responses to sucrose concentrations
were conducted because the sweet liking phenotype is often associated with alcohol-related
behavior (Garbutt, et al., 2009; Lange, Kampov-Polevoy, & Garbutt, 2010). The results of the
study suggested that the sensory perceptual metrics which are presumed to predominantly be
peripherally-mediated were relatively insensitive to change with increased alcohol use, while
metrics centrally-mediated metrics were significantly altered with increased consumption.
Methods
Subjects
Following International Review Board approval and informed consent, 67 college
students ranging from 18 to 26 years of age were recruited through electronic mail
announcement from the Office of the Vice Chancellor of Student Affairs at the University of
North Carolina at Chapel Hill (UNC-CH). These subjects included light (n=22), moderate
(n=33), and heavy (n=12) drinkers screened for alcohol consumption via the Timeline
Followback (TLFB) assessment and the Alcohol Use Disorders Identification Test (AUDIT). All
subjects completed a survey on current medications and medical history prior to the experimental
tests to exclude participants with any history of neurological impairment. The subjects were
Screening Assessments
Two screening assessments were implemented to determine the alcohol consumption of
each of the subjects. The Timeline Followback (TLFB) method (Sobell, Sobell, Leo, & Cancilla,
1988) was administered to estimate alcohol consumption in a timeframe of one month (drinks
per month, DPM). Alcohol consumption was defined by the product of the number of episodes in
which subjects consumed alcohol per month and the drinks that they consumed per drinking day.
The Alcohol Use Disorders Identification Test (AUDIT) (Schmidt, Barry, & Fleming, 1995) was
a screening tool used to categorize the subjects according to risk for alcohol problems. Typically
scores below 8 were considered low risk for alcohol problems while scores above 16 represented
high risks for alcohol problems. According to these two screening tools, and considering the
definition of moderate drinking by the National Institute on Alcohol Abuse and Alcoholism
(NIAAA), the subjects were categorized as light (DPM<30 and AUDIT<8, n=22), moderate
(DPM≤60 or AUDIT≥8, n=33), and heavy (DPM>60 and AUDIT≥8, n=12) drinkers.
Additional evaluations were also considered for comparison. The Rutgers Alcohol
Problems Index (RAPI) (Neal, Corbin, & Fromme, 2006; White, Labouvie, & Papadaratsakis,
2005) was a tool used to assess drinking problems where scores less than 10 were considered
low risk. Moreover, the Gormally Binge Eating Scale (BES) (Gormally, Black, Daston, &
Rardin, 1982) was an evaluation used to assess binging characteristics in relation to substance
abuse where scores less than 27 were considered low risk.
Sweet liking (SL) and novelty seeking (NS) phenotypes have been previously studied in
(VAS) of preference to unsweet or sweet solutions. The responses were subsequently categorized
by the sign of their slopes, which were calculated as the change in hedonic response scale over
the change in the sugar concentrations measured in units per concentration (M-1). Negative
hedonic response slopes were categorized as sweet dislikers (SL-) and positive slopes were
categorized as sweet likers (SL+) regardless of the magnitude of the values. Novelty seeking
(NS) was determined via one of three components (Novelty Seeking, NS; Harm Avoidance, HA;
Reward Dependence, RD) of the Tridimensional Personality Questionnaire (TPQ) (Cloninger,
1987). Based on previous research, only the novelty seeking phenotype was considered for
analysis, and the cutoff for determining low (NS-) versus high (NS+) novelty seeking
characteristics was a score of 15.
Family history (FH) of alcoholism was also analyzed to provide further insight as to
whether subjects with genetic predispositions of alcohol consumption correlated with
performance on sensory perceptual metrics.
Neurosensory Assessments
Six sensory perceptual metrics were analyzed. The reaction times (RTs and RTc) and
detection thresholds (DTs and DTd) were determined according to the previously-outlined
protocol parameters (see Neurosensory Assessments). The amplitude discrimination task was
performed in the absence (ADs) and presence (ADssa) of single-site adaptation with standard
Data Analysis
Two-sample, one-tailed t-tests, were used to evaluate the difference in the performance of
among groups with difference alcohol consumption behavior. The data are presented as means
and standard errors of the means. A probability (p-value) of less than 0.05 was considered
statistically significant.
Results
This population of college students reported alcohol consumption ranging from 0 to 144
drinks per month and AUDIT scores ranged from 0 to 28. The RAPI scores ranged from 0 to35,
Gormally BES scores ranged from 16 to 52, and novelty seeking scores ranged from 3 to 29.
Reaction times and detection thresholds were not significantly impacted over increased
alcohol consumption.
The mean simple reaction times were significantly quicker than choice reaction times
(244.9±14.6 ms versus 415.4±14.3 ms, ***p<<0.01, Figure 3.3.A.) over increased alcohol
consumption. While simple and choice reaction times were slower for moderate drinkers than for
heavy drinkers (*p=0.017 and **p=0.008, respectively), the metrics were within normative
values for controls, and there were no significant trends or differences comparing light drinkers
to either moderate or heavy drinkers (Figure 3.3.A.). Furthermore, the effect of choice on simple
reaction times did not differ with increased alcohol consumption (93.1±9.5 %, p>0.05, Figure
consumption. While dynamic detection thresholds were higher for moderate drinkers than for
light drinkers (*p=0.017), the metrics were within normative values for controls, and there were
no significant trends or differences comparing static and dynamic detection thresholds in heavy
drinkers to either light or moderate drinkers (Figure 3.3.C.). Furthermore, the effect of
feed-forward inhibition on detection thresholds did not differ with increased alcohol consumption
(77.5±8.9 %, p>0.05, Figure 3.3.D.).
The effect of adaptation on amplitude discrimination was reduced over increased alcohol
consumption.
The mean Weber fractions for amplitude discrimination were significantly affected by
single-site adaptation for low (***p=0.00006) and moderate (***p=0.0001) drinkers, but
conditioning stimulation failed to significantly affect thresholds for heavy drinkers (p=0.12,
Figure 3.3.E.). While there was no significant difference in simple amplitude discrimination
difference limens with increased alcohol consumption (35.9±2.9 %, p>0.05), thresholds in the
presence of conditioning stimulation were significantly higher for light versus heavy drinkers
(*p=0.015) (Figure 3.3.E.). Furthermore, the effect of single-site adaptation on amplitude
Additional metrics provided insight into potential mechanisms involved in alcohol
consumption behavior.
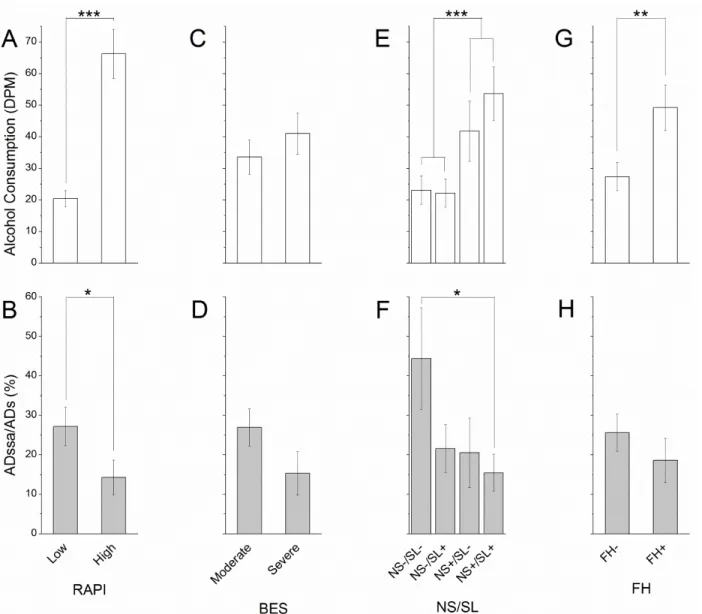
The RAPI categorized subjects according to low (n=44) versus high (n=23) risk of
drinking problems while the Gormally BES divided subjects into having low (n=42) versus high
(n=24) binging characteristics. While higher RAPI scores correlated with increased alcohol
consumption (***p<<0.01, Figure 3.4.A.) and reduced effect of adaptation (*p=0.026, Figure
3.4.B.), the Gormally BES showed low predictive value for both consumption behavior and
adaptation responses (Figure 3.4.C.,D.).
Subjects were also categorized according to novelty seeking and sweet liking phenotypes:
NS-/SL- (n=8), NS-/SL+ (n=24), NS+/SL- (n=10), NS+/SL+ (n=24). Novelty seeking (NS+)
correlated with higher alcohol consumption (***p=0.00043, Figure 3.4.E.) while only subjects
with both novelty seeking and sweet liking traits (NS+/SL+) showed a reduced effect of
adaptation when compared with those exhibiting neither phenotypic trait (NS-/SL-) (*p=0.032,
Figure 3.4.F.).
Finally, family history (FH+, n=27) of alcohol consumption showed significantly higher
alcohol consumption than those without history of alcoholism (FH-, n=40) (**p=0.007, Figure
Discussion
In this study, six sensory perceptual metrics were obtained in college students who
consumed alcohol. The results of the study demonstrated that, although reaction times and
detection thresholds of did not significantly differ across ranges of alcohol consumption, metrics
reflecting the effect of adaptation on amplitude discriminative thresholds were significantly
reduced over increased reported alcohol consumption.
The observations from this study indicated that there were no significant changes in
peripherally-mediated metrics across the spectrum of alcohol consumption even though previous
studies have indicated that there are altered reaction times and sensory threshold measures with
alcohol consumption (Schweizer & Vogel-Sprott, 2008; Tzambazis & Stough, 2000). Heavier
alcohol consumption significantly reduced the impact of adaptation on the amplitude
discrimination task, an impairment which has been shown to effect centrally-mediated neural
mechanisms in this population (Marco, Fuentemilla, & Grau, 2005).
The mechanisms of adaptation are suspected to be impacted in alcoholism because
chronic exposure to ethanol has been shown to affect GABA neurotransmission as well as
NMDA receptor availability. Previous animal and human studies have showed that, at the level
of neurotransmission, chronic exposure to ethanol increases the amount of pre-synaptic GABA
neurotransmitter released and the post-synaptic response (Fleming, Manis, & Morrow, 2009;
Valenzuela, 1997; Vengeliene, Celerier, Chaskiel, Penzo, & Spanagel, 2009). Furthermore, there
is a redistribution and increase in NMDA receptor concentration and density by upregulation
mechanisms with chronic ethanol exposure (Clapp, Gibson, Dell'acqua, & Hoffman, 2009;
Chandrasekar, 2013). Other research has shown that chronic alcohol consumption can lead to
neurotransmission, particularly by increasing tonic inhibition (Cardenas, Studholme, Meyerhoff,
Song, & Weiner, 2005; Crews, et al., 2005; Herting, Schwartz, Mitchell, & Nagel, 2010;
Oscar-Berman & Marinkovic, 2007; Pfefferbaum, Rosenbloom, Fama, Sassoon, & Sullivan, 2010;
Santhakumar, Wallner, & Otis, 2007; Sullivan & Pfefferbaum, 2005). Alterations in phasic and
tonic components of information processing may also be affected by alcohol intoxication and
drug tolerance as well as family history of these diseases (McBurney & Balaban, 2009). These
changes are likely to reflect the neuroadaptational response to alcohol involving alterations in the
healthy functional balance between inhibitory and excitatory mechanisms (Clapp, Gibson,
Dell'acqua, & Hoffman, 2009; Fleming, Manis, & Morrow, 2009; Heiss, Katz, Ganmor, &
Lampl, 2008; Higley & Contreras, 2006). This imbalance is supported by the use of
anticonvulsants/sedatives such as topiramate, acamprosate, benzodiazepines, baclofen,
gabapentin, and valproate to address the suspected cause of neurological dysfunction due to
plastic changes which occur following chronic alcohol consumption.
While increased alcohol consumption may have resulted in the reduced adaptation
capability through alterations in cortical plasticity, these changes may have been alternatively
due to innate traits associated with motivation. The significance of modulating the reward
response and reinforcing effects of alcohol addiction is supported by the use of
pharmacotherapeutics such as naltrexone and disulfiram. In observing the impact of conditioning
stimulation in relation to other phenotypic measures, the results suggested that alcohol-related
problems, novelty seeking characteristics, and hedonic preferences, particularly associated with
behavioral phenotypes related to alcohol use disorders but also in the ability to adapt to
conditioning stimulation (Johnson, 2010; Kranzler & Edenberg, 2010). Hedonic responses may
correlate with varying levels of opioid activity which may be subsequently involved in
GABAergic modulation (Davis, et al., 2009; Faure, Richard, & Berridge, 2010). Ultimately,
these results may suggest that alcohol use disorders may be related to both the predisposed state
of subjects, determined by characteristic phenotype, and exposure to alcohol. Together, these
factors may amplify impulsive nature and motivation to increase frequency of consumption.
However, the conclusions are limited in that they are not capable of differentiating whether these
decreased discrimination or adaptation abilities are due to these inherent phenotypes or if heavy
alcohol consumption results in cortical impairment.
Analyzing family history (FH) of alcoholism may provide further insight as to whether
subjects with predispositions of heavy alcohol consumption are impaired in their sensory
adaptation ability. There may be both genetic and environmental/epigenetic factors of substance
abuse which can lead to cortical dysfunction such as decreased capability for sensory adaptation.
Increased alcohol consumption in heavy drinkers may not necessarily result in lower adaptation
responses based on genetic heritability of alcoholism. Heritable genetic factors may not
necessarily predispose subjects to abuse alcohol, and the impulsive behavior may be dependent
on experience thus supporting possible alterations in neurotransmission or structural morphology
due to chronic alcohol consumption.
The causal mechanism in chronic alcoholism is still ambiguous. However, the screening
data paired with the sensory perceptual metrics may suggest differences in phenotypic traits and
neural compensation mechanisms (Werner, et al., 2009). Family history of alcohol use disorders