Cover Page
The handle http://hdl.handle.net/1887/54948 holds various files of this Leiden University dissertation.
Author: Ma, Y.
Title: Isotopic analysis of dietary patterns in northern China from the Proto-Shang Period to the Qin Dynasty
Isotopic analysis of dietary patterns in
northern China from the Proto-Shang
Period to the Qin Dynasty
Proefschrift
ter verkrijging van
de graad van Doctor aan de Universiteit Leiden,
op gezag van Rector Magnificus prof. mr. C.J.J.M. Stolker, volgens
besluit van het College voor Promoties
te verdedigen op donderdag 9 november 2017
klokke 11.15 uur
door
Ying Ma
Geboren te Xi’an, China
Promotores:
Prof. Dr. J.-J. Hublin (University of Leiden)
Prof. Dr. M. P. Richards (Simon Fraser University)
Promotie commissie:
Prof. Dr. H. van der Plicht (University of Leiden)
Prof. Dr. J.W.M. Roebroeks (University of Leiden)
Prof. Dr. K. Dobney (University of Liverpool)
Dr Jason Laffoon (University of Leiden)
This research was funded by the Max Planck Society from
CONTENTS
Chapter 1 – Introduction
Chapter 2 – Paleodiet Reconstruction and Stable Isotope Ratio Analysis
Chapter 3 – Introduction to the Cultural Prehistory and History of China
Chapter 4 – Isotopic Perspectives (d13C, d15N, d34S) of Diet, Social Complexity, and
Animal Husbandry during the Proto-Shang Period (ca. 2000 – 1600 BC) of China
Chapter 5 – Reconstructing Diet of the Early Qin (ca. 700 – 400 BC) at Xishan, Gansu Province, China (Article published in International Journal of
Osteoarchaeology)
Chapter 6 – Tracing the Locality of Prisoners and Workers at the Mausoleum of Qin Shi Huang: First Emperor of China (259-210 BC) (Article published in Scientific Reports)
Chapter 7 – Conclusions and Future Work
PUBLICATION DETAILS
CHAPTER 4. Isotopic Perspectives (d13C, d15N, d34S) of Diet, Social Complexity, and
Animal Husbandry during the Proto-Shang Period (ca. 2000 – 1600 BC) of China
Article published in American Journal of Physical Anthropology
Publication History:
Received 25 June 2015
Revised 23 February 2016
Accepted for publication 24 February 2016
Published online 12 March 2016
Full Citation:
Ma Y., Fuller B.T., Wei D., Shi L., Zhang X., Hu Y., Richards M.P. 2016. Isotopic perspectives (d13C, d15N, d34S) of diet, social complexity, and animal husbandry during the Proto-Shang period (ca. 2000 –
1600 BC) of China. American Journal of Physical Anthropology 160, 433-445.
CHAPTER 5. Reconstructing Diet of the Early Qin (ca. 700 – 400 BC) at Xishan, Gansu Province, China
Article published in International Journal of Osteoarchaeology
Publication History:
Received 24 June 2015
Revised 6 September 2015
Accepted for publication 9 October 2015
Full Citation:
Ma Y., Fuller B.T., Chen L., Zhao C., Hu Y., Richards MP. 2016. Reconstructing diet of the Early Qin (ca. 700-400 BC) at Xishan, Gansu Province, China. International Journal of Osteoarchaeology 26, 959-973.
CHAPTER 6 Tracing the Locality of Prisoners and Workers at the Mausoleum of Qin Shi Huang: First Emperor of China (259-210 BC)
Article published in Scientific Reports
Publication History:
Received 4 September 2015
Accepted for publication 19 April 2016
Full Citation:
CHAPTER 1
Aims and Objectives of this Thesis
1.1Introduction
Over 30 years have passed since stable isotope ratio analysis was first used to investigate paleodiet in China (Cai and Qiu, 1984). Since this pioneering study, there has been uneven but significant progress in the application of isotopic techniques to investigate Chinese archaeological material. However, there are many time periods, regions and topics which have yet to be examined in detail with stable isotopes in China.
Most of the previously published isotopic research focused on the Neolithic period (e.g. Zhang et al., 2003; Pechenkina et al., 2005; Hu et al., 2008; Barton et al. 2009; Lanehart et al., 2011), and later periods such as the early Bronze/Iron Ages that pre-date the formation of the Chinese Empire during the Qin Dynasty (221-206 BC), have been neglected. This is unfortunate as these pre-Empire periods are highly important to understand the formation processes of the first “Chinese” states and society. In addition, despite historical texts and archaeological evidence for social stratification in ancient Chinese society, only a handful of small scale isotopic studies have attempted to examine this topic in the past (Ling et al., 2010; Zhang et al, 2012; Zhang et al, 2014; Wang et al., 2014). Further, isotopic studies that investigate animal husbandry patterns and human mobility are uncommon in China. Thus, there exist significant gaps in our understanding and knowledge of the human lifeways and social patterns in pre-Qin Dynasty archaeological sites in China. Here my thesis will address this lack of information about these periods and topics by using three large and important site studies, where questions related to: stable isotope ratio analysis and dietary patterns, social stratification, animal husbandry practices and human mobility can be investigated.
1.2 Study Sites and Research Questions Investigated in this Thesis
a practical standpoint (access was granted for sampling, which can be difficult to obtain in China) as well as to provide more information about the dietary practices and social stratification of these understudied populations and time periods.
1.2.1The Nancheng site
The earliest site is that of Nancheng (Figure 1.1), located in Hebei Province, and attributed to the Proto-Shang Culture (2000-1600 BC) of the Shang people before they founded the Shang Dynasty (1600-1046 BC). While many archaeological sites dating to the Proto-Shang culture have been excavated over the last decades in Henan and southern Hebei Provence, knowledge about the lifeways, diet and social stratification during this period remains limited. The archaeological evidence and historical sources suggest that this group practiced a varied subsistence strategy based upon hunting, animal husbandry and agriculture (Zhang, 2002; Chen, 2007; Zhu, 2007; Hou et al. 2009; 2013). However, little direct research has explored the diet and social complexity of the Proto-Shang people, and only a single isotopic study has been previously published on a Proto-Shang archaeological site (Hou et al. 2013). This earlier work at the site of Liuzhuang found that the human diet was based on millets, pigs, cattle and dogs, and no differences related to age, sex or burial type (pit, stone coffin, and wooden coffin) were found. However, this research was limited in scope as only a small number of individuals were analyzed (n=21).
In chapter 4 of my thesis, I analyze the stable isotope ratios of carbon (d13C), nitrogen (d15N) and sulfur (d34S) of bone collagen from humans (n=83) at the Nancheng site and animals from
the nearby (~3 km) and contemporaneous site of Baicun (Table 1.1). The findings of this work were published in the American Journal of Physical Anthropology, and the full citation is listed below:
Ma Y., Fuller B.T., Wei D., Shi L., Zhang X., Hu Y., Richards M.P. 2016. Isotopic perspectives (d13C, d15N, d34S) of diet, social complexity, and animal husbandry during the Proto-Shang
period (ca. 2000 – 1600 BC) of China. American Journal of Physical Anthropology 160, 433-445.
1. Reconstruct the subsistence patterns and animal husbandry practices of this site to determine if the type of animal protein consumed was mainly centered on certain species of domestic animals such as pigs and cattle (as found by Hou et al. 2013), as opposed to other domestic animals (sheep/goats) and wild animals.
2. Investigate if there are unique dietary patterns that are linked to sex, age, and burial direction/position in the population.
3. Examine if dietary differences are linked to perceived social status, as inferred from the type of grave goods interred with the deceased. The goal of this type of analysis is to provide information about possible social hierarchy in a pre-state level society in China that was transitioning from an egalitarian to a hierarchical society.
1.2.2The Xishan site
The second site investigated in this thesis is Xishan, which is located in eastern Gansu Province (Figure 1.1), and dates to the Late Western Zhou to Warring States Periods (ca. 700-400 BC). It is a typical Qin culture site, the ancestors of those that established the Qin Dynasty, and was believed to have had a well-developed and rigid social structure (Sun, 2009). As the Qin can be viewed as the founders of Imperial China, a large volume of research has been devoted to their early history, culture and formation as a society (Duan, 1982; Ma, 1982; Xu, 2003). Past research has yielded conflicting results in terms of the subsistence strategies (nomadic pastoral vs. agriculture) of the early Qin, and this is an area of active debate (Zhang, 2001; Wang, 2007). Only a single small scale study that combined isotopic results and dental health patterns has been previously published for the Xishan site (Wei, 2008; Wei et al., 2009), but as no animal results were analyzed to act as a baseline to the human isotopic values, this study was limited in its ability to determine the type of animal protein consumed at the site. Thus, the dietary practices of the early Qin have yet to be fully investigated and resolved.
In chapter 5 of my thesis, I analyzed bone collagen d13C and d15N results from humans (n=33)
Ma Y., Fuller B.T., Chen L., Zhao C., Hu Y., Richards MP. 2016. Reconstructing diet of the Early Qin (ca. 700-400 BC) at Xishan, Gansu Province, China. International Journal of Osteoarchaeology 26, 959-973.
The central research questions of this work include:
1. Determine the human subsistence and animal husbandry practices at the Xishan site to see if they were engaged in nomadic pastoral activities, agriculture or a mixture of both practices.
2. Investigate if diets were different as a result of the well-defined social status (based on the number and quality of grave goods) during this period.
3. Examine if there were differences between tomb owners and sacrificial victims to again investigate differences related to social status.
4. Determine if there were dietary differences related to sex (males vs. females) which can also be related to social status since the early Qin were a male dominated society.
1.2.3The Qin Shi Huang Mausoleum
In chapter 6 of my thesis, I analyzed bone collagen d13C and d15N results from humans (n=223) and animals (n=9) from the Liyi site. In addition, I analyzed bone collagen d13C and d15N
results from humans (n=19) at the Shanren site (Table 1.1). The findings of this work were published in Scientific Reports, and the full citation is listed below:
Ma Y., Fuller B.T., Sun W., Hu S., Chen L., Hu Y., Richards M.P. Tracing the locality of prisoners and workers at the Mausoleum of Qin Shi Huang: First Emperor of China (259-210 BC) Scientific Reports 6, 26731 (DOI: 10.1038/srep26731)
The main research questions addressed here are:
1. Determine the dietary habits of the workers/craftsmen from the public cemetery of Liyi and the prisoners from the mass grave at Shanren that constructed the Qin Shi Huang Mausoleum for the first Emperor of China. Do dietary differences exist between these two populations and are these related to status or geography?
2. Review and examine the previously published isotopic studies of north (millet eating) and south (rice eating) China, and use these results to better understand the diets and possible geographic origins of these individuals found at Liyi and Shanren.
Table 1.1. Summary information about human and faunal bone samples used in this thesis. Site Region Culture Period Society Humans Fauna
Nancheng
Southern Hebei Province
Pro-Shang Late Longshan period Primary
hierarchy 83 36 (6 species)
Xishan
Eastern Gansu Province
Proto-Qin Late Western Zhou to
Warring States
Highly hierarchy
(with human
sacrifice)
33 58 (8 species)
Liyi Central
Shaanxi Province
Qin Late Warring States to
Qin Dynasty Highly hierarchy
223
9 (7 species)
Figure 1.1. Map showing the 34 Provinces of China and the location of the three archaeological sites that are the focus of these thesis.
1.3Structure of this Thesis
The structure of this thesis is as follows:
Chapter 1 – Introduction
Chapter 2 – Paleodiet Reconstruction and Stable Isotope Ratio Analysis Chapter 3 – Introduction to the Cultural Prehistory and History of China
Chapter 4 – The Nancheng Site: published in the American Journal of Physical Anthropology
Chapter 5 – The Xishan Site: published in the International Journal of Osteoarchaeology
Chapter 6 – The Qin Shi Huang Mausoleum: published in Scientific Reports
CHAPTER 2
Paleodiet Reconstruction and Stable Isotope Ratio Analysis
2.1Introduction
Eating is one of the most common, yet one of the most fundamental and vital activities of everyday life. The choice of foods consumed by an individual is a complex process that can be dependent on a variety of factors such as: traditions, religion, economics, social factors, gender, personal preferences and food availability (Coyston et al., 1999; Sutton and Yohe, 2007; Mays, 2010). The investigation of dietary habits in the past, known as paleodiet reconstruction (Kazenberg, 2000; Twiss, 2012; Reitsema, 2013; Price, 2015), can provide important information about an individual or a human population, well beyond that of: What did ancient people eat? Thus, there are a variety of different techniques that have been developed and applied to archaeological materials in order to investigate paleodiet practices. Here, I will briefly discuss some of these and then focus on stable isotope ratio analysis, as this is the analytical technique that is the focus of this thesis work.
2.1.1Techniques for the investigation of paleodiet
our ancestors, and these are briefly summarized below.
Figure 2.1. A picture of 4000-year-old millet noodles from the site of Lajia in Qinghai Province, China (from Lv et al., 2005).
2.1.2Archaeobotany
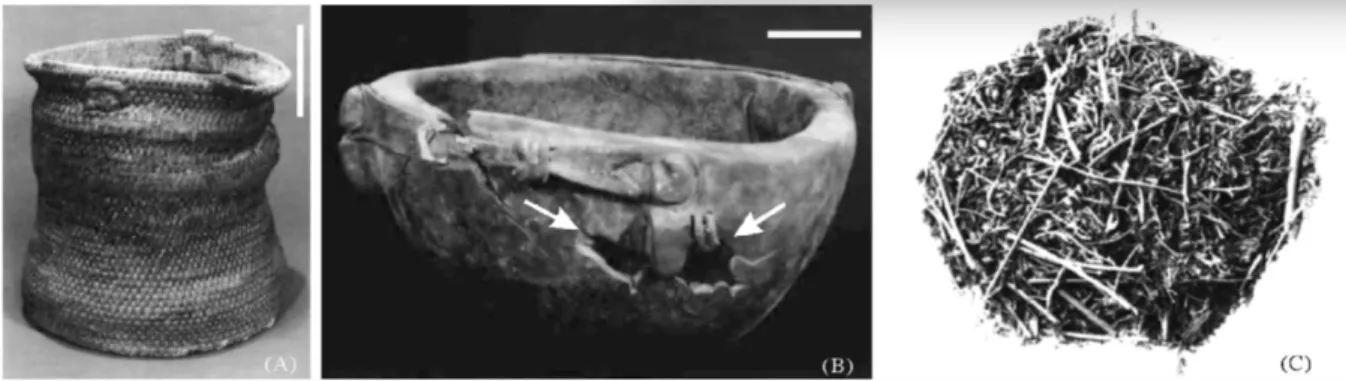
of analysis is important for the reconstruction of past climates and environmental conditions (Piperno, 2006; Pearsall and Hastorf, 2011). For example, Lv et al. (2016) extracted phytoliths and biomolecular compounds such as caffeine from ancient plant remains from two funerary sites in China: the Han Yangling Mausoleum in Xi’an (Shaanxi Province) and the Gurgyam cemetery in the Ngari District of Tibet. They found that tea was grown 2100 years ago to cater to the drinking habits of individuals of the Western Han Dynasty (207 BC-9 AD), and then carried to Central Asia by ca. 200 AD along a branch of the Silk Road, several hundred years earlier than previously thought. In another example, Jiang et al. (2006) analyzed plant remains which were found in a leather basket and wooden bowl for a tomb of a male shaman at the Yanghai cemetery, Turpan District in Xinjiang and dating to 500 BC (Figure 2.2). By comparing the morphological and anatomical characteristics with modern samples, they were able to identify the plant remains as Cannabis sativa and believe that this plant was used for ritual or medicinal purposes.
Figure 2.2. A) Leather basket B) Wooden bowl C) Cannabis sativa from the Yanghai cemetery, Xinjiang. (from Jiang et al. 2006).
2.1.3Zooarchaeology
DNA analysis, etc. (Peres, 2010; Albarella et al., 2016). These studies permit investigations into complex questions relating to human and animal relationships such as past hunting activities, subsistence practices, economics and paleoenvironments (Lyman, 1996; O’Day et al., 2003; Defrance, 2009). For example, Li et al. (2014) analyzed sheep and goats remains from two terminal Neolithic sites, Taosi and Xinzhai (ca. 2500-1800 BC), as well as one Early Bronze Age site Erlitou (ca. 1800-1500 BC) in Shanxi and Henan Provinces. This research revealed the complexity of sheep and goat herding practices in the Central Plains of China, and explored the use of secondary production products such as, wool and milk, by the inhabitants of these sites. In particular, the results indicate that at Erlitou, sheep were mainly exploited for meat consumption during phases II and III, but were mainly exploited for wool production during phase IV of the occupation. This work also found evidence that there were different sheep/goat usage patterns between elite and non-elite social groups as well as between urban vs. village sites.
2.1.4Residue analysis
Figure 2.3. Pottery vessel with beer residues from the Mijiaya site, Shaanxi Province (from Wang et al. 2016).
2.2Introduction to Stable Isotope Ratio Analysis
Developed in the 1970s as an offshoot of radiocarbon dating (Makarewicz and Sealy, 2015), stable isotope ratio analysis can be summarized by the common phrase: “You are what you eat”. Basically, the isotopic signatures of the foods and liquids consumed by an organism are incorporated into its tissues in a relatively known and predictable manner (Lee-Thorp, 2008). Therefore, the measurement of these isotopic signatures allows an approximate reconstruction of dietary habits in the past. This technique has become a common addition to archaeological studies in the last 25 years and has been used to investigate a variety of research topics such as: subsistence practices, animal husbandry patterns, health and nutrition, social status, etc. (Kazenberg, 2000; Lee-Thorp, 2008; Schoeninger, 2011; Reitsema and Vercellotti, 2012; Reitsema, 2013). What follows in this chapter is a brief overview of the technique of stable isotope ratio analysis.
2.2.1Definitions
chemist, Sir Fredrick Soddy. The word “isotope” is derived from the Greek word iso (same or equal) and topos (place), and this is because isotopes of an element occupy the same position or place in the periodic table (Platzner, 2012). Isotopes can be divided into two types, stable and unstable (radioactive), and are commonly written using the following notation AX, where X represents the chemical symbol of an element and A is the sum of the number of protons and neutrons. For example, three isotopes of carbon exist in nature:
12C = Stable (6 protons + 6 neutrons = 12)
13C = Stable (6 protons + 7 neutrons = 13)
14C = Radioactive (6 protons + 8 neutrons = 14)
Figure 2.4. The three naturally occurring isotopes of carbon, each having the same numbers of electrons and protons but a different numbers of neutrons. (from http://imgarcade.com/1/all-carbon-isotopes/).
are studied in archaeology, but since this thesis is only focused on the measurement of carbon, nitrogen, and sulfur isotopes, only these will be discussed in detail (Fritz and Fontes, 1986; Fry, 2006).
Table 2.1. Stable isotopes of the common elements used paleodiet reconstruction (modified from Fritz and Fontes, 1986; Fry, 2006).
Element Isotopes Nature Abundance (in percent)
Isotope Ratio Measured
Hydrogen
1H 99.985
D/H
2H or (D) 0.015
Carbon
12C 98.89
13C/12C
13C 1.11
Nitrogen
14N 99.64
15N/14N
15N 0.36
Oxygen
16O 99.76
18O/16O
17O 0.037
18O 0.024
Sulphur
32S 95.02
34S/32S
33S 0.76
34S 4.21
36S 0.014
2.2.2Fractionation
main form of isotopic fractionation associated with biological systems in terms of enzymatic reactions (O’Leary, 1981). Thermodynamic fractionation is associated with physical reactions where no bonds are broken and examples include: evaporation, distillation or infrared absorption (White, 2015).
2.2.3Notation
Because the variations between stable isotope ratios are very small, generally only a few tenths of a percent, it is common practice to express the isotopic composition of a substance as a delta “d” value which represents the measured deviation of an isotopic ratio against a particular elemental standard (Table 2). The d values are expressed in parts per thousand (‰) using the following notation:
δ sample ‰ = +,-./01
+,2 − 1 ×1000
Where R = the isotope ratio of the heavier to the lighter element in a measured sample divided by the standard of that element. For example, the equation for the stable isotope ratios of carbon is as follows:
789: =
89: 8;:
,-./01 89:
8;:
,2
− 1 ×1000
Table 2.2. The international reference standards for the five common elements used in paleodiet reconstruction (from Hoefs, 2009).
Element International Standard
Hydrogen Vienna-Standard Mean Ocean Water (V-SMOW)
Carbon Vienna-Pee Dee Belemnite (VPDB)
Nitrogen Atmospheric Nitrogen (AIR)
Oxygen Vienna-Standard Mean Ocean Water (V-SMOW)
Sulphur Vienna-Canyon Diablo Meteorite Troilite (VCDT)
2.2.4Mass spectrometry
The most effective method of measuring the stable isotope ratios of an element is with an isotope ratio mass spectrometer (IRMS). This machine is specifically designed to measure small differences in the mixtures of naturally occurring isotopes by the manipulation of external electric and magnetic fields (Figure 2.5) (Brand, 2002).
In paleodietary studies, solid substances such as bone/dentine collagen, hair, etc. are first placed in tin (for d13C and d15N analysis) or silver (for dD and d18O) capsules. These capsules are then
introduced into an elemental analyzer and combusted to create CO2 and N2, and these gasses
are carried to the ion source where they are transformed into electrically charged particles. The resulting ion beam is focused and directed into the mass analyzer via a flight tube. The mass analyzer contains electric and magnetic fields that are used to alter the speed and direction of the ions. The amount of deflection of the ion’s trajectory depends on its mass-to-charge ratio (m/z) with lighter ions more easily deflected than heavier ions (Fry, 2006). When the beam of ions passes from the analyzer, it is measured in the ion detectors, and the abundances of each ion are calculated. For example, in Figure 2.6 a schematic diagram of a continuous flow IRMS is presented (Carter and Barwick, 2012).
Figure 2.6. Simple schematic diagram of continuous flow isotope ratio mass spectrometry for the determination of δ13C and δ15N (modified from Carter and Barwick, 2012).
and Mensing, 2005).
2.3Common Stable Isotope Ratios that are Studied in Paleodiet Research
2.3.1Carbon (δ13C)
The two stable isotopes of carbon, 13C and 12C, have natural abundances of 1.1% and 98.9%, respectively (Burlingame and Schnoes, 1969). The majority of the carbon in the world is non-biological, but the largest sources of variability occurs during the transfer of atmospheric carbon to and from the ocean and into biological systems (Schoeninger and Moore, 1992). As a result of diffusion, the concentration of 12C increases relative to 13C, so that plants have negative δ13C values compared with the source carbon (O’Leary, 1981). The δ13C value of modern CO2 is about -7‰. However, before the Industrial Revolution, this value was elevated
by approximately 1.5‰. As a result of the release of anthropogenic carbon into the atmosphere from deforestation and the burning of fossil fuels (Suess effect), d13C values have become
lower over the past few hundred years (Keeling, 1961; Bada et al., 1990). Thus, when we directly compare modern and archaeological δ13C samples, 1.5‰ should to be added to the
modern δ13C values.
Atmospheric carbon dioxide (CO2) is the main carbon source for all terrestrial plants. Land
plants are divided into three types according to how they biosynthesize or fix carbon during photosynthesis. The three pathways of photosynthesis are: C3 (Calvin-Benson Cycle), C4
(Hatch-Slack Cycle) and CAM (Crassulean Acid Metabolism), and each of these pathways results in distinct δ13C values in the tissues of plants (Park and Epstein, 1961; O’Leary, 1988). Plants are called C3, because the first product that they make during photosynthesis has a
molecule with three carbon atoms (Schoeninger and Moore, 1992). The majority of the vegetation in temperate zones is composed of C3 plants: trees, bushes, leafy plants and some
grasses. The typical δ13C values of C3 plants range from –24‰ to –34‰ (with an average of –
26.5‰) (Smith and Epstein, 1971). In contrast, C4 plants produce a four-carbon compound
during their first step of photosynthesis, hence their name. C4 plants usually are native to hot
and arid environments and include some important cultivated crops such as: maize, millet, sorghum and sugar cane (Price et al., 1985). The δ13C results of C4 plants are about 13‰ higher
1971). Figure 2.7 shows the frequency and δ13C values of C
3 and C4 plants (from Cerling and
Harris, 1999; Hoefs, 2009).
Figure 2.7. The frequency and δ13C values of C3 and C4 plants (from Cerling and Harris, 1999;
Hoefs, 2009).
CAM plants have more flexible means of photosynthesis and are able to switch between C3
and C4 pathways, depending on environmental conditions (Bender et al., 1973; Osmond, 1978).
However, CAM plants are not the subject of frequent study in archaeology since few edible crops use this photosynthetic pathway (Price et al., 1985). Beside the principal influences of photosynthesis, some climatic effects can also lead to substantial variations in the δ13C values of both C3 and C4 plants. These factors include but are not limited to: water and nutrient
availability, temperature, altitude, light intensity and soil quality (Tieszen, 1991; van der Merwe and Medina, 1991; Lajtha and Marshall, 1994). For example, increased light and/or temperature and decreased water availability can result in an increase of the δ13C values in
plants of the same species (Heaton, 1999; Hedges et al., 2004).
In aquatic ecosystems, organisms can derive carbon from several sources, including terrestrial detritus (with δ13C values representative of a mixture of local terrestrial plants), dissolved CO2
(with δ13C of atmospheric CO2), and dissolved carbonic acid (with δ13C values close to 0)
mainly from seawater, which is about 7-8‰ elevated in δ13C values compare to atmospheric
CO2 (Craig, 1953; Richards and Hedges, 1999). Sea grasses have δ13C values similar to C4
plants, whereas some cold water plankton species have δ13C values close to C
3 plants (see
Figure 2.8).
The majority of marine species such as fish and higher carnivores such as seals and whales have 13C-enriched values near –12‰, and these values overlap with terrestrial C4 consumers
(Schwarcz and Schoeninger, 1991; Richards and Hedges, 1999). This can make the identification between the two groups difficult based on only d13C results. Freshwater plants
and the fish that feed on them usually have mean δ13C values near –25‰, which is close to C3
plants, but sometimes may vary widely, reflecting the contribution of various carbon sources (Rau, 1978; Chisholm et al., 1982; Schoeninger and DeNiro, 1984).
Figure 2.8. δ13C values of different plants species (after Cerling and Harris, 1999).
2.3.2Nitrogen (d15N)
The two stable isotopes of nitrogen, 15N and 14N, have abundances of 0.4% and 99.6%, respectively. More than 99% of the exchangeable nitrogen exists as either N2 in the atmosphere
or as dissolved N2 in the ocean (White, 2015). Plants can uptake nitrogen from two different
sources: the atmosphere or the soil. For example, some legumes (such as peas and beans) and algae (such as blue or green algae) can obtain nitrogen directly from the atmosphere. The δ15N values of this fixed nitrogen in organic matter are generally similar to atmosphere N2 (~0‰)
(Michener and Lajtha, 2007). However, most plants are not able to directly uptake N2, and
instead absorb nitrogen from the soil by assimilating NH4+ or NO3-. Thus, terrestrial plants
using these nitrates display more positive δ15N values than plants that use N2-fixing. Most
modern non-N2-fixing plants have δ15N values that generally range between 0‰ and 6‰,
although a broad range is observed (Choi et al., 2003). The δ15N values of terrestrial plants are strongly dependent on the soil, and other factors, such as: water availability, temperature, altitude, rainfall and the application of fertilizers (Ambrose, 1991; Schwarcz et al., 1999). Marine plants take up nitrogen from dissolved nitrates in the seawater, which are produced by bacterial denitrification, and these are more positive in 15N compared with atmospheric and
soil nitrogen. Thus, marine plants have higher δ15N values than terrestrial plants (Wada, 1980).
In addition, similar to marine systems, freshwater plants have high δ15N values (France, 1995; Katzenberg and Weber, 1999).
The δ15N values of animals and humans are related to their diets and increase by approximately 3-6‰ with each ascending step of the food chain, and this is known as the nitrogen trophic level effect (DeNiro and Epstein, 1981; Minagawa and Wada, 1984; Bocherens and Drucker, 2003; O’Connell et al., 2012). For example, in temperate environments, terrestrial herbivores have lower δ15N values compared to carnivores, and in marine ecosystems lower trophic level fish have lower δ15N values compared to higher trophic level fish and marine carnivores (Richards and Hedges, 1999; Lee-Throp, 2008) (Figure 2.9). Humans show distinct δ15N differences related to diet with omnivores having higher δ15N values compared to vegetarians and vegans (Petzke et al., 2005). Thus, the combination of δ13C and δ15N values is a valuable tool for distinguishing the types of food consumed from temperate C3 and C4 environments and
Figure 2.9. Simplified drawing of stable carbon and nitrogen isotope ratios in the biosphere. (Note: Black box = estimated range of freshwater fish consumers; Blue box = estimated range of freshwater fish; Green box = estimated range of terrestrial C3 plants; Orange box = estimated
range of C3 terrestrial ecosystems; Red box = estimated range of marine ecosystems; Purple
box = estimated range of terrestrial C4 plants).
2.3.3Sulphur (d34S)
The four stable isotopes of sulphur and their natural abundances are listed: 32S (95.02%), 33S
(0.76%), 34S (4.21%), 36S (0.014%). The isotopes that are commonly measured are 32S and 34S,
since these are the two most abundant of the four (Hoefs, 2009). The δ34S value is reported
relative to the meteorite standard Vienna Canyon Diablo Troilite (VCDT) (Coplen and Krouse, 1998) by the standard equation:
79<=
,-./01 = 9<S 9;=
,-./01 9<S
9;=
?@AB
− 1 ×1000
The main reservoirs of sulphur are oceanic soluble sulphates, evaporitic sulphates, and reduced pyrites, with minor reservoirs found in the atmosphere, fossil fuels and the soil (Newton and Bottrell, 2007; Nehlich, 2015). The sulphur cycle has a number of similarities to the carbon cycle, through weathering, the water cycle and tectonic movements (Bottrell and Newton, 2006). Sulfur in marine environments is mainly present as sulphate (SO42-), which is 34
S-enriched with a fairly uniform value of 20‰ across the global (Rees et al., 1978). Thus, marine organisms usually have δ34S values near to 20‰. Sulphate in seawater can be transported by the wind and influence the δ34S values of islands or coastal terrestrial regions, and this is known as the ‘sea spray effect’ (O’Dowd et al., 1997). The δ34S values of freshwater environments have a wide range of variability, and this can be attributed to anaerobic bacteria in the sediments of rivers and lakes which can reduce the sulphate ions to hydrogen sulphide (Faure, 1997; Richards et al., 2003a). The δ34S values for sedimentary rocks are highly variable depending on rock type and age (Faure, 1997). Terrestrial plants incorporate the majority of sulphur as sulphate (SO42-) from the soil, and thus their δ34S values generally reflect the geological δ34S
values. However, plants can also derive inorganic sulphur from the atmosphere (SO2, up to 90%)
(Peterson and Fry, 1987; Richards et al., 2003a). Terrestrial plants have reported δ34S values ranging from –22 to +22‰, and this high variability is a result of local environmental and geological conditions (Figure 2.10).
Figure 2.10. Box model of the sulphur cycle in the environment (modified from Nehlich, 2015).
vitamins and cofactors (Nielsen et al., 1991). There is only a slight fractionation (approximately -1‰) for δ34S values with each step of the food chain or increase in trophic level (Richards et
al., 2003a). Therefore, the δ34S values in human and animal tissues generally reflect the δ34S
values of the food consumed (Hobson, 1999). Figure 2.11 shows the theoretical ranges for δ13C and δ34S values for specific food web niches and environments in archaeological research (Nehlich, 2015).
Figure 2.11. Theoretical ranges for δ13C and δ34S values for specific food web niches and environments in archaeological research (adapted from Nehlich, 2015).
With the improvements in continuous flow methods, smaller amounts of bone collagen (3-10 mg) can now be analyzed for d34S values, but this is still larger than what is required for δ13C
and δ15N measurements (Figure 2.12). Thus, combined with δ13C and δ15N measurements, the
Figure 2.12. Differences in the amount of bone collagen needed for d13C and d15N vs. δ34S measurements.
2.4Experimental Procedure of Stable Isotope Ratio Analysis
2.4.1Common materials used for stable isotope analysis
The majority of paleodietary studies in archaeology are focused on bones and teeth for the simple reason that these are often the only tissues of an organism that survive the burial process (Mays, 2010). Bone is a complex tissue composed of an inorganic (mineral) fraction (approximately 55-75% of dry weight) and an organic matrix (White and Folkens, 2005). More than 90% of the organic component is the protein collagen, with the rest composed of other proteins such as osteocalcin (Masters, 1987; Bass, 2005). The mineral fraction in bone and tooth is mainly composed of calcium phosphate, which has the chemical formula Ca10(PO4)6(OH)2. Both collagen and bioapatite contain measurable amounts of carbon, which
and Fagre, 1993). While the bone collagen turnover in an adult is rather slow, about 1.5-4% every year in cortical bone, the collagen turnover in children is much more rapid and is estimated to be between 10-30% in cortical bone per year (Hedges et al., 2007). Therefore, the collagen stable isotope data from adult bones reflect a person’s average diet over the last decade or so of life.
Bone degrades over time after burial and collagen survival mainly depends on many factors including: temperature, soil moisture and pH and microbial attack (Smith et al., 2005; Mays, 2010). In certain special conditions such as cold or cave environments, collagen can survive for more than 100,000 years (e.g. Britton et al., 2012). Degraded collagen or collagen that is contaminated can result in altered isotopic compositions from the original value, and thus identifying the preservation of bone collagen is a priority for isotopic analysis. There are four main criteria that are routinely used to assess if d13C and d15N results from collagen are
acceptable. These include: % collagen yield, %C, %N and atomic C:N (DeNiro, 1985; van Klinken, 1999). Of these four, the C:N is usually the most important and while a value of 3.2-3.3 is expected for modern collagen, values between 2.9-3.6 are considered acceptable for d13C
and d15N measurements (DeNiro,1985). For d34S measurements, Nehlich and Richards (2009)
designed quality criteria for archaeological bone samples. Measurements of samples with atomic C:S of 600 ± 300 and N:S of 200 ± 100 for mammalian collagen, and atomic C:S of 175 ± 50 and N:S ratio of 60 ± 20 for fish collagen are considered acceptable.
2.4.2Collagen extraction
There have been several different methods developed to extract collagen from archaeological bones (see Longin, 1971; Schoeninger and DeNiro, 1984; Sealy, 1986; Brown et al., 1988; Tuross et al., 1989, Richards and Hedges, 1999). In this dissertation, collagen samples were prepared following the standard protocol detailed in Richards and Hedges (1999) with the addition of an ultrafiltration step as recommended by Brown et al. (1988) and Jørkov et al. (2007). Small bone chunks (approximately, 0.5-1.0 g) were cleaned by air abrasion with Al2O3
concentrated by Amicon© ultrafilters (<30kDa), and finally the purified collagen was frozen
and freeze dried for 2 days.
2.5Application of Stable Isotope Ratios in Archaeological Research
2.5.1Subsistence practices
The earliest applications of stable isotopes to archaeological studies were mainly focused on maize agriculture in North America (Vogel and van der Merwe, 1977; van der Merwe and Vogel, 1978; Bender et al., 1981), and many subsequent studies on this topic were published (Schwarcz and Schoeninger, 1991; Schoeninger, 1995; Lee-Thorp, 2008). For example, it was found that maize replaced previously domesticated C3 plants at different times in different
regions. Near the Lake Erie area of Canada, maize became important to diets by about 500 AD (Stothers and Bechtel, 1987) whereas it was not until after 1000 AD that maize became important to human diets in southeastern Missouri, USA (Lynott et al., 1986). In contrast to North and South America, Europe does not have widespread C4 agriculture, and the majority
of edible plants are C3 (Lee-Throp, 2008). As a result of this, the first isotopic studies in Europe
were focused on detecting marine vs. terrestrial diets. Tauber (1981) found that Danish Mesolithic individuals had a high proportion of marine foods in their diet, however, with the introduction of farming and domestic animals during the Neolithic period there was a dramatic shift away from marine foods toward these domestic foods. Similar isotopic patterns indicative of diets shifting from marine to terrestrial foods were also observed for the Mesolithic to Neolithic transitions in Portugal (Lubell et al., 1994) and Britain (Richards et al., 2003b).
In addition, to d13C and d15N analysis, d34S measurements are increasingly applied to paleodiet
studies to investigate aquatic vs. terrestrial resource consumption. For example, Nehlich et al. (2010) examined d34S values from humans and animals from five archaeological sites in Serbia
along the Danube Gorges region dating from the Mesolithic to the middle Neolithic. The d34S
2.5.2Breastfeeding and weaning studies
An area of stable isotope analysis that has seen an increase in growth over the past 20 years is the reconstruction of breastfeeding and weaning patterns in modern and ancient humans (for a recent review see Tsutaya and Yoneda, 2015). This research is based on the fact that an infant becomes one trophic level higher than its mother during exclusive breastfeeding (e.g. Fogel et al., 1989; Fuller et al., 2006a). Thus, a 2-3‰ 15N-enrichment in the tissues of an infant permits the tracking of the duration of breastfeeding, and with the weaning process or the introduction of solid food to the diet, the d15N values of an infant or child decrease due to the consumption
of 15N-depleted foods. At the point when a child becomes fully weaned their d15N results
closely resemble maternal d15N values, assuming that both the mother and child consumed
similar diets. In addition, d13C measurements also provide important information about
breastfeeding and weaning patterns since a 1‰ increase is found between mothers and exclusively breastfed infants (Fuller et al., 2006a). The d13C values decline more rapidly to
maternal levels during the weaning process, and this allows an estimation of the duration of exclusive breastfeeding. Thus, the combination of both d13C and d15N measurements from the
bones of children of different ages allows the reconstruction of breastfeeding and weaning patterns for an archaeological population. For example, Fuller et al. (2006b) conducted isotopic analysis on collagen from the Late/Sub-Roman site of Queenford Farm, UK. This study found that most children were fully weaned in a gradual process between the ages of 2-4 years old. In addition, lower d13C values suggest that children had a more plant based diet compared to
the adult population. Isotopic analysis has also been done using tooth dentine and enamel to investigate individual patterns of breastfeeding and weaning (e.g. Fuller et al., 2003; Dupras and Tocheri, 2007). This type of research allows the investigation not only of infant/childhood diet but can be used to look at dietary patterns over the course of the age of formation of the tooth, and this has been applied with much success recently (Guiry et al., 2016). Unfortunately, there have been no isotopic applications of breastfeeding and weaning in China, but it is hoped that this type of research will be conducted in the future.
2.5.3Hominid evolution
Australopithecus africanus, a ~3 million year old hominid from the Makapansgat Limeworks in South Africa, ate fruits, leaves and large amounts of 13C-enriched foods, such as grasses and
CHAPTER 3
The Cultural Prehistory and Historyof China
3.1A Brief Introduction to Chinese Prehistory and History
Modern China represents one of the earliest regions where civilization originated, and its culture and influence have had, and continue to have, an impact across the world (Schirokauer, 1991; Barnes, 1999; Loewe and Shaughnessy, 1999). Chinese civilization has its roots in different Neolithic cultures, and it has gradually developed in the context of warfare and territorial interactions until the formation of the Empire in 221 BC under the first Emperor Qin Shi Huang (Table 3.1) (Zhang et al., 2005; Yuan et al., 2012; Shelach-Lavi, 2015). Here I present a brief introduction to the chronology of Chinese prehistory and history that will be helpful for the understanding of the three publications that are discussed in chapters 4-6 of this thesis.
Table 3.1. A simplified historical sequence of China from the Neolithic to the Qin Dynasty.
3.2Neolithic Culture
There were many different Neolithic cultures that existed across modern-day China, and these have been largely classified on the basis of their unique ceramic traditions (Figure 3.1) (Treistman, 1972; Zhang, 1986; Liu and Chen, 2012; Wilkinson, 2015). Most archaeologists have agreed to divide the Chinese Neolithic into four phases: Early, Middle, Late and Chalcolithic (Zhang, 2009; Ren and Wu, 2012), see Table 3.2.
as well, indicating that there was communication and exchange of ideas between these groups in northern China (Liu, 2004; Zhang and Wei, 2004). After 5000 BC various cultures flourished and became increasingly complex and finally transitioned to the Bronze Age by approximately 2000 BC (Dematte, 1999; Wang et al., 2007; Wang, 2013a; Liang, 2015).
Figure 3.1. Map of the important Neolithic cultures of China and their territories (from https://commons.wikimedia.org/wiki/File:Neolithic_china.svg#/media/File:Neolithic_china.s vg).
Table 3.2. Chronology and dating of the Chinese Neolithic.
Phase Dating Major Cultures
Northern China Southern China Early
Neolithic 10000-7000 BC Nanzhuangtou, Hutouliang Yuchanyan Middle
Neolithic 7000-5000 BC
Cishan-Peiligang, laoguantai, Xinglongwa
Pengtoushan, Chengbeixi Late
Neolithic 5000-3500 BC
Yangshao, Dawenkou,
Hongshan Hemudu, Daxi
3.2.1Yangshao culture (5000-3000 BC)
The Yangshao culture is the best documented and known of the Chinese Neolithic cultures (Gong, 2002). Its name comes from the village of Yangshao in Henan Province where the first remains of this culture were excavated and described by the Swedish archaeologist J.G. Andersson in 1921 (Zhang, 1986;). More than a thousand archaeological sites of the Yangshao culture have been found scattered over a large area including modern-day Henan, Shaanxi, Gansu and Qinghai Provinces (NBCR, 1991; 1999). The Yangshao culture is distinguished by its distinctive red and black painted pottery, which is decorated with human faces, animals and fish, geometrical designs, and markings that resemble an early form of writing (Figure 3.2) (Underhill, 2002; Qiu, 2013).
The Yangshao culture has been divided into three different phases and these as well as important characteristics of the culture are listed in Table 3 (Li, 2013; Liu and Chen, 2012; Zhu, 2013; Zhang, 2005). For example, the Banpo site in Shaanxi Province is representative of the early phase of the Yangshao culture. This large circular site was enclosed by a deep defensive ditch with a plaza in the center, and all of the doors of the houses faced the plaza. The inhabitants of Banpo interred their dead in a special burial area and babies were buried in pottery jars around the living areas of their houses (Xi’an Banpo Museum, 1982).
bowl in A (photo from the Banpo Museum, Xi’an, China).
Table 3.3. Chronology, sites and characteristics of the Yangshao culture.
Phase Dating Examples of
Major sites Region Social Organization
Early 5000-4000 BC
Banpo, Jiangzhai Beishouling Dadiwan
Wei River Valley in Shaanxi Province
Egalitarian
Middle 4000-3500 BC Miaodigou Xipo
Expanded in all directions from the above
Development of social hierarchy in some areas such as western Henan Province
Late 3500-3000 BC Xishan Henan
Province Increased social hierarchies
3.2.2Longshan culture (3000-2000 BC)
Figure 3.3. Typical black egg-shell pottery of Longshan culture (photo from http://www.360doc.com/content/15/0323/11/22522322_457359563.shtml).
The practices of divination, by applying heat to animal bones and turtle shells (oracle bones), strongly suggests that the Longshan people shared common beliefs and possibly religion, and writing systems may have also been practiced (Gao, 2009; Shao, 2005). There is evidence of the beginning of metallurgy during the Longshan period, and copper and bronze were used for making small implements and ornaments (Linduff et al., 2000). By approximately 2000 BC, the Longshan culture of the Yellow River Valleys declined and was replaced by the Erlitou culture (which many scholars believe represents the Xia Dynasty) and the Yueshi culture in Shandong (ca. 1900-1500 BC) (IA CASS, 2003; Liu and Chen, 2003; 2006; Xu, 2009; 2014).
3.3Shang Dynasty (1600-1046 BC)
advancement with the establishment of the Shang Dynasty at approximately 1600 BC (Zhang, 1980; Thorp, 2005; Zhang et al., 2007).
Originally, the Shang were a tribe who lived mainly along the lower reaches of the Yellow River in Hebei Province, but rapidly extended their territory to include northern and central Henan Province (Ding, 1988; Wang, 2011b; 2005). It is believed that the Shang banded together several tribes to defeat the Xia, and this allowed them to become the dominant power in the Yellow River Valleys for over seven centuries (Zhang, 2008; Huang, 2010). Various Chinese texts, such as: Mencius ( ), Zuo Zhuan ( ), Shiji ( ), and the Bamboo Annals ( ) mention important events of the Shang (Sima, 2006a; Anonymous, 2009; Mencius, 2012; Zuo, 2015), but these works were written hundreds of years later than the actual events and their veracity is debated. However, much of this textual evidence has been confirmed by archaeological evidence (XSZCP Group, 2000; Wang, 2015a), with more than 20,000 divinations inscribed on oracle bones recovered at the site of Yinxu near the town of Anyang in Henan Province (Figure 3.4).
These inscriptions on ox scapulae or turtle shells represent the earliest confirmed Chinese writing and detail important information such as: the complete royal genealogy of the Shang Dynasty, divination practices, and rituals of the late Shang Dynasty court (Keightley, 1978; Wang, 2007a). Thus, rites, divination, and ceremonies were of vital importance to Shang society, and ancestor worship played a particularly prominent role (Allan, 2010; Song, 2010). There was a large amount of human and animal sacrifice at Shang Dynasty sites, and this practice was used to aid communication and as tribute to the dead (Huang, 2004; Tang, 2004; Wu, 2012). Sophisticated bronze manufacturing techniques were fully developed during the Shang period. Various types of cast-bronze artifacts were found at excavated sites, which were used by the upper classes both as ritual vessels and grave goods (China National Museum, 2009a; Li, 2007a).
Figure 3.5. Aerial view of the royal tombs at the site of Yinxu, Henan Province, China (photo from the Yinxu Museum, Anyang, China).
3.4Zhou Dynasty (1046-221 BC)
The state to the west of the Shang, along the Wei River Valleys, was known as the Zhou. King Wu of the Zhou conquered the Shang at the Battle of Muye around 1046 BC and founded the Zhou Dynasty (Li, 2002; Bai, 2010a). The Zhou maintained their old capital, Feng, for the religious and ceremonial significance of its royal temples, but they built a new capital and administration center at the site of Hao, near the present day city of Xi’an (Jun, 2005; Tian, 2009). The Zhou Dynasty lasted until the foundation of the Qin Dynasty in 221 BC. However, the actual political and military control of China by the Zhou court only lasted until 771 BC (Yang, 1999). Historians divided this era into two periods: the Western Zhou (1046-771 BC) and the Eastern Zhou (771-221 BC) (Shaughnessy, 1999; Lee, 2002).
3.4.1Western Zhou (1046-771 BC)
sources from this period are being constantly discovered in the form of inscriptions on bronze vessels and artifacts, some of which are hundreds of characters long, and these provide extensive details about the life and times of the Zhou Dynasty (Figure 3.6) (Zhang, 1983; Rawson, 1999; SACH et al., 2011). The Zhou Kings took the title of Son of Heaven (Tian zi, ), and they legitimized their rule by invoking the “Mandate of Heaven”. This change of perspective had important repercussions on all aspects of society from ceremonies to rituals, and the practice of human sacrifice declined during this period (Zhao and Guo, 2004; Zhang, 2007; Xu, 2012). In contrast to the Shang who had their main seats of political power in modern-day Henan and parts of Shanxi and Hubei Provinces (the so called Central Plains), the main center of the Western Zhou were located in Shaanxi Province (Figure 3.7) (NBCR, 1999; Li, 2007c; Sino Maps Press. 2014a).
Figure 3.7. Map showing the territory of the Zhou Dynasty at approximately 1000 BC (from https://commons.wikimedia.org/wiki/File:Territories_of_Dynasties_in_China.gif#/media/File :Territories_of_Dynasties_in_China.gif).
The state structure of the Zhou was more complex compared to the Shang Dynasty. When they established the Dynasty, the Zhou invested members of the royal family, favored adherents, and allies with the authority to rule over more than 100 separate territories of the conquered land. Later, those hereditary fiefs, so called Zhuhou ( ) became increasingly powerful and independent of the Zhou court (Sima, 2006b; Li, 2007d; Chao, 2016). These subordinate rulers were given ranks that were later systematized into a hierarchic order. During the late Western Zhou period, the Zhou were frequently attacked by the Quanrong barbarians, and were forced to move their capital east to Luoyang in 770 BC. After this move, the Zhou continued to reign nominally for another 500 years even though the court no longer had real military, political, or economic power and authority (Wang, 1994; Li, 2007c). It was during this period that China entered into an age of struggle for hegemony between the great states and feudal lords (Sima, 2006b; Huang, 2015).
3.4.2Eastern Zhou (771-221 BC)
The Eastern Zhou Dynasty is divided into two phases (Li, 1956; Lv, 2009). The early phase is known as the Spring and Autumn period (770-475 BC), which is named for the work: Spring and Autumns Annals (Chunqiu, ), a chronicle of the state Lu (the birthplace of Confucius) between 722 to 481 BC (Gu, 2015). The later phase is called the Warring States period (475-221 BC), and this derives its name from Zhanguoce (Record of the Warring States, ), a historic work compiled in the 1st century BC of the Han Dynasty (Liu, 2007).
During the Eastern Zhou period, the more powerful states began to annex the smaller states, and as the lords gained power, they unlawfully declared themselves to be kings ( ) of their territory (Li, 2007c; 2007d; Feng, 2009; Zuo, 2105). By the 5th century BC, most of the small states had disappeared and only a few larger states were left. In 453 BC, one of the largest states Jin ( ) was split into three parts, which became the states of Han ( ), Zhao ( ), and Wei ( ), and this marks the beginning of the Warring States period (Sima, 2009; Lv, 2011; Zuo, 2001). The main location of the activities and battles during the Spring and Autumn period was on the Yellow River Plain and the Shandong Peninsula as well as the Huai and Han River Valleys (Sino Maps Press. 2014b). The territory eventually expanded to include the present-day Provinces of Shaanxi, Shanxi, Hebei and the Yangzi River Valley in south (Tong, 2009; Qin, 2013; Chen, 2014).
Figure 3.8. Map of the seven major states during Warring States period (from https://commons.wikimedia.org/wiki/File:Territories_of_Dynasties_in_China.gif#/media/File :Territories_of_Dynasties_in_China.gif).
The Eastern Zhou Dynasty is also known as the Golden Age of Chinese philosophy, and a broad range of thoughts and ideas flourished during this period. Confucius (considered the greatest Chinese philosopher and founder of Confucianism), Laozi (founder of Taoism), Mozi (founder of Mohism), Shang Yang and Han Feizi (who developed of ancient Chinese legal system), and many other theorists emerged during this period (Waley, 1994; Confucius, 2006; Yao and Wang, 2015). These thoughts and ideas, known as the Hundred Schools, have profoundly influenced the lifestyle and social consciousness of China as well as the rest of Asia for thousands of years (Lv, 2009; LHPEO, 2011).
considerable advances in productivity (China National Museum, 2009b; Liu, 2010). Large economic projects such as the building of: canals, dams and defensive walls were also completed during this period. For example, the Dujiangyan Dam, which controlled the Min River in Sichuan Province, and the Zhengguo Canal, which irrigated a large area of the Guanzhong Plain, both were implemented by the state of Qin, to increase agricultural output (Li, 1956; Chen, 2002; Ye, 2014).
3.5The First Empire: The Qin Dynasty (221-206 BC)
With advances in political and military organization, the Qin were able to conquer the six other rival states (Li, 2007e; Yang, 2015). The first Emperor, Qin Shi Huang (260-210 BC), successful unified China in 221 BC, and created an Imperial state, which lasted for over 2000 years (Twitchett and Loewe, 2007; Jin, 2012). During his reign, the territory greatly expanded to include: the Gansu and Qinghai Plateaus to the west, modern-day Guangdong and Guangxi Provinces to the south, beyond the Yellow River and the Liaodong Peninsula to the north, and all the way to the ocean in the east (Figure 3.9) (Sino Maps Press, 2014d; Feng, 2015).
uniform system for writing and currency. These changes had the effect of promoting significant political and economic unity through the Empire (Ban, 2007; China National Museum, 2009c).
Figure 3.9. Map of the territory controlled by the Qin Dynasty around 200 BC (from https://commons.wikimedia.org/wiki/File:Territories_of_Dynasties_in_China.gif#/media/File :Territories_of_Dynasties_in_China.gif).
itself has not yet been excavated, various sites surrounding the tomb have been uncovered. The most famous of these discoveries is the Terrcotta Army or Warriors. Over 6000 life-sized and intricately detailed statues equipped with weapons, horses and chariots, which were supposed to protect the Emperor in the afterlife, have been discovered (Figure 3.10) (Yuan, 1986; 2002; Duan, 2011).
Figure 3.10. A) Aerial view of the mausoleum of the first Emperor of China, Qin Shi Huang. B) The Terra Cotta Army that guard the tomb of the first Emperor of China, Qin Shi Huang (photos from the Qin Shi Huang Mausoleum, Xi’an, China).
3.6Dietary Trends in Ancient China
3.6.1Agriculture division between north and south China
Chinese civilization was based on intensive farming (Scarre, 2007; 2013), but geographic boundaries between north and south China have given rise to different agriculture practices as far as back to 5th millennium BC (Wang and Xu, 2003; Liu and Xiang, 2005). The outstanding
Central Plains to empty into Bohai Bay (Figure 3.11) (Zhao, 1995; Wang and Li, 2009; Lv, 2012).
Figure 3.11. Map showing the division between North and South China, as well as, different geographical features.
agriculture was practiced in north China at this time (Figure 3.12) (Sun et al., 1981; Tong, 1984; Qiao and Liu, 2006).
Figure 3.12. A) Neolithic grinding stone and B) millet storage pits from the Cishan, Hebei Province (photos from the Cishan Cultural Sites Museum, Wu’an, China).
site (9000 to 11000 BP) in Zhejiang Province (AIZP and Pujiang Museum, 2007). In modern times, rice is still the preferred crop of the people of southern China. Thus, there has existed a north-south divide in terms of diet in China that goes as far back to the Neolithic period.
3.6.2Reviewing subsistence patterns from the Neolithic to Qin Dynasty
Although the timing and reasons for the transition from hunting and gathering have not been fully elucidated, archaeological evidence from north China (charred millet grains and farming tools) indicates that millet cultivation was practiced at early Neolithic sites such as: Xinglongwa (ca. 8100-7200 BP) in the northeast, Peiligang (ca. 7500-6900 BP) in the central Yellow River Valleys and Laoguantai (ca. 6000-5000 BP) and Dadiwan (7500-6800 BP) in the northwest (Underhill, 1997; Li, 2003; You, 2008). For example, at the Baijia site of the Laoguantai culture (7500-6500 BP) in the Wei River Valley of Shaanxi Province, human diet included millet and probably aquatic foods such as fish and shellfish (IA CASS, 1994). In contrast, at the Jiahu site (ca. 9000-7800 BP) in the southern part of the Yellow River Valleys, rice was found to be an important staple crop (Chen et al., 1995; Zhao and Zhang, 2009). Additional studies have found that dogs and pigs were the focus of animal husbandry practices with pigs likely to have been domesticated by 8000 BP (Lu, 1999; Yuan, 2015). However, due to the fact that numerous remains of butchered wild animals were found at the above mentioned sites, most archaeologists believe that early agriculture was an occasional or temporary activity with hunting and fishing being the dominant subsistence practices during the Middle Neolithic (Yan, 1992; Wang, 2004a).
Archaeological excavations found that millet continued as the primary grain during the terminal Neolithic or Chalcolithic. Foxtail millet was grown more widely in north China, whereas, broomcorn millet seems to have been more abundant in the drier regions, such as the central area of modern-day Henan Province (Lee et al., 2007, You, 2008). Rice and wheat (introduced from the West) have also been found at some Longshan sites in the Provinces of Shandong and southern Henan (Betts et al., 2014; Crawford et al., 2006; Zhao, 2007; Liu and Fang, 2010). For example, at Liangchengzhen, the largest Longshan site so far discovered in Shandong, the researchers found that millet was the primarily crop for animal fodder, whereas, rice increased in importance for human diets (Crawford et al., 2005; Lanehart et al., 2011). Pigs were the most common source of meat for humans, but domestic cattle, sheep and goats were (introduced from the West) also present during this period at sites along the Yellow River Valleys (Cai et al., 2014; Zhang et al., 2013).
During the Shang Dynasty, oracle bone inscriptions and historical texts such as Shi Jing ( ) recorded that foxtail millet was the staple crop for the Shang people (Wang, 1985; Chen, 2007; Wang, 2015b). Recent archaeobotanical evidence shows that wheat was the second most represented crop next to foxtail millet during the Shang period (Zhao, 2009). Although, rice remains have been found at Anyang, they constituted a negligible proportion of the dietary grains. Thus, most scholars believe that rice was a trade good rather than grown locally at the Yinxu site (Tao, 2006; Song, 2011; Wang, 2011a). The variety of animals offered for sacrifice indicated that extensive forms of animal husbandry were practiced. In addition, the raw materials found at the bone workshops of Yinxu came from a variety of different animals including: cattle, sheep, deer, pig, dog and horse. Some of these animals may have been captured by hunting, but it is believed that the majority were bred and domesticated by the Shang people (Song, 1999). In addition, inscriptions on oracle bones mentioned that some officers had names of “Many Dogs” (duo quan, ) or “Many Horses” (duo ma, ) indicating that animal management was part of the duties of some government officials (Liu, 1994; Guo, 2015).
is reputed to be a record of an oral tradition compiled between about 200 and 250 AD (Gu, 2007). Although the identity of the five crops has varied over time, in most pre-Qin works, such as Liji ( ) and Zhouli ( ), the crops mentioned are: foxtail millet ( ), wheat ( ), soybean ( ), broomcorn millet ( ) and hemp ( ). However, in some versions hemp is replaced with rice ( ) (Dai, 2014; Duke of Zhou, 2014). In Qinmin Yaoshu ( ), the famous Chinese book that described agricultural knowledge before the 6th century AD in northern China, it lists: millet, sorghum and beans as the most important in terms of human diet during the pre-Qin period (Jia, 2009). Animal husbandry was significantly developed during the Zhou period. Written records mentioned six kinds of animals such as pig, dog, cattle, sheep/goat, horse and chicken as being very important domestic breeds during the pre-Qin period. They were widely used for food sources, sacrificial or ritual killing and as sources of labor and for military purposes. Further, goose and duck were raised for supplementary food sources (Zuo, 2011; Duke of Zhou, 2014).
3.7Social Stratification in Prehistoric China
It is generally agreed that during the Early Neolithic period that societies were egalitarian and no social hierarchies have been observed (Ren and Wu, 2010). During the Late Neolithic period, the Yangshao culture rapidly increased in population and site size, but many of these sites show little evidence of social differences (Zhang and Wei, 2004). For example, at the Banpo site, the main houses and tombs were both of similar size and shape, suggesting that there were no major social distinctions in the individuals of this community (Lee, 1993). However, some sites do show evidence of emerging social hierarchy. For example, at Xipo in western Henan Province, some families or groups of individuals were buried with valuable objects (cinnabar, jade, etc.), and the large number of pig bones recovered suggests that they were able to hold large feasts (Ma, 2003; Liu, 2004). During the Longshan period, societies became more socially stratified (Liu and Chen, 2012; Pei, 2014). For example, at the Taosi site in southern Shanxi Province the large number of burials, more than a thousand, can be grouped into three classes on the basis of grave goods. The larger sized tombs, approximately 3 meters long and 2-2.7 meters wide contained 100 to 200 grave goods including: painted pottery with dragon designs, alligator drums, jade artifacts, giant chime stones and whole pigs. In contrast, some tombs were narrow pits with very few or no grave goods. It is notable that the majority of the high status burials were males, and it is speculated that this status could have been conferred through heroic acts related to warfare (Yan and He, 2005; Han, 2011). However, such burial differences are mainly present in the areas of Shandong and southern Shanxi Provinces, and this suggests that social stratification varied among regions during the Late Neolithic period (Zhu, 2014).
tombs with ramps; 2. Burials of individuals who followed their tomb owner to their death; some were buried in the chamber of the tomb owners while other were buried in the vicinity of the tomb; 3. Medium size pits; 4. Shallow pits; and 5. Burials in refuse pits and disused wells (Gong and Xu, 2011). Scholars have determined that a hierarchy existed among the sacrificed victims with three groups identified. The first group are individuals that are buried in waist pits (yaokeng, ; below the burial chamber) or in the four corners of the burial chamber.
Figure 3.13. The tomb of Lady Fuhao at the Yinxu site in Henan Province (photo from the Yinxu Museum, Anyang, China).
These individuals are buried with a bronze or jade dagger-axe and were supposed to guard the body of the deceased. The second class of individuals are those that are buried in their own coffins with grave goods, even with their own sacrificed victims or attendant dog, and are believed to be high status relatives, retainers or personal attendants of the deceased. The third type of individuals, were usually young males, between 15 to 35 years old, but some children have also been found. They appear to represent slaves or captured warriors in battle, and they were decapitated or dismembered, and their heads were frequently buried in the pits with their bodies in the ramps (Figure 3.14) (IA CASS, 2007; Tang, 2009).