A beginner’s guide to tissue clearing
Pablo Ariel, Ph.D.
Microscopy Services Laboratory, Department of Pathology and Laboratory Medicine, University of North Carolina at Chapel Hill
Abstract
The last decade has seen a proliferation of tissue clearing methods that render large biological samples transparent and allow unprecedented three-dimensional views of enormous volumes of tissue. For a scientist wondering whether these methods will be useful to address their research problems, it can be bewildering to sort through the ever-increasing number of papers introducing new clearing methods. Here, I provide a concise summary for the novice describing what tissue clearing is, which research problems it can be applied to, how to decide on a clearing method, and where the field is headed in the future.
Keywords
Tissue clearing; optical clearing; whole organ imaging; whole organism imaging; organoids
Introduction - What is tissue clearing?
All tissue clearing methods share the same goal: making large, fixed biological samples transparent. “Large” in this case means thick sections of tissue, whole organoids, entire organs or even entire young rats, ranging in thickness from around 100 μm to several centimeters. Typically, samples of this size are not transparent, and are therefore difficult to analyze using visible wavelengths of light with a microscope. A solution to this problem is to slice a large piece of biological tissue into thin (around 10 μm) sections and analyze the slices with a microscope. However, slicing is labor-intensive for large samples, and
reconstructing information from adjacent slices into a three-dimensional view of the tissue is extremely time-consuming and difficult. Other possible approaches are confocal or
multiphoton microscopy on thicker tissue slices, though imaging quality deteriorates when focusing deep into a sample, becoming limiting at around a hundred and several hundred microns respectively. Tissue clearing represents a different approach: a series of chemical steps that render a large sample transparent.
To understand how tissue clearing works, it is necessary to understand why most tissues are not transparent. Any biological sample will be composed mostly of water, embedded in
HHS Public Access
Author manuscript
Int J Biochem Cell Biol
. Author manuscript; available in PMC 2018 March 01.Published in final edited form as:
Int J Biochem Cell Biol. 2017 March ; 84: 35–39. doi:10.1016/j.biocel.2016.12.009.
A
uthor Man
uscr
ipt
A
uthor Man
uscr
ipt
A
uthor Man
uscr
ipt
A
uthor Man
uscr
structures formed by lipids and proteins; all of these components will vary in how they interact with light propagating through the tissue. Among the properties that differ between these components is their refractive index (RI, how much slower light propagates through a given substance compared to a vacuum). When a material contains a mix of components of small size with different RIs, the interactions of light with these heterogeneous components lead to a lack of transparency (see Richardson and Lichtman, 2015, for an excellent, comprehensive review of this topic). All tissue clearing methods seek transparency through the same general strategy: they try to homogenize the RI of a sample by removing, replacing and modifying some of its components.
Will tissue clearing facilitate my research?
If the objects of interest are microscopic, but extend over macroscopic distances, tissue clearing can be very beneficial. An extreme example of such a problem is tracing axons (as small as 0.2 μm in diameter) through mouse brains, which can be many millimeters in diameter. It is worth noting that studies on samples this large require microscopes that are not yet widespread (based on light-sheet illumination), specialized and expensive objectives with long working distances, expensive lasers that emit infrared light (which can penetrate farther into tissue and is used in multiphoton microscopes), long imaging times, handling extremely large data sets (tens to hundreds of gigabytes) or all of the above. Despite these challenges, tissue clearing is an attractive option; the main alternative to accurately study objects in very large samples is to use a set of rigorous stereological sampling techniques on slices, which can be very laborious and time consuming.
Studies using very large samples are not the only ones that would benefit from tissue-clearing. There are many interesting biological problems that can be modeled in organoids or in thick slabs of tissue, with sizes on the order of a few hundred microns. Incorporating a tissue clearing step in standard immunostaining protocols would open the door to routine high-resolution imaging a few hundred microns deep into samples with confocal
microscopes and objectives that are commonly available in research environments around the world. This could have a dramatic and immediate impact on many fields and does not require any specialized equipment.
Moreover, at an even smaller length scale, various forms of superresolution imaging can be coupled with clearing, dramatically extending the applicability of those techniques from only a few cell layers to much thicker tissue slices (Ke et al., 2016).
In short, if you care about the biology of objects that are microscopic but extend more than a few tens of microns inside biological tissue, you should consider tissue clearing.
How do I decide which tissue clearing method is optimal for my research?
Determining the best method for a given application is difficult due to the proliferation of new techniques involving tradeoffs between speed, cost, complexity, conservation of protein-based fluorescence, compatibility with immunostaining, and other criteria. I will highlight methods compatible with the study of proteins in large samples of animal tissue, particularly those that have been used successfully in follow-up studies. The large number of methods
A
uthor Man
uscr
ipt
A
uthor Man
uscr
ipt
A
uthor Man
uscr
ipt
A
uthor Man
uscr
(Tainaka et al., 2016; Treweek and Gradinaru, 2016) can be grouped into a few families based on the chemistry used for the clearing (Richardson and Lichtman, 2015; Silvestri et al., 2016).
Organic solvents
These methods dehydrate samples, extract lipids and homogenize the RI to a high value (around 1.55, presumably matching the RI of remaining proteinaceous structures). Among the main advantages of these methods are the quality and speed of the clearing. The latter is particularly useful when combining immunostaining with the clearing, since full penetration of antibodies into very large samples typically takes a few weeks (though new techniques can dramatically speed up immunostaining, see below). Thus, fast clearing helps keep experiments within a reasonable time frame. The main disadvantage for most applications is the use of toxic and/or corrosive chemicals that require special objectives or sealing the sample to avoid damage to the microscope. Another fundamental limitation is that because lipids are removed, no direct lipid staining is possible. While initial versions of these methods had problems with the preservation of protein-based fluorescence beyond a few days, there are at least three examples of more recent protocols that have extended to several months the amount of time the fluorescent proteins can be imaged after clearing:
FluoClearBABB (Schwarz et al., 2015), uDISCO (Pan et al., 2016), and embedding of a DBE-cleared sample into a resin (Becker et al., 2014). Another common disadvantage mentioned when discussing these methods is sample shrinkage, though recent improvements have either solved this issue (iDISCO+ (Renier et al., 2016)) or turned it into an advantage for specific applications that require the imaging of very large samples, like entire adult mice or young rats (uDISCO, Figure 1 (Pan et al., 2016)). Some examples of successful
applications of organic solvent-based clearing include analysis of vasculature and drug delivery in tumors (BABB (Dobosz et al., 2014)), automated mapping of mouse brain activity at the cellular level (iDISCO+ (Renier et al., 2016)) and automated quantification of amyloid plaques in old mouse brains (iDISCO+ (Liebmann et al., 2016)).
High RI aqueous solutions
These methods immerse the sample in aqueous solutions that have RIs in the 1.44–1.52 range, matching the average RI of most tissues. The main advantages of this family of methods are technical simplicity and lipid-preservation (making them compatible with lipid stains). The disadvantage is that clearing is prohibitively slow and not as effective for big samples. As a result, methods in this category are mainly used to clear small samples, such as slabs of tissue, organoids, or insects. Successful applications include imaging neural spheres 100 μm in diameter (ClearT2, (Boutin and Hoffman-Kim, 2015)) and slabs of brains 1–2 mm thick (TDE immersion, (Aoyagi et al., 2015; Costantini et al., 2015)). While there are commercial options in this family of methods (FocusClear, RapiClear), they are extremely expensive. An exciting new method in this family is SeeDB2 (Ke et al., 2016), which has been used for superresolution imaging of neurons 100 μm deep in brain slices (Figure 2).
A
uthor Man
uscr
ipt
A
uthor Man
uscr
ipt
A
uthor Man
uscr
ipt
A
uthor Man
uscr
Hyperhydrating solutions
There is some uncertainty regarding the exact chemical basis for these methods, but the proposed mechanism is that they remove lipids using detergents, high concentrations of urea, and a final solution with a RI in the 1.38–1.48 range. The different versions of the CUBIC and Scale methods are typically grouped into this family. The main advantages of CUBIC are its simplicity, good clearing performance and the preservation of fluorescent proteins (Susaki et al., 2015). The main disadvantage is that clearing can take several weeks for large samples. Thus, while the method is compatible with immunostaining, the
combination of long clearing times, added to the long incubations required for standard antibody penetration techniques may render it impractical. In addition, CUBIC’s clearing performance deep in large samples is worse than methods based on organic solvents or hydrogel embedding (Stefaniuk et al., 2016; Tainaka et al., 2016). The original version of the Scale method (which was extremely slow) has recently been superseded by ScaleS, which is faster, avoids tissue expansion and preserves lipids such that lipid staining is possible (Hama et al., 2015). Examples of applications of these methods include mapping progenitors during heart morphogenesis (CUBIC (Chabab et al., 2016)), studying interneurons during brain development (CUBIC (Calvigioni et al., 2016)) and visualizing amyloid beta plaques in brains from 18-month old mice (ScaleS (Hama et al., 2015)).
Hydrogel embedding
These methods stabilize proteins in the sample by cross-linking them to a hydrogel, extracting lipids with detergents, and then immersing the samples in a solution with an RI between 1.38–1.45. The main advantages of these methods are their excellent clearing performance and compatibility with protein-based fluorophores. The main disadvantage is that the clearing is either slow, or—if faster clearing is desired—more difficult to implement than simple solution exchanges, instead requiring custom electrophoresis equipment (Kim et al., 2015; Lee et al., 2016), constant perfusion (Treweek et al., 2015) or high temperatures (Murray et al., 2015). In addition, the RI-matching solutions with the best reported performance (FocusClear, RIMS) are expensive. The founder of this family of methods is CLARITY (Chung et al., 2013; Tomer et al., 2014; Ye et al., 2016), which has been modified by other labs to yield, among others, PACT-PARS (which reduces cost and increases speed of clearing using constant perfusion (Treweek et al., 2015)), ACT (which speeds up clearing with custom electrophoresis equipment (Lee et al., 2016)), and SWITCH (which accelerates clearing using high temperatures (Murray et al., 2015)). These methods have been applied successfully to map brain-wide activity and neural projections (CLARITY (Ye et al., 2016)), visualize Mycobacterium tuberculosis infections deep in whole lungs (PACT (Cronan et al., 2015)), and can even be used to clear bones (PACT-deCAL (Treweek et al., 2015)).
Faced with this many options, a few key questions are important:
How large is the sample?—If the biology of interest happens in a region that is smaller than an entire animal or organ, it is faster and cheaper to stain and clear only that portion. Smaller samples can also be imaged more easily and quickly, particularly at high resolution. A reasonable starting point for samples less than a millimeter thick is one of the high RI
A
uthor Man
uscr
ipt
A
uthor Man
uscr
ipt
A
uthor Man
uscr
ipt
A
uthor Man
uscr
aqueous solutions or a hyperhydrating solution. To decide among these, the main considerations are cost (the commercial solutions are very expensive), and whether the method in question has been applied to a similar tissue or biological problem.
On the other end of the spectrum, if the sample is extremely large (i.e., the size of a whole adult mouse), three methods have been specifically optimized for these conditions: whole-body CUBIC, PARS and uDISCO. To decide between these, two important considerations will be speed (highest for uDISCO) and the compatibility of the imaging system with organic solvents (required for uDISCO). Note that imaging such large samples will require specialized equipment and very long acquisition times.
For samples in between the two size extremes, there are many other options, and other factors must be considered.
Is lipid staining critical to the research question?—If so, this can significantly restrict the number of options. ScaleS and SWITCH are the only methods that clear large samples well in a reasonable amount of time while preserving lipids. As a result, they are the main options when it is necessary to use a dye that is itself a lipid to stain other lipids in the sample. To use other clearing methods, a possibility is to stain lipids indirectly, by
trafficking a protein marker to them or by immunostaining for a molecule that localizes in the region of interest. These markers will remain after the lipid extraction steps in many of the clearing methods.
Is immunostaining needed to address the biological question?—There are many animal models and viruses that express fluorescent proteins for which immunostaining might not be strictly necessary, saving time and resources. However, if there are no models based on fluorescent proteins for the biology of interest, immunostaining will be
unavoidable, and an appropriate tissue clearing method will be needed.
Even when models that express fluorescent proteins exist or are easy to procure, subsequent immunostaining of those fluorescent proteins can be very advantageous. This will amplify signals of inherently weak and photolabile fluorescent proteins (like CFP), and replace them with fluorophores that are brighter, more photostabile (like AlexaFluor dyes), and more abundant at target sites (due to the multiplicative effect of secondary antibody staining). Immunostaining fluorescent proteins may be necessary in more cases than what one would conclude from perusing the clearing literature. Many papers show results obtained from mice expressing GFP or YFP under the Thy1 promoter in the brain, which is characterized by very high levels of expression in sparse neuronal populations in the brain; a best case scenario that may not always apply.
Another underappreciated advantage of immunostaining is that it can be used to spectrally shift the fluorescent signal from the blue/green to the red/far red region of the spectrum (for example, by staining GFP with AlexaFluor 647), which is much less autofluorescent. Interestingly, autofluorescence in mouse brains in the green region of the spectrum is so high that recent papers have cleverly taken advantage of it for annotating brain regions (Renier et
A
uthor Man
uscr
ipt
A
uthor Man
uscr
ipt
A
uthor Man
uscr
ipt
A
uthor Man
uscr
al., 2016; Ye et al., 2016). This may be a good reason to leave the blue/green region of the spectrum “open” for anatomical annotation using autofluorescence.
In summary, for many applications that are based on expressing fluorescent proteins (particularly GFP), antibody amplification and spectral shifting of the signal may be critical for obtaining good results.
While staining fluorescent proteins can be worthwhile, in some cases it is not possible. Because CFP, GFP and YFP are all derived from the same jellyfish protein backbone, there are no antibodies that can distinguish between them. Thus for samples with combinations of these proteins (like confetti mice, Snippert et al., 2010), immunostaining will not allow separation of the fluorophores.
Of course, antibody staining is not without its tradeoffs. In large samples it is very slow, and speeding up the process significantly requires specialized equipment (to rotate the
electrophoretic field in the stochastic electrotransport approach (Kim et al., 2015), or to increase pressure in the ACT-PRESTO technique (Lee et al., 2016)). At present, the iDISCO + and ACT protocols are good candidates due to their fast clearing actions, and because they have been shown to be compatible with many antibodies (over 30 and 70 respectively). Unfortunately, iDISCO+ requires sealing the sample carefully or using specialized objectives that are resistant to organic solvents, while ACT requires specialized electrophoresis equipment for fast clearing.
What can we expect in the future?
A common thread running through all methods used to study large samples is that they are slow to clear tissue, to immunostain it, or both. Some promising recent developments involve techniques that dramatically accelerate antibody penetration into large samples (ACT-PRESTO, stochastic electrotransport) or the clearing process itself (ACT, SWITCH). Standardization and commercialization of the equipment needed for these newer techniques would benefit many labs. Another avenue worth exploring to speed up staining is replacing antibodies with Fab fragments or nanobodies, which are smaller and could diffuse faster into tissue (Li et al., 2015). For techniques based on organic solvents, a major improvement would be a more widespread availability of compatible, solvent-resistant objectives that can be matched to the high RI of these samples. The speed at which protocols are being improved makes an online presence from the developing labs very useful for new users, particularly if they include detailed protocols, recommendations, frequently asked questions and platforms for user feedback and interaction (see Table 1). Based on the advances over the last decade, the desire to study biological processes in three dimensions in thick samples will likely spur these and other improvements to clearing protocols in the future.
Acknowledgments
I thank M.V. Cattani, D. Presman, K. White and V. Madden for critical reading of this manuscript.
A
uthor Man
uscr
ipt
A
uthor Man
uscr
ipt
A
uthor Man
uscr
ipt
A
uthor Man
uscr
References
Aoyagi Y, Kawakami R, Osanai H, Hibi T, Nemoto T. A Rapid Optical Clearing Protocol Using 2,2′ -Thiodiethanol for Microscopic Observation of Fixed Mouse Brain. PLoS ONE. 2015;
10(1):e0116280. [PubMed: 25633541]
Becker K, Hahn CM, Saghafi S, Jahrling N, Wanis M, Dodt HU. Reduction of photo bleaching and long term archiving of chemically cleared GFP-expressing mouse brains. PLoS One. 2014; 9(12):e114149. [PubMed: 25463047]
Boutin ME, Hoffman-Kim D. Application and assessment of optical clearing methods for imaging of tissue-engineered neural stem cell spheres. Tissue Eng Part C Methods. 2015; 21(3):292–302. [PubMed: 25128373]
Calvigioni D, Mate Z, Fuzik J, Girach F, Zhang MD, Varro A, Beiersdorf J, Schwindling C, Yanagawa Y, Dockray GJ, McBain CJ, Hokfelt T, Szabo G, Keimpema E, Harkany T. Functional
Differentiation of Cholecystokinin-Containing Interneurons Destined for the Cerebral Cortex. Cereb Cortex. 2016
Chabab S, Lescroart F, Rulands S, Mathiah N, Simons BD, Blanpain C. Uncovering the Number and Clonal Dynamics of Mesp1 Progenitors during Heart Morphogenesis. Cell Rep. 2016; 14(1):1–10. [PubMed: 26725109]
Chung K, Wallace J, Kim SY, Kalyanasundaram S, Andalman AS, Davidson TJ, Mirzabekov JJ, Zalocusky KA, Mattis J, Denisin AK, Pak S, Bernstein H, Ramakrishnan C, Grosenick L, Gradinaru V, Deisseroth K. Structural and molecular interrogation of intact biological systems. Nature. 2013; 497(7449):332–337. [PubMed: 23575631]
Costantini I, Ghobril JP, Di Giovanna AP, Allegra Mascaro AL, Silvestri L, Mullenbroich MC, Onofri L, Conti V, Vanzi F, Sacconi L, Guerrini R, Markram H, Iannello G, Pavone FS. A versatile clearing agent for multi-modal brain imaging. Sci Rep. 2015; 5:9808. [PubMed: 25950610]
Cronan MR, Rosenberg AF, Oehlers SH, Saelens JW, Sisk DM, Jurcic Smith KL, Lee S, Tobin DM. CLARITY and PACT-based imaging of adult zebrafish and mouse for whole-animal analysis of infections. Dis Model Mech. 2015; 8(12):1643–1650. [PubMed: 26449262]
Dobosz M, Ntziachristos V, Scheuer W, Strobel S. Multispectral fluorescence ultramicroscopy: three-dimensional visualization and automatic quantification of tumor morphology, drug penetration, and antiangiogenic treatment response. Neoplasia. 2014; 16(1):1–13. [PubMed: 24563615]
Hama H, Hioki H, Namiki K, Hoshida T, Kurokawa H, Ishidate F, Kaneko T, Akagi T, Saito T, Saido T, Miyawaki A. ScaleS: an optical clearing palette for biological imaging. Nat Neurosci. 2015; 18(10):1518–1529. [PubMed: 26368944]
Ke MT, Nakai Y, Fujimoto S, Takayama R, Yoshida S, Kitajima TS, Sato M, Imai T. Super-Resolution Mapping of Neuronal Circuitry With an Index-Optimized Clearing Agent. Cell Rep. 2016; 14(11): 2718–2732. [PubMed: 26972009]
Kim SY, Cho JH, Murray E, Bakh N, Choi H, Ohn K, Ruelas L, Hubbert A, McCue M, Vassallo SL, Keller PJ, Chung K. Stochastic electrotransport selectively enhances the transport of highly electromobile molecules. Proc Natl Acad Sci U S A. 2015; 112(46):E6274–6283. [PubMed: 26578787]
Lee E, Choi J, Jo Y, Kim JY, Jang YJ, Lee HM, Kim SY, Lee HJ, Cho K, Jung N, Hur EM, Jeong SJ, Moon C, Choe Y, Rhyu IJ, Kim H, Sun W. ACT-PRESTO: Rapid and consistent tissue clearing and labeling method for 3-dimensional (3D) imaging. Sci Rep. 2016; 6:18631. [PubMed: 26750588]
Li J, Czajkowsky DM, Li X, Shao Z. Fast immuno-labeling by electrophoretically driven infiltration for intact tissue imaging. Sci Rep. 2015; 5:10640. [PubMed: 26013317]
Liebmann T, Renier N, Bettayeb K, Greengard P, Tessier-Lavigne M, Flajolet M. Three-Dimensional Study of Alzheimer’s Disease Hallmarks Using the iDISCO Clearing Method. Cell Rep. 2016; 16(4):1138–1152. [PubMed: 27425620]
Murray E, Cho JH, Goodwin D, Ku T, Swaney J, Kim SY, Choi H, Park YG, Park JY, Hubbert A, McCue M, Vassallo S, Bakh N, Frosch MP, Wedeen VJ, Seung HS, Chung K. Simple, Scalable Proteomic Imaging for High-Dimensional Profiling of Intact Systems. Cell. 2015; 163(6):1500– 1514. [PubMed: 26638076]
A
uthor Man
uscr
ipt
A
uthor Man
uscr
ipt
A
uthor Man
uscr
ipt
A
uthor Man
uscr
Pan C, Cai R, Quacquarelli FP, Ghasemigharagoz A, Lourbopoulos A, Matryba P, Plesnila N,
Dichgans M, Hellal F, Erturk A. Shrinkage-mediated imaging of entire organs and organisms using uDISCO. Nat Methods. 2016
Renier N, Adams EL, Kirst C, Wu Z, Azevedo R, Kohl J, Autry AE, Kadiri L, Umadevi Venkataraju K, Zhou Y, Wang VX, Tang CY, Olsen O, Dulac C, Osten P, Tessier-Lavigne M. Mapping of Brain Activity by Automated Volume Analysis of Immediate Early Genes. Cell. 2016; 165(7):1789– 1802. [PubMed: 27238021]
Richardson DS, Lichtman JW. Clarifying Tissue Clearing. Cell. 2015; 162(2):246–257. [PubMed: 26186186]
Schwarz MK, Scherbarth A, Sprengel R, Engelhardt J, Theer P, Giese G. Fluorescent-protein stabilization and high-resolution imaging of cleared, intact mouse brains. PLoS One. 2015; 10(5):e0124650. [PubMed: 25993380]
Silvestri L, Costantini I, Sacconi L, Pavone FS. Clearing of fixed tissue: a review from a microscopist’s perspective. J Biomed Opt. 2016; 21(8):081205. [PubMed: 27020691] Snippert HJ, van der Flier LG, Sato T, van Es JH, van den Born M, Kroon-Veenboer C, Barker N,
Klein AM, van Rheenen J, Simons BD, Clevers H. Intestinal crypt homeostasis results from neutral competition between symmetrically dividing Lgr5 stem cells. Cell. 2010; 143(1):134–144. [PubMed: 20887898]
Stefaniuk M, Gualda EJ, Pawlowska M, Legutko D, Matryba P, Koza P, Konopka W, Owczarek D, Wawrzyniak M, Loza-Alvarez P, Kaczmarek L. Light-sheet microscopy imaging of a whole cleared rat brain with Thy1-GFP transgene. Sci Rep. 2016; 6:28209. [PubMed: 27312902] Susaki EA, Tainaka K, Perrin D, Yukinaga H, Kuno A, Ueda HR. Advanced CUBIC protocols for
whole-brain and whole-body clearing and imaging. Nat Protoc. 2015; 10(11):1709–1727. [PubMed: 26448360]
Tainaka K, Kuno A, Kubota SI, Murakami T, Ueda HR. Chemical Principles in Tissue Clearing and Staining Protocols for Whole-Body Cell Profiling. Annu Rev Cell Dev Biol. 2016
Tomer R, Ye L, Hsueh B, Deisseroth K. Advanced CLARITY for rapid and high-resolution imaging of intact tissues. Nat Protoc. 2014; 9(7):1682–1697. [PubMed: 24945384]
Treweek JB, Chan KY, Flytzanis NC, Yang B, Deverman BE, Greenbaum A, Lignell A, Xiao C, Cai L, Ladinsky MS, Bjorkman PJ, Fowlkes CC, Gradinaru V. Whole-body tissue stabilization and selective extractions via tissue-hydrogel hybrids for high-resolution intact circuit mapping and phenotyping. Nat Protoc. 2015; 10(11):1860–1896. [PubMed: 26492141]
Treweek JB, Gradinaru V. Extracting structural and functional features of widely distributed biological circuits with single cell resolution via tissue clearing and delivery vectors. Curr Opin Biotechnol. 2016; 40:193–207. [PubMed: 27393829]
Ye L, Allen WE, Thompson KR, Tian Q, Hsueh B, Ramakrishnan C, Wang AC, Jennings JH, Adhikari A, Halpern CH, Witten IB, Barth AL, Luo L, McNab JA, Deisseroth K. Wiring and Molecular Features of Prefrontal Ensembles Representing Distinct Experiences. Cell. 2016; 165(7):1776– 1788. [PubMed: 27238022]
A
uthor Man
uscr
ipt
A
uthor Man
uscr
ipt
A
uthor Man
uscr
ipt
A
uthor Man
uscr
Facts
• Tissue clearing allows imaging many millimeters deep in fixed tissue.
• Any research project using fixed samples more than a few tens of microns
thick can benefit from applying tissue clearing, ranging from thick tissue slabs and organoids to entire young rats.
• Deciding between available methods requires careful evaluation of many
parameters, but the main three are sample size, the need for lipid staining and the need for immunostaining
A
uthor Man
uscr
ipt
A
uthor Man
uscr
ipt
A
uthor Man
uscr
ipt
A
uthor Man
uscr
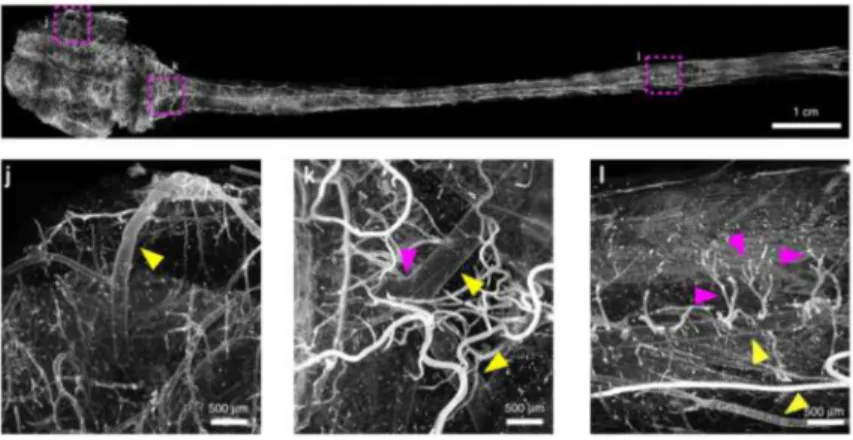
Figure 1. Young rat central nervous system - uDISCO technique
An example of a very large sample imaged after tissue clearing. The central nervous system of a young rat was stained with a dye that labels the vasculature and cleared with the uDISCO technique, which uses organic solvents. The image is a composite of many images acquired with a light-sheet microscope. Insets show magnified views of subareas of the sample and arrowheads point to specific identifiable blood vessels. Modified from Pan et al., 2016.
A
uthor Man
uscr
ipt
A
uthor Man
uscr
ipt
A
uthor Man
uscr
ipt
A
uthor Man
uscr
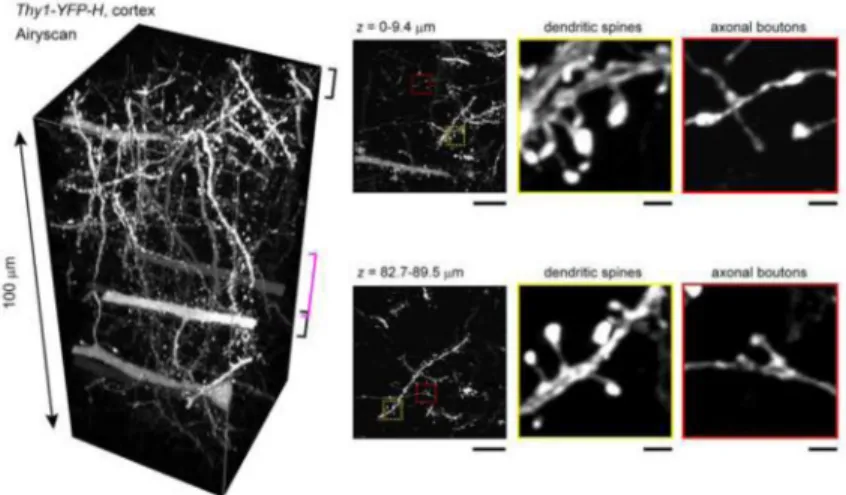
Figure 2. 100 μm slice of mouse brain - See DB2 technique
An example of a small sample that benefits from tissue clearing. A 100 μm slice of brain tissue where a subset of neurons strongly express YFP was cleared with the SeeDB2 method, which is based on a high RI aqueous solution. This sample was imaged using Airyscan superresolution confocal microscopy. Note that very fine details can be discerned deep in the sample. Modified from Ke et al., 2016.
A
uthor Man
uscr
ipt
A
uthor Man
uscr
ipt
A
uthor Man
uscr
ipt
A
uthor Man
uscr
A
uthor Man
uscr
ipt
A
uthor Man
uscr
ipt
A
uthor Man
uscr
ipt
A
uthor Man
uscr
ipt
T ab le 1Online resources for tissue clearing
T echnique Link T ype of method Site content iDISCO+ https://idisco.info/ Or g anic solv ents
Updated protocol, recommendations,
F A Q, v alidated antibodies. SeeDB2 https://sites.google.com/site/seedbresources/
High-RI aqueous solution
Updated protocol, recommendations.
CUBIC http://cubic.rik en.jp/ Hyperh ydrating solutions Updated protocol. CLARITY W iki: http://wiki.claritytechniques.or g/inde x.php/Main_P ageF orum : http://forum.claritytechniques.or g/ Hydrogel embedding
Updated protocol, recommendations, troubleshooting advice, acti
v e user forum. SWITCH http://www .chunglabresources.com/sw1/ Hydrogel embedding
Updated protocol, recommendations.
Stochastic electr
otransport
http://www
.chunglabresources.com/se1
Hydrogel embedding