The Journal of Nutrition
Community and International Nutrition
Snacking Is Longitudinally Associated with
Declines in Body Mass Index
z
Scores for
Overweight Children, but Increases for
Underweight Children
1–3
Lindsey Smith Taillie,4Dantong Wang,5and Barry M Popkin4*
4Department of Nutrition, University of North Carolina, Chapel Hill, NC; and5Nestl´e Research Center, Lausanne, Switzerland
Abstract
Background:Few studies, to our knowledge, have examined the longitudinal association of snacking with child body mass index (BMI), especially in China, where the incidence of overweight and obesity has increased rapidly.
Objectives:Our objective was to examine the longitudinal association between snacking and BMIzscore and to test whether this association differs by baseline weight status.
Methods:Using data from the China Health and Nutrition Survey (2006, 2009, and 2011), we characterized snack intake for 9 provinces and 3 megacities. We used linear mixed-effects models to examine longitudinally the association between
snacking (none, low, medium, and high tertiles according to energy) and BMIzscore in children aged 2–13 y at baseline,
controlling for sex, urbanicity, parental education, physical activity, and foods consumed at meals (n= 2277 observations).
We tested whether this association differed by baseline underweight, normal weight, or overweight/obese.
Results:Snacking is prevalent in Chinese children, with fruit being the most common snack. Snacking was not associated with meaningful BMIzscore changes in normal-weight children. However, in children who were underweight at baseline,
snacking in the top tertiles was associated with increases in BMIzscores from 2006 to 2011 (+1.2 and +1.1 BMIzscore
units for ages 2–6 and 7–13 y, respectively) (P< 0.05). In overweight/obese 2- to 6-y-old children at baseline, being in the
lowest snacking tertile was associated with declines in BMIzscore (23.3), whereas in overweight 7- to 13-y-old children,
being in the top tertile of snacking was associated with the greatest decline in BMIzscore (22.1) (P< 0.05). The direction
and magnitude of associations did not vary regardless of adjustment for total energy intake.
Conclusions:Snacking in China, dominated by fruit consumption, is associated with decreased BMI in overweight/obese children and increased BMI in underweight children. More work will be needed to monitor this relation as Chinese diets
continue to westernize. J Nutr2016;146:1268–75.
Keywords: snacking, China, children, adolescent, overweight, obesity, diet, underweight, BMIzscore
Introduction
In China, childhood obesity now poses a substantial concern (1). In fact, from 1989 to 2004, the relative increase in overweight was higher in children than adults when baseline weight was taken into account (2). In 2011, 10% of 2- to 6-y-old children were overweight and 12% were obese, with 13% and 6% of 7- to 11-y-old children overweight and obese, respectively (3). At the same time, however, 19% and 22% of 2- to 6-y-old and 7- to 11-y-old
children were underweight, indicating a ‘‘double burden’’ of coexis-tent underweight and overweight/obesity in Chinese children (4). Yet, to date, there is minimal epidemiologic literature on factors related to changes in body weight in Chinese children.
Possible drivers of the body weight increase include dramatic declines in child physical activity (5, 6), as well as increasing concern about overfeeding of the doted-upon solitary child in 1-child families (7), although empirical evidence on the latter is limited (8). In recent decades, and accelerating in the last 10 y (9), diets have become increasingly westernized, and have included increased animal-source foods and high-fat, processed, and fried foods (9–11). With regards to behavior, despite being relatively uncommon only a decade ago, snacking has become increasingly prevalent: in 2004, only 28% of 2- to 6-y-old children and 19% of 7- to 12-y-old children ate between meals, whereas snacking 1
This work was funded by the Nestl ´e Research Center, Lausanne, Switzerland. LST and BMP were supported by the Carolina Population Center (R24HD050924). 2
Author disclosures: LS Taillie, D Wang, and BM Popkin, no conflicts of interest. 3
Supplemental Tables 1 and 2 are available from the ‘‘Online Supporting Material’’ link in the online posting of the article and from the same link in the online table of contents at http://jn.nutrition.org.
*To whom correspondence should be addressed. E-mail: [email protected].
ã2016 American Society for Nutrition.
increased to 59% and 54%, respectively, in 2009 (12). This increase in snacking reflects an overall global trend, marked by increased eating frequency (13).
Globally, urbanization has been a major driver of shifts in diet, activity, and obesity (14–16). However, it is unclear whether ChinaÕs megacities are somehow different with regard to dietary behaviors and body weight. Previous work looking specifically at snacking found that snacking is more prevalent in urban areas (10, 12), but no work has examined whether the energy contribution or type of snack differs for ChinaÕs 3 megacities, Shanghai, Beijing, and Chongqing, which were only added to the China Health and Nutrition Survey in 2011. These cities have experienced much greater penetration of the modern retail food sector and modern mass media marketing of processed food (11, 17, 18).
More important to understand is whether this trend toward snacking contributes to changes in BMI in Chinese children. In China, one study of children and adolescents in rural northwest China found that consuming snacks $4 times/wk was more common in normal-weight children than in obese children, but this study was cross-sectional and did not control for other potential factors, such as diet quality (19). In the United States and Europe, the evidence for the link between snacking and weight is mixed: despite evidence that increased eating fre-quency is linked to increased total daily energy intake (20–22), some studies have found no link between meal patterns, snacking, and overweight status (23–25), whereas others have found that increased snacking is positively associated with overweight (26–28). An additional (albeit cross-sectional) study of US teenaged children found that overweight and obesity actually decreased with increased snacking (29), and studies of European children aged 5–16 y also have found that more frequent eating has been linked to reduced adiposity (30) and decreased risk of overweight (31). The association between snacking and weight status could depend on its effect on total energy across the day: although both the energy density and increased portion sizes of snacks can contribute to excess energy intake (32, 33), other work (in adults) suggests that snacking could improve appetite control and promote energy regulation (34, 35). To our knowledge, no work in China has examined longitu-dinally the relation between snacking and BMIzscore in children, despite the concomitant increase in both snacking and over-weight. This relation depends in part on the type of foods children consume as snacks: whereas snacks tend to be foods and bev-erages high in added sugars and fats in Western countries and South America, in China, previous work has shown fruit to be a top contributor to snacks (12).
The objectives of this study were the following:1) to look descriptively at the types of snacks children aged 2–12 y con-sumed from 2006 to 2011 and examine whether types of snacks differed for megacities in 2011, and 2) to examine longitudinally whether snacking was associated with a higher BMIzscore in children aged 2–12 y, as well as whether the relation between snacking and BMI was modified by weight status at baseline.
Methods
Survey methodology. The methodology of the China Health and Nutrition Survey has been described previously (36, 37). In brief, the original survey in 1989 used a multistage random cluster design such that within each province, cities and counties were selected on income, communities were selected based on urbanicity, and households were randomly selected for participation. For this study, data were from
waves collected in 9 provinces in 2006, 2009, and 2011 (hereafter referred to as ‘‘provinces’’). In 2011, 3 autonomous cities, Beijing, Shanghai, and Chongqing, were added to represent ChinaÕs megacities, major cities that have developed over time and have;20–30 million residents. Because these cities were included in the survey only in 2011, they were included here separately for descriptive, cross-sectional analyses and excluded from the longitudinal analyses. For the cross-sectional analyses, the sample was composed of all children with diet measurements in provinces (2006,n= 1134; 2009,n= 1202; and 2011, n= 1047) and megacities (2011,n= 363).
For the longitudinal analyses, we included any child whose age was 2–13 y in 2006, who participated in the survey in 2006 or 2009, and who had$1 up visit (2009, 2011, or both) (54% had 2 follow-up visits and 46% had 3 follow-follow-up visits). We then excluded children with missing BMI (n= 237), for a final analytic sample of 964 children with 2277 observations.
Anthropometric data.Anthropometric data were collected on every household member at each visit. Height was measured without shoes to the nearest 0.2 cm with the use of a Seca stadiometer. Weight was measured without shoes and in light clothing to the nearest 0.1 kg with the use of a calibrated beam scale. To examine changes in weight status, we used age- and sex-adjusted BMIz scores (38). We also classified children as underweight or overweight/obese at baseline (2006 or 2009) by using the cutoffs established by the International Obesity Task Force (39, 40), which provides age- and sex-specific cutoffs for children.
Dietary intake data. The methods for collecting household and individual dietary intake data have been described extensively (9). In brief, dietary data were collected over 3 consecutive days with the use of both household inventories of all ingredients, as well as 3 consecutive 24-h dietary recalls. For children <10 y of age, the primary caretaker reported.
The latest Chinese food composition table was used to calculate energy intake (41). To provide comparability to US studies on snacking, the USDA food grouping system was used to classify food groups (42). Fruit included whole fruit (fresh, frozen, dried, and canned).
In this study, a snack referred to any food or drink consumed outside of the 3 main meals (breakfast, lunch, and dinner), whereas a snacker referred to anyone who consumed $1 snack during the 3-d dietary recall. For the longitudinal analysis, children were grouped by age group (2–6 compared with 7–13 y of age) into nonsnackers or into tertiles based on absolute calories consumed from snacks (Supplemental Table 1). Children consumed;40, 125, and 350 kcal/d in the first, second, and third tertiles, respectively.
Statistical analysis.All analyses were conducted with the use of Stata version 13.
For provinces, the sample was treated initially as a repeated cross-section, with differences in the sociodemographic composition exam-ined in 2009 and 2011 compared with 2006, with the use ofttests for continuous variables and chi-square tests for categorical variables. Cross-sectional sociodemographic differences between megacities and all other regions in 2011 also were examined. Sociodemographic characteristics included the age and sex of the child, household income (adjusted for inflation), maximum parental education (less than secondary school, graduated from secondary school, and some college or greater), and a continuous measure of urbanicity (43). Physical activity was assessed via questionnaire, and metabolic equivalent tasks were calculated. We then described the percentage of snackers, percentage of consumers of snack food groups, and mean per-consumer daily calories from snacks across time and between megacities and all other regions in 2011.
presumably thereby affecting weight change. Snacking was included in models as an indicator variable for nonsnacker and each tertile of snacker. We tested whether snacking influenced BMIzscore over time by including an interaction term for snacking and time. We also tested whether the association between snacking and BMIzscore was different for underweight compared with normal-weight compared with overweight/ obese children by including a 3-way interaction between snacking, weight status at baseline, and time. To control for diet quality of the remainder of the diet, all models controlled for the percentage of energy from food groups consumed at meals. In additional models, we also tested whether control-ling for total energy changed the association between snacking and BMI in order to determine whether snacking influenced BMI outside of its contri-bution to total energy (in other words, whether the type of eating occasion mattered).
StataÕs margin command was used to predict the mean adjusted BMI zscore by baseline weight status and snacking for each survey year. To test for statistical significance over time, pairwise contrasts were per-formed within baseline weight status and snacking to compare mean BMIzscore in 2009 and 2011 to that in 2006 (P< 0.05). Joint contrasts to test the statistical significance of the interaction terms also were performed (P< 0.10).
All models controlled for urbanicity, sex, and parental education. Physical activity was not associated with either BMIzscore or snacking in bivariate regression, likely because of the homogenous and low levels of physical activity in nonmegacity participants, and subsequently was excluded from analytic models. Sensitivity analyses revealed that results were robust to inclusion of physical activity.
Results
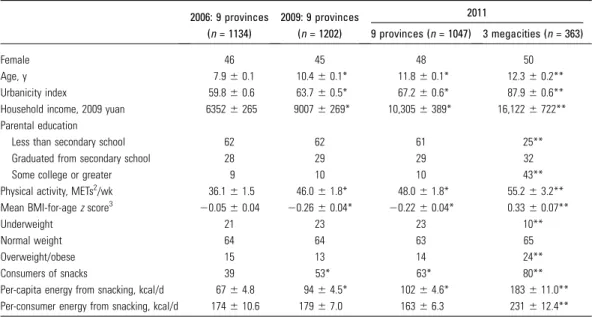
Characteristics of the sample.In children in provinces, urban-icity and household income increased over time, as did physical activity, although physical activity was low across time points (Table 1). In 2011, children in megacities had higher household income and parental education, as well as higher physical activity (P < 0.05), than did children in provinces. For children in provinces, mean BMIzscore decreased over time, and, in 2011,
children in megacities had higher mean BMIzscores (P< 0.05), in addition to a higher proportion of obesity and lower proportion of underweight.
Cross-sectional description of snacking.The percentage of children who snacked $1 time over the 3 d of dietary data collection increased from 39% to 63% between 2006 and 2011 (P< 0.05), but per-consumer daily energy from snacking did not change from 2006 to 2011. Children in megacities were more likely to snack (80%) and consumed more calories from snacks than did their provincial counterparts (236 compared with 176 kcal/d;P< 0.05).
Fruit was an increasingly common snack over time (with an increase from 30% of consumers in 2006 to 50% in 2011), and it was also the most common snack in megacities (63%) (Table 2). Condiments and sauces and fats and oils were commonly consumed during snacking occasions over time and across regions, although the calories consumed from fats and oils (11–15 kcal/d) and condiments (<1 kcal/d) were considerably fewer than those from fruit (54–68 kcal/d). Children from megacities consumed substan-tially more milk and yogurt (with 24% and 20% of consumers, respectively, in 2011) than did children in provinces [7% and 4%, respectively (P< 0.05)].
The percentage of consumers of sweetened beverages, crack-ers, sweet bakery products, other desserts, and savory snacks was low, but all increased over time. Among consumers, snack calories from sweet bakery products and savory snacks de-creased, whereas calories from crackers increased and calories from sweetened beverages remained unchanged. Children in megacities were significantly more likely to consume crackers, sweetened bakery products, and candy than were children in provinces in 2011 (14% compared with 9%, 9% compared with 6%, and 6% compared with 2%, respectively;P< 0.05), as well as more nonsoy plant protein [10% compared with 3% (P < 0.05)]. Among consumers, children from megacities tended to
TABLE 1 Descriptive statistics on the sociodemographic composition of the China Health and Nutrition Survey sample1
2006: 9 provinces (n= 1134)
2009: 9 provinces (n= 1202)
2011
9 provinces (n= 1047) 3 megacities (n= 363)
Female 46 45 48 50
Age, y 7.960.1 10.460.1* 11.860.1* 12.360.2**
Urbanicity index 59.860.6 63.760.5* 67.260.6* 87.960.6**
Household income, 2009 yuan 63526265 90076269* 10,3056389* 16,1226722**
Parental education
Less than secondary school 62 62 61 25**
Graduated from secondary school 28 29 29 32
Some college or greater 9 10 10 43**
Physical activity, METs2/wk 36.161.5 46.061.8* 48.061.8* 55.263.2**
Mean BMI-for-agezscore3 20.0560.04 20.2660.04* 20.2260.04* 0.3360.07**
Underweight 21 23 23 10**
Normal weight 64 64 63 65
Overweight/obese 15 13 14 24**
Consumers of snacks 39 53* 63* 80**
Per-capita energy from snacking, kcal/d 6764.8 9464.5* 10264.6* 183611.0**
Per-consumer energy from snacking, kcal/d 174610.6 17967.0 16366.3 231612.4**
1Values are means6SEs (continuous variables) or percentages. Snacking is defined as having reported consuming$1 snack over 3 d.
Provinces are treated as repeated cross-sectional (2006, 2009, and 2011) and megacities are treated as cross-sectional (2011 only).
*Percentage or mean is different in 2009 or 2011 relative to 2006 (for provinces sample only) with the use of 2-samplettests,P,0.05.
**Percentage or mean is different between megacity and provinces (2011 only) with the use of 2-samplettests,P,0.05.
2MET, metabolic equivalent of task.
consume calories from snack food groups that were similar to those in provinces, with the exception of more calories from fruit and fats/oils and fewer calories from crackers and dairy drinks/ substitutes.
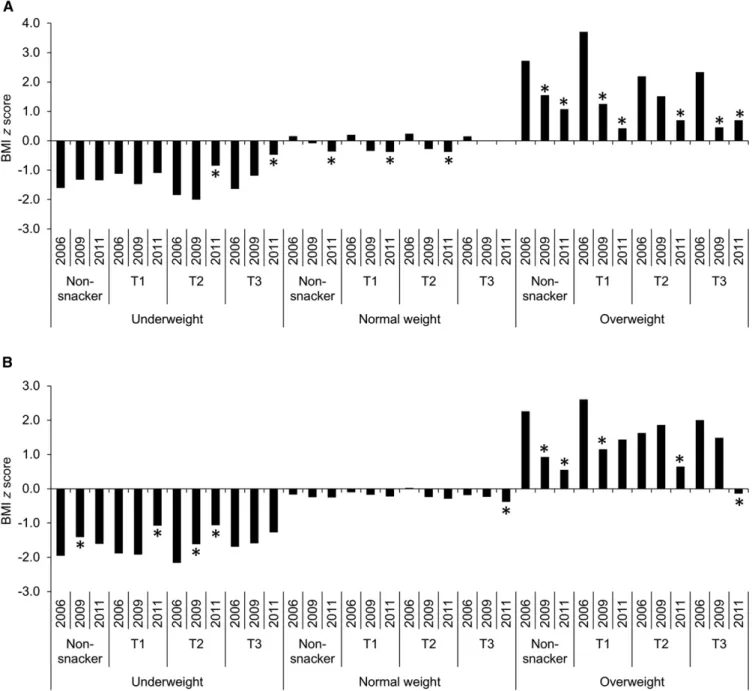
Longitudinal association between snacking and BMI z score. Results for adjusted predicted changes in BMIz score from models that controlled for types of foods consumed at meals and sociodemographic characteristics, but not total energy intake, are shown inFigure 1A. Among underweight children aged 2–6 y at baseline, being in the top tertiles of snacking was associated with the greatest mean increases in BMIzscore from 2006 to 2011 (+55% and +71% increases for the second and third tertiles, respectively,P< 0.05 for contrast between years). Among
overweight children aged 2–6 y, all children showed declines in BMIzscore over time, but children in the first tertile of snacking showed the largest mean declines [289% compared with the second tertile (269%), third tertile (271%), and nonsnackers (260%) (P< 0.05 for contrast)]. Among normal-weight 2- to 6-y-old children, nonsnackers showed the only statistically significant decline in BMI z score (2325%) (P < 0.05 for contrast), but in absolute terms, these declines in BMIzscore were minor (<0.06 BMIzscore–unit difference from 2006 to 2011 across all snacking categories). Results from models controlling for total daily energy were very similar (Supple-mental Table 2, Part A).
Among underweight children aged 7–13 y at baseline, children in the first and second tertiles of snacking showed the greatest
increases in BMIzscore from 2006 (+43% and +51%, re-spectively;P< 0.05) (Figure 1B). Among overweight children aged 7–13 y, children in the top tertile of snacking showed the greatest declines in BMI z score [2107% relative to non-snackers (276%), those in the first tertile (245%), and those in the second tertile (260%) (P < 0.05)]. Again, normal-weight children did not show meaningful changes in BMI z score, although snackers in tertile 2 showed significant declines from 2006 to 2011 [2100% (20.19 in absolute terms)]. Again, results from models controlling for total daily energy were very similar (Supplemental Table 2, Part B).
Discussion
In Chinese children aged 2–13 y, increases in the prevalence of snacking occurred rapidly between 2006 and 2011, increasing by nearly 25% in Chinese provinces. By 2011, snacking had become a predominant dietary behavior. On the other hand, in children from provinces, per-consumer calories from snacking remained consistent at;175 kcal/d.
Fruit consumed as snacks remained the most common snack across time, with the majority of those who snacked consuming fruit. At the same time, the intake of beverages as snacks was quite low, with only 7% consuming milk, 4% consuming sugar-sweetened beverages (SSBs), and 3% consuming fruit drinks in provinces. Considering that the consumption of fruit during meals was rare (only 2% of children in this sample reported consuming fruit at meals) (data not shown), snacks are an important avenue for promoting fruit intake in this population. Higher fruit intake could also protect against other consequences of the westernizing diet, because fruits are good sources of fiber, which is associated with lower blood pressure, better glycemic control, and prevention of weight gain (44), and they contain important phytochemicals, whose antioxidant activities may pre-vent inflammation, cancer, and cardiovascular disease (45).
Children in megacities were more likely to snack and also consumed nearly 60 more calories/d from snacks. They were >3 times as likely to consume milk as a snack and 5 times more likely to consume yogurt. This disparity is the result of the rapid expansion of ChinaÕs dairy sector, with milk production doubling between 1990 and 2000 along with increasing incomes, especially in urban areas, making dairy widely available in megacities but still relatively scare throughout the rest of China (46). Advertising coupled with the incorporation of government recommendations for milk consumption in its dietary recommendations and the introduction of school milk in several large cities also have played a major role in the increased intake of milk and yogurt (47, 48). Although the intake of crackers, sweet baked goods, candy, snacks, and SSBs remains low even in urban areas, it will be important in the future to monitor changes in these food groups. In a separate study examining processed food intake in China, cross-sectional analyses that attempted to control for selectivity related to processed food intake found that increased processed food intake was linked with a higher BMI and greater risk of overweight in Chinese children 2–18 y of age in 2011 (49). That study suggested a shift in the future in the type of snack foods, especially in more urbanized areas in China.
In this study, we found that, in normal-weight children aged 2–6 y and 7–13 y, snacking was not associated with changes in BMI z score over time; however, in underweight children, snacking was associated with increases in BMIzscore, and in overweight children, snacking was associated with larger declines in BMIzscore from 2006 to 2011. These findings contradict 2
longitudinal studies of US children by Fields et al. (23) and Phillips et al. (28), who found no relation between snack food consump-tion and BMIz score in children, with the exception of soda, which was linked to increases in BMIz score in the study by Phillips et al. (28). Yet another longitudinal study of 5- to 12-y-old children in Bogot ´a, Columbia, found that a snacking pattern composed of high-energy–dense snack-foods such as candy, fried snacks, soda, and other SSBs was linked to an increased BMIz
score, but for individual foods, only soda was linked to increased BMIzscores (50). Notably, however, all of these studies measured snack foods such as chips, cake, cookies, and ice cream, rather than the behavior of snacking, or eating outside of the 3-meal pattern. In addition, fruits, rather than high-energy–dense snacks, were by far the most commonly consumed snacks in this population, likely explaining this difference in association.
Results on eating frequency, however, suggest that increased eating frequency is linked to more favorable body composition, even when energy intake is higher. One study of 2372 black and white US girls aged 9–10 y found that lower snack and total eating frequencies were linked to greater 10-y increases in BMI and waist circumference (51). In addition, several cross-sectional studies of children and adolescents in the United States found that more frequent eating or snacking was inversely associated with overweight and abdominal adiposity (29, 52, 53), as well as (in a sample of Hispanic youth) lower fasting insulin, HOMA-IR, and TGs (52).
There is some evidence that more frequent eaters spend more time in physical activity (53), suggesting that increased move-ment might explain the link between frequent eating and body composition. In this sample, physical activity was low, with little variability, precluding close examination of the snacking–physical activity–obesity link; however, future works should examine whether increased eating frequency is the result of higher physical activity or whether it in part encourages higher activity. For example, one recent randomized controlled trial found that adults who ate breakfast consumed more calories but also increased physical activity, and although eating breakfast was linked to higher energy intake, breakfast eaters also expended more energy throughout the day, creating energy balance (54). In China, as the culture shifts more toward snacking, it may be increasingly important to couple messages around food and snacks with pro-motions of physical activity.
One limitation of this study is that we looked at intake of calories from snacks, rather than the timing or frequency of eating occasions, because of lack of information about when eating occasions took place. These results permitted us to examine whether eating outside of meals contributed to BMIz
score over time, but did not tell us whether some snacking occasions were advantageous, whereas others may have been less so (for example, nighttime snacking). We also combined the effect of amount consumed from snacks overall compared with number of snacks, and because so few children consumed snacks other than fruit, we were unable to explore the dif-ferential effect of different types of snack foods (i.e., high-energy–dense snacks compared with fruits). Future work should consider what types of patterns (i.e., timing, frequency, type, and amount) are linked to the most advantageous weight outcomes.
In addition, we cannot rule out the possibility that the effects of the behavioral choice to snack may be affected by baseline weight status and weight gain or loss over time. For example, both younger and older children who were overweight at baseline and who were in the first tertile of snacking had the highest mean BMIzscore within that weight category. Thus, these children may have been eating a certain amount of snacks as an attempt to lose weight. Similarly, children who were the most underweight to begin with may have been encouraged to snack more as part of an overall effort to gain weight. Ideally, a randomized trial would be conducted in order to establish a causal link between snacking frequency, amount and type of snack, and weight trajectories in youth.
However, to our knowledge, this study was the first to explore the longitudinal association between snacking, a prev-alent and increasing dietary behavior, and weight status in Chinese children. Additional strengths included the use of ob-jectively measured weight and height, very detailed dietary intake data collected over 3 d, and a mixed-effects design that allowed us to examine the longitudinal effects of snacking on weight while controlling for important dietary and contextual confounders.
In conclusion, snacking is highly prevalent in Chinese children in provinces and megacities, and the majority of children in 2011 were snackers. Fruit remains the most common snack. Children in megacities were more likely to consume snacks and consumed more calories per day from snacks, including from dairy products such as milk and yogurt. Snacking did not contribute to changes in BMIzscore in normal-weight children aged 2–6 y and 7–13 y, but snacking was associated with declines in BMI z score in overweight/obese Chinese children and increases in BMIzscore in underweight children. One question for future exploration is whether, as China continues its nutrition transition, high-energy– dense snacks such as sugary beverages, cookies, chips, and cakes will become more common, and, if so, whether these higher-energy–dense snacks are actually problematic for appropriate weight gain in Chinese children and adolescents.
Acknowledgments
We thank Phil Bardsley for excellent data management and programming assistance. LST was responsible for the study design, statistical analysis, interpretation of results, and the drafting and editing of the manuscript; DW and BMP assisted with the study design, interpreting results, and editing the manuscript; and BMP had primary responsibility for the final content. All authors read and approved the final manuscript.
References
1. Gordon-Larsen P, Wang H, Popkin BM. Overweight dynamics in Chinese children and adults. Obes Rev 2014;15 Suppl 137–48. 2. Popkin BM, Conde W, Hou N, Monteiro C. Is there a lag globally in
overweight trends for children compared with adults? Obesity (Silver Spring) 2006;14:1846–53.
3. Piernas C, Wang D, Du S, Zhang B, Wang Z, Su C, Popkin B. The double burden of under-and overnutrition and nutrient adequacy among Chinese preschool and school-aged children in 2009–2011. Eur J Clin Nutr 2015; in press.
4. Seo DC, Niu J. Trends in underweight and overweight/obesity preva-lence in Chinese youth, 2004–2009. Int J Behav Med 2014;21:682–90. 5. Tudor-Locke C, Ainsworth BE, Adair LS, Du S, Lee N, Popkin BM.
Cross-sectional comparison of physical activity and inactivity patterns in Chinese and Filipino youth. Child Care Health Dev 2007;33:59–66. 6. Tudor-Locke C, Ainsworth BE, Adair LS, Du S, Popkin BM. Physical
activity and inactivity in Chinese school-aged youth: the China Health and Nutrition Survey. Int J Obes Relat Metab Disord 2003;27:1093–9. 7. Jing JE. Feeding China’s little emperors: food, children, and social
change. Stanford (CA): Stanford University Press; 2000.
8. Yang J. ChinaÕs one-child policy and overweight children in the 1990s. Soc Sci Med 2007;64:2043–57.
9. Zhai FY, Du SF, Wang ZH, Zhang JG, Du WW, Popkin BM. Dynamics of the Chinese diet and the role of urbanicity, 1991–2011. Obes Rev 2014;15:16–26.
10. Wang Z, Zhai F, Du S, Popkin B. Dynamic shifts in Chinese eating behaviors. Asia Pac J Clin Nutr 2008;17:123–30.
11. Zhou Y, Du S, Su C, Zhang B, Wang H, Popkin BM. The food retail revolution in China and its association with diet and health. Food Policy 2015;55:92–100.
12. Wang Z, Zhai F, Zhang B, Popkin BM. Trends in Chinese snacking behaviors and patterns and the social-demographic role between 1991 and 2009. Asia Pac J Clin Nutr 2012;21:253.
13. Adair LS, Popkin BM. Are child eating patterns being transformed globally? Obes Res 2012;13:1281–99.
14. Mendez MA, Popkin BM. Globalization, urbanization, and nutritional change in the developing world. Electronic Journal of Agricultural and Development Economics 2005;1:220–41.
15. Popkin B, Bisgrove EZ. Urbanization and nutrition in low-income countries. Food Nutr Bull 1988;10:3–23.
16. Popkin BM. Urbanization, lifestyle changes and the nutrition transition. World Dev 1999;27:1905–16.
17. Popkin BM. Nutrition, agriculture and the global food system in low and middle income countries. Food Policy 2014;47:91–6.
18. Zhang QF, Pan Z. The transformation of urban vegetable retail in china: wet markets, supermarkets and informal markets in Shanghai. J Contemp Asia 2013;43:497–518.
19. Guo X, Zheng L, Li Y, Yu S, Sun G, Yang H, Zhou X, Zhang X, Sun Z, Sun Y. Differences in lifestyle behaviors, dietary habits, and familial factors among normal-weight, overweight, and obese Chinese children and adolescents. Int J Behav Nutr Phys Act 2012;9:120.
20. Evans EW, Jacques PF, Dallal GE, Sacheck J, Must A. The role of eating frequency on total energy intake and diet quality in a low-income, racially diverse sample of schoolchildren. Public Health Nutr 2015; 18:474–81.
21. Duffey KJ, Popkin BM. Causes of increased energy intake among children in the U.S., 1977–2010. Am J Prev Med 2013;44:e1–e8. 22. Evans EW, Jacques PF, Dallal GE, Sacheck J, Must A. The role of eating
frequency on relative weight in urban school-age children. Pediatr Obes 2015;10:442–7.
23. Field AE, Austin SB, Gillman MW, Rosner B, Rockett HR, Colditz GA. Snack food intake does not predict weight change among children and adolescents. Int J Obes Relat Metab Disord 2004;28:1210–6. 24. Nicklas TA, Morales M, Linares A, Yang S-J, Baranowski T, De Moor
C, Berenson G. ChildrenÕs meal patterns have changed over a 21-year period: the Bogalusa Heart Study. J Am Diet Assoc 2004;104:753–61. 25. Huang TTK, Howarth NC, Lin BH, Roberts SB, McCrory MA. Energy
intake and meal portions: associations with BMI percentile in US children. Obes Res 2004;12:1875–85.
27. Nicklas TA, Yang S-J, Baranowski T, Zakeri I, Berenson G. Eating patterns and obesity in children: the Bogalusa Heart Study. Am J Prev Med 2003;25:9–16.
28. Phillips SM, Bandini LG, Naumova EN, Cyr H, Colclough S, Dietz WH, Must A. Energy-dense snack food intake in adolescence: longitu-dinal relationship to weight and fatness. Obes Res 2004;12:461–72. 29. Keast DR, Nicklas TA, OÕNeil CE. Snacking is associated with reduced
risk of overweight and reduced abdominal obesity in adolescents: National Health and Nutrition Examination Survey (NHANES) 1999– 2004. Am J Clin Nutr 2010;92:428–35.
30. Fabry P, Hejda S,Cern ´y K, O sancov ´a K, Pechar J, Zvolankova K. Effect of meal frequency in schoolchildren changes in weight-height propor-tion and skinfold thickness. Am J Clin Nutr 1966;18:358–61. 31. Toschke AM, Thorsteinsdottir KH, von Kries R. Meal frequency,
breakfast consumption and childhood obesity. Int J Pediatr Obes 2009; 4:242–8.
32. Ovaskainen ML, Reinivuo H, Tapanainen H, Hannila M, Korhonen T, Pakkala H. Snacks as an element of energy intake and food consump-tion. Eur J Clin Nutr 2006;60:494–501.
33. Adler NE, Boyce T, Chesney MA, Cohen S, Folkman S, Kahn RL, Syme SL. Socioeconomic status and health: the challenge of the gradient. Am Psychol 1994;49:15–24.
34. McCrory MA, Campbell WW. Effects of eating frequency, snacking, and breakfast skipping on energy regulation: symposium overview. J Nutr 2011;141:144–7.
35. Leidy HJ, Campbell WW. The effect of eating frequency on appetite control and food intake: brief synopsis of controlled feeding studies. J Nutr 2011;141:154–7.
36. Zhang B, Zhai FY, Du SF, Popkin BM. The China Health and Nutrition Survey, 1989–2011. Obes Rev 2014;15(Suppl1):2–7.
37. Popkin BM, Du S, Zhai F, Zhang B. Cohort Profile: The China Health and Nutrition Survey–monitoring and understanding socio-economic and health change in China, 1989–2011. Int J Epidemiol 2010;39:1435–40. 38. World Health Organization [Internet]. Child growth standards:
BMI-for-age. 2015 [cited 2015 Jun 1]. Available from: http://www.who.int/ childgrowth/standards/bmi_for_age/en/.
39. Cole TJ, Bellizzi MC, Flegal KM, Dietz WH. Establishing a standard definition for child overweight and obesity worldwide: international survey. BMJ 2000;320:1240–3.
40. Cole TJ, Lobstein T. Extended international (IOTF) body mass index cut-offs for thinness, overweight and obesity. Pediatr Obes 2012;7:284–94. 41. Yang Y, Wang G, Pan X. China food composition 2002. Beijing (China):
Peking University Medical Press; 2002.
42. US Department of Agriculture Agricultural Research Service. What we eat in America food categories 2011-2012 [Internet]. [cited 2015 Jul 1]. Available from: http://www.ars.usda.gov/SP2UserFiles/Place/80400530/ pdf/1112/food_category_list.pdf.
43. Jones-Smith JC, Popkin BM. Understanding community context and adult health changes in China: development of an urbanicity scale. Soc Sci Med 2010;71:1436–46.
44. Anderson JW, Smith BM, Gustafson NJ. Health benefits and practical aspects of high-fiber diets. Am J Clin Nutr 1994;59:1242S–7S. 45. Liu RH. Health benefits of fruit and vegetables are from additive
and synergistic combinations of phytochemicals. Am J Clin Nutr 2003;78:517S–20S.
46. Fuller F, Beghin JC, Rozelle S. Urban demand for dairy products in China: evidence from new survey data. Ames (IA): Center for Agricultural and Rural Development, Iowa State University; 2004.
47. Fuller F, Beghin JC, Hu D, Rozelle S. China’s dairy market: consumer demand survey and supply characteristics. Ames (IA): Center for Agricultural and Rural Development, Iowa State Univer-sity; 2004.
48. Fuller F, Huang J, Ma H, Rozelle S. Got milk? The rapid rise of ChinaÕs dairy sector and its future prospects. Food Policy 2006;31:201–15. 49. Zhou Y, Du S, Su C, Zhang B, Wang H, Popkin BM. The food retail
revolution in China and its association with diet and health. Food Policy. In press.
50. Shroff MR, Perng W, Baylin A, Mora-Plazas M, Marin C, Villamor E. Adherence to a snacking dietary pattern and soda intake are related to the development of adiposity: a prospective study in school-age children. Public Health Nutr 2014;17:1507–13.
51. Ritchie LD. Less frequent eating predicts greater BMI and waist circumference in female adolescents. Am J Clin Nutr 2012;95:290–6. 52. House BT, Shearrer GE, Miller SJ, Pasch KE, Goran MI, Davis JN.
Increased eating frequency linked to decreased obesity and improved metabolic outcomes. Int J Obes 2015;39:136–41.
53. Zerva A, Nassis GP, Krekoukia M, Psarra G, Sidossis LS. Effect of eating frequency on body composition in 9–11-year-old children. Int J Sports Med 2007;28:265–70.
54. Betts JA, Richardson JD, Chowdhury EA, Holman GD, Tsintzas K, Thompson D. The causal role of breakfast in energy balance and health: a randomized controlled trial in lean adults. Am J Clin Nutr 2014;100:539–47.
55. Popkin BM, Duffey KJ. Does hunger and satiety drive eating anymore? Increasing eating occasions and decreasing time between eating occa-sions in the United States. Am J Clin Nutr 2010;91:1342–7.
56. Speechly D, Buffenstein R. Greater appetite control associated with an increased frequency of eating in lean males. Appetite 1999;33:285– 97.
57. Stote KS, Baer DJ, Spears K, Paul DR, Harris GK, Rumpler WV, Strycula P, Najjar SS, Ferrucci L, Ingram DK. A controlled trial of reduced meal frequency without caloric restriction in healthy, normal-weight, middle-aged adults. Am J Clin Nutr 2007;85:981–8. 58. Bachman JL, Raynor HA. Effects of manipulating eating frequency
during a behavioral weight loss intervention: a pilot randomized controlled trial. Obesity (Silver Spring) 2012;20:985–92.
59. Smeets AJ, Westerterp-Plantenga MS. Acute effects on metabolism and appetite profile of one meal difference in the lower range of meal frequency. Br J Nutr 2008;99:1316–21.
60. Jackson SJ, Leahy F, Jebb S, Prentice A, Coward W, Bluck L. Frequent feeding delays the gastric emptying of a subsequent meal. Appetite 2007;48:199–205.
61. Tanofsky-Kraff M, Shomaker LB, Stern EA, Miller R, Sebring N, DellaValle D, Yanovski SZ, Hubbard VS, Yanovski JA. ChildrenÕs binge eating and development of metabolic syndrome. Int J Obes (Lond) 2012;36:956–62.