Contradiction in Culture: Cultural Capital or Oppositional Culture?
Karen Phelan Kozlowski
A thesis submitted to the faculty of the University of North Carolina at Chapel Hill in partial fulfillment of the requirements for the degree of Master of Arts in the Department of
Sociology.
Chapel Hill 2011
ABSTRACT
KAREN PHELAN KOZLOWSKI: Contradiction in Culture: Cultural Capital or Oppositional Culture?
(Under the direction of Dr. Karolyn D. Tyson)
ACKNOWLEDGEMENTS
TABLE OF CONTENTS
...
LIST OF TABLES viii
...
LIST OF FIGURES ix
...
I. INTRODUCTION 1
...
II. BACKGROUND AND SIGNIFICANCE 3
...
Cultural Capital Perspective 3
...
Oppositional Culture Framework 5
... The Cultural Toolkit Meets Cultural Capital and Oppositional Culture 7
...
Teacher Bias in the Cultural Establishment 9
... “Hard Work”: What Is It? Who Defines It? And What Affects It? 10
...
Hypotheses For Study 15
...
III. METHODOLOGY 16
...
Data 16
...
Measures: Independent Variables 19
...
Measures: Dependent Variable 21
...
IV. RESULTS 27
Degree of General Student-Teacher Agreement and Student-Teacher Agreement by ...
Race 27
... Predictors of Racial Differences in Student-Teacher Dis/Agreement 29
...
V. DISCUSSION 40
...
...
Evidence Supporting Cultural Capital Mismatch 43
...
Limitations 51
...
VI. CONCLUSION 53
APPENDIX A: METHODOLOGICAL CONSIDERATIONS AND ALTERNATIVE ...
MODEL OUTCOMES 56
...
LIST OF TABLES Table
1. Descriptive Statistics...18
2. Frequency of Effort Missingness By Student Race/Ethnicity...23
3. General Frequency Distribution of Student-Teacher Work Effort...27
4. Frequency Distribution of Student-Teacher Effort Assessment, By Race/Ethnicity...28
5. Predictors of “Student No, Teacher No” Category Likelihood...31
6. Racial/Ethnic Distribution of Perception of Teacher Insult...34
7. Predictors of “Student Yes, Teacher No” Category Likelihood...36
A1. Predictors of “Student No, Teacher No” Category Likelihood For English Teachers...60
A2. Predictors of “Student Yes, Teacher No” Category Likelihood for English Teachers...61
A3. Math Multinomial Race Only Results...65
A4. Math Multinomial Race and Test Scores Results...65
LIST OF FIGURES Figures
I. INTRODUCTION
Despite 50 years’ worth of court-mandated equal education for all, there are still considerable disparities in education outcomes among students of color and students of different socioeconomic status (Jencks and Phillips, 1998; Condron, 2009). Scholars have suggested that the persistence of these gaps may be due to one or several of many different structural factors, including differential family background, access to resources that promote learning, and treatment of students within schools (Condron, 2009; Ferguson 2000). In addition to to these structural explanations for educational inequality, cultural explanations for student achievement have also gained popularity and research attention over the last several decades (Ogbu, 1991; Ainsworth-Darnell and Downey, 1998; Farkas, Lleras, and Maczuga, 2002; Mickelson, 1990). Many of these studies have attempted to locate cultural orientations in students through a variety of mechanisms (values, attitudes, beliefs, museum trips, etc.). However, few studies attempt to characterize students’ cultural orientations against the cultural orientation of the education institution itself--particularly in terms of behavioral dimensions of culture. Teachers differentially reward students who exhibit the attitudes and behaviors they expect in the classroom, and some studies have suggested that if students all exhibited the skills and behaviors teachers expect, racial disparities in
effort with teachers’ perceptions of students’ work effort, this study adds to existing research the extent to which minority students exhibit opposition toward school or cultural “toolkit” mismatch with the educational institution.
Oppositional culture and cultural capital mismatch are two of the dominant cultural theories that address minority educational underachievement. The cultural capital
perspective suggests that disadvantaged minority students do not have access to the kinds of cultural resources, ideas, norms, and beliefs that are required for educational success. Alternatively, the oppositional culture framework suggests that minority students, having been disillusioned by experiences of discrimination and/or perceptions of a job ceiling, will intentionally resist the structures of the dominant mainstream, thereby perpetuating the behaviors that cause underachievement. To put it in a cultural “toolkit” framework (Swidler, 1986), the cultural capital perspective suggests that students whose culture does not match the normative culture of the institution will not have the tools they need to succeed in that environment. The oppositional culture perspective suggests that students are familiar with the standards, do have the tools, but refuse to use them.
The American success narrative claims that gains will come from hard work, and the same is true for education -- if you work hard enough, anyone can get an A. However, a taken-for-granted assumption of this claim is that everyone knows what this hard work entails. If cultural capital mismatch is a result of the structural inequality minorities
Alternatively, if it is true that everyone knows what the standard is for hard work but minority students do not believe their efforts in school will pay off, then they may be consciously choosing not to work hard. In this case we would expect to find agreement between minority students’ self-reported effort (low) and teachers’ assessment of their effort (low). And we would expect these outcomes to be significantly different from whites’.
Because of this apparent contradiction, the following research question guided this study: Is the work effort minority students exert a consequence of cultural capital differences or oppositional culture? Using cross-sectional data from the Educational Longitudinal Study (base year 2002), I analyzed patterns of student-teacher dis/agreement about whether or not the student is working hard. Logistic regression results indicate partial support for cultural capital mismatch between black, Hispanic, and American Indian/multiracial students and their teachers and support for oppositional culture among some black students.
II. BACKGROUND AND SIGNIFICANCE
Cultural Capital Perspective
the field of education. However, what “cultural capital” actually is remains somewhat elusive. Broadly, cultural capital has come to be known as a knowledge of dominant cultural attitudes, preferences, and behaviors defined according to the standards of the upper and middles classes. For empirical purposes though, researchers have conceptualized cultural capital as an understanding and appreciation for “high brow culture,” particularly art, museums, music, and so forth (Lareau and Weininger, 2003). Scholars operating under this idea of cultural capital have measured how individuals’ consumption of high brow culture--that is, theatre and lecture attendance, museum trips, amount of time reading, number of books in the household, etc.--affects educational attainment. Bourdieu argues that affinity for high brow culture is inherited from past generations of elite, which accumulates for the present generation a cultural “wealth” that reproduces cultural and social structure--a structure in which those with the most access to these cultural markers are also the most highly educated (Bourdieu 1973). However, findings are mixed regarding the effect of this kind of cultural capital on educational attainment (DiMaggio, 1982; De Graaf, 1986; Katsillis & Rubinson, 1990).
That findings are mixed may reflect a misinterpretation of Bourdieu’s concept. Though Bourdieu admits that affinity for high brow culture is a consequence of social reproduction of the elite, according to Michel Lamont and Annette Lareau (1988), Bourdieu provides little evidence that cultural capital should be interpreted as high brow culture. Upon a careful analysis of Bourdieu’s cultural capital texts, Lamont and Lareau (1988) found cultural capital to be defined more as knowledge of standards related to academics
Lareau (1988:155) found that in Bourdieu and Passeron’s book Inheritors, cultural capital “consists of informal academic standards” which also happen to be an “attribute of the dominant class.” These standards/class attributes include “informal knowledge about the school, traditional humanist culture, linguistic competence and specific attitudes, or personal style” (Lamont and Lareau 1988: 155).
American culture is dominated by a “middle class hegemony” (Farkas, et. al., 1990). That is, middle class gatekeepers define normative standards for a field, and one’s ability to be successful within that field’s culture is determined by how well he or she exhibits those normative standards. Therefore, cultural capital within the field of education ought to reflect one’s familiarity with the informal academic standards defined by the attributes of the
dominant class, in which teachers are the gatekeepers to students’ success. Because
classrooms are structured and conducted according to this “middle class hegemony,” teachers differentially reward students who embrace general skills, habits, and styles that reflect this structure (Farkas, et. al, 1990). Exhibiting these middle class standards is so important that nearly all grade differentials between race and socioeconomic groups are explained when students successfully exhibit the habits, skills, and styles informally defined as appropriate school behavior (Farkas, et. al., 1990).
Oppositional Culture Framework
schooling because of historically poor relations between blacks and whites in America, personal/family experiences with discrimination, and because they perceive few real opportunities for their futures. Scholars have interpreted this hypothesis to assume that “involuntary minority” students resist schooling because they value school less than their white counterparts1. However, black students actually seem to value education more than white students, despite having lower levels of attainment (Ainsworth-Darnell and Downey, 1998; Harris, 2006). For many researchers, the credibility of oppositional culture’s
explanatory power has been lost due to this paradoxical relationship between values and attainment (Mickelson, 1990; Ainsworth-Darnell and Downey, 1998).
If oppositional culture has been officially debunked by these rigorous tests of student values, then why does oppositional culture still find some supporters among researchers? First, it has been well-documented that values do not reliably predict outcomes2. Second, and more importantly, people might find some intuitive sense in oppositional culture theory precisely because “oppositional-looking behavior,” such as being disruptive, not doing homework, and getting in trouble, does occur in classrooms, particularly among black students, in greater frequencies than white students. For example, despite the fact that Ainsworth-Darnell and Downey (1998) found no support for anti-school attitudes or social sanctions for being a good student in the black population they studied, a frequently missed result from their study is that black students did exhibit significantly more oppositional
behavior in classrooms than did their white peers. Specifically, black students’ teachers
reported that they exerted less effort in class and were more disruptive than their white peers. The black students themselves reported a greater propensity for being in trouble and doing less homework than what their white and Asian peers reported (Ainsworth-Darnell and Downey, 1998).3 This result is important because there appears to be a more direct connection between the behavioral dimension of an oppositional peer culture and
achievement. Because teachers reward students who exhibit the skills, styles, and habits of the middle class (Farkas, et. al., 1990), those who are more likely to exhibit these
“oppositional” behaviors are probably more likely to underachieve.
The Cultural Toolkit Meets Cultural Capital and Oppositional Culture
Previous researchers have missed testing key elements of each of these theories. Cultural capital researchers tend to measure “high brow” proxies of culture rather than students’ knowledge of and ability to enact general classroom standards set by teachers (Lamont and Lareau, 1988). Oppositional culture researchers tend to focus on student
attitudes rather than students’ disinclination toward enacting these same behavioral standards. There are clear similarities in that both theories are missing an analysis of students’
perception and enactment of hegemonic middle class behavioral standards in the classroom. The reason researchers may not have considered this angle to these two theoretical approaches may be due to an inconsistent definition of culture. Common to both of these theories is a use of culture to explain an outcome. However, previous studies reveal that they do not share a common framework for understanding culture. I propose viewing the culture
in both of these theories through the framework of the cultural “toolkit” (Swidler, 1986). According to this model, culture ought to be seen as a “‘toolkit‘ of symbols, stories, rituals, and world-views” that people use to “construct strategies of action” (Swidler, 1986: 273). Through this process of selecting resources for action--whether people select them by habit, tradition, or by creative innovation--one’s cultural toolkit becomes reified as legitimate, important, and sensible in particular contexts. It is because of this meaning-making process that cultural resources of the toolkit lead to group-specific strategies of action, or behavioral response.
Swidler’s framework for understanding cultureis a useful approach for understanding both cultural capital and oppositional culture because it suggests that the behavior one
exhibits is a result of culturally-defined options for strategic action. These options for strategic action are determined and given meaning by the environment, social forces, structural resources, and institutions of a particular group of people. Because not all groups are equally valued or legitimized, some groups’ options for strategic action are more likely to be seen as acceptable in certain contexts. This can lead to hegemonic norms defined by dominant groups to the extent that strategies the dominant group enact become “standard” options for action. In America, this dominant group is the white middle class.
the dominant class would be rejecting the cultural tools of the middle class. Now the contradiction between these two theories becomes apparent: either students do not have the tools they need to be successful in school because of a cultural mismatch, or students do have the tools they need, but refuse to use them in opposition toward the educational
establishment.
Teacher Bias in the Cultural Establishment
Both the cultural capital and oppositional culture perspectives suggest clear reasons why students may not meet expectations of the educational institution, but an implicit assumption of both of these perspectives is that agents of the educational institution provide fair and objective assessments of students. We know, however, that teachers can be biased in their treatment and assessment of students based on students’ race and class. Even at the elementary and middle school levels, whether because of “inappropriate” dress, language (i.e. non-standard black English), or class disruption (typical particularly of most boys that age), teachers perceive young black males to be criminals in training (Ferguson, 2000). Ferguson argues that not only do these perceptions lead teachers to disproportionately punish black male students, but they also lead black male students to internalize the role and
expectations of little criminals.
are not only determined by race, but by class as well. “Good” students are often represented by middle class students (real or imagined), whereas “bad” students are often thought to come from lower class backgrounds (Morris, 2005). This reflects the middle class hegemony structure that Farkas, et. al. (1990) suggest to be characteristic of the educational system. Yet, as Morris(2005) shows us, class and race intersect in ways that over- or under-value race or class separately; for example, black teachers in the school Morris studied viewed white students as “middle class,” whereas white teachers tended to view white students as “trailer trash.” This finding indicates that white race privilege may trump class status, a sentiment supported by studies of frustrated adult middle class blacks who often feel that no matter how much they have achieved, they will always carry the negative stigma of being black (Cose, 1993).
“Hard Work”: What Is It? Who Defines It? And What Affects It?
Assessing whether a student has the necessary tools to succeed or whether they refuse to use standard tools for success requires looking at one of the most common expectations of the classroom: “hard work.” Working hard, so the saying goes, leads to success, and teachers expect that students will work hard in their classes. People often assume that everyone knows exactly what it means to work hard, but it is possible that “working hard” may mean very different things for different groups of people as a result of access to different cultural tools and resources. Nevertheless, “working hard” is a standard expectation that, like the rest of classroom norms and structures, is defined by agents of a hegemonic white middle class.
that increased student effort will lead to greater student achievement” (pg 267). When making such a “reasonable” assumption, it almost seems silly to test the extent to which effort does, in fact, affect student achievement. The few that have explored this relationship have shown the following: being “hardworking,” in addition to other noncognitive classroom behaviors, accounts for approximately 20 percent of students’ achievement scores as
measured by standardized tests4 (Lleras, 2008). Exploratory analysis from this study reveal that there is a very weak positive correlation between student reported work effort and test scores (.069), but a stronger correlation similar to the finding of Lleras (2008) between teacher reported effort and test scores (.26). Most telling, though, is that student work habits have a strong correlation with the grades they earn in their classes (.77, according to Farkas et. al., 1990). The work of these scholars confirms that achievement, at least in terms of student grades, is substantially contingent upon the behaviors students exhibit in the classroom. That is, if one works hard, it seems more likely that he or she will get an A. However, this relationship is not as strong for performance on standardized tests, which suggests that hard work is neither a necessary nor a sufficient condition for “objective” academic achievement5.
Previous research does indicate that “hard work” reflects other classroom
expectations. For example, Ferguson (2000) suggests that control of students’ bodies is a primary concern of teachers, and that one way in which teachers exert their control is by
4 Compare Models 2 and 4 of Table 3 (OLS regression on educational attainment). The 10th grade test composite coefficient is reduced from 9.108 to 7.039 when she controls for noncognitive behaviors, including being “hardworking.”
legitimizing some forms of dress over others. Research on work effort suggests that
students’ hard work is indeed positively correlated with appearance and dress (Farkas, et. al., 1990), though it is unclear how the scale for appearance and dress is measured. In addition to dressing presentably, teachers expect that students are prepared for class. One of the ways in which students are to show preparation is by working on and completing homework. According to Natriello and McDill (1986), student effort is positively correlated with the amount of time they spend on homework. And finally, teachers expect students to be able to arrive on time and control themselves while in class (Ferguson, 2000). Prior research on work effort suggests that hard work negatively correlates with both being tardy and being disruptive in class (Lleras 2008).
There are several factors which might affect how hard students work (as perceived by teachers and as perceived by the students themselves). The first of these factors is race. As already discussed, a significant amount of literature points to the fact that teachers
fact that many students wish not to leave the reservation upon graduation (Deyhle, 2005). Finally, just as race may affect the ways in which teachers and/or students perceive
themselves not to work hard, race can also have the opposite effect. Stacey Lee (2009) describes how in a school with a diverse Asian and Asian American population, teachers tend to favor and differentially reward Asian students who exhibit behaviors stereotypical of the “model minority.”
The second factor which may affect the extent to which students work hard is class. Annette Lareau has done extensive research on the ways in which class affects the way students and parents interact with social institutions such as education. She argues that schools are structured by expectations of the middle class, and that current trends normalize extensive parent involvement and intervention in school work and relationships (Lareau, 1987). Parents are expected to help with homework, facilitate learning outside of the classroom, and engage in regular conversations with the teacher about the progress of the student (Lareau, 1987; Lareau, 2002; Lareau, 2003). However, due to inflexible work schedules, lack of resources, transportation barriers, and distrust of teachers, many low-income parents cannot deliver the same kind of parental support to their children’s education as middle class parents can (Hardaway and McLoyd, 2009).
be silent and passive while boys are taught, as Ferguson (2000) puts it, that they are “naughty by nature.” In fact, according to one of Ferguson’s teacher informants, an “ideal” boy in her class is “not really Goody Two-shoes, you know. He’s not quiet and perfect. He’ll take risks. He’ll say the wrong answer. He’ll fool around and have to be reprimanded in class. There’s a nice balance to him” (pg 91). I expect that though the standard for hard work is the same for everyone, different understandings of what constitutes “natural” behavior by gender may have effects on the extent to which students and teachers think they are “working hard.”
It is important to note that gender norms are not necessarily the same by race. Black female students are often considered to exhibit behaviors, such as being loud or disruptive, that are not consistent with white notions of femaleness (Fordham, 1993). And as has been noted from Ferguson’s (2000) work, the same risky behaviors and disruptions that are deemed to be “natural” of white boys tend to be “criminal” of black boys. To the extent that these behaviors are correlated with “hard work,” I therefore expect that race could interact with gender in ways that could affect how both students and teachers categorize student work effort.
In additional to demographic factors that could affect how hard students work, there are several school factors that might affect student work effort. Though Coleman in 1966 found that there are virtually no differences between schools with different levels of
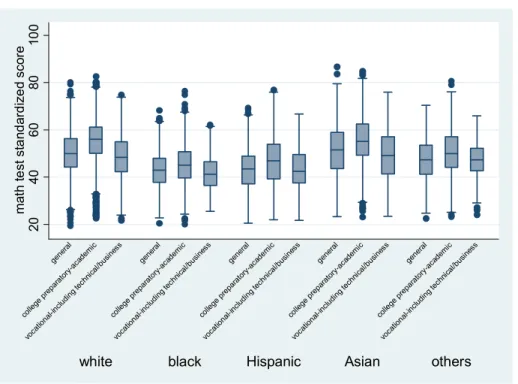
surprisingly, studies have also found that students in the college prep program are more likely to be well-behaved and more likely to work hard than students in other tracks (Carbonaro, 2005). However, track placement is also highly correlated with SES and race/ethnicity such that lower SES, black, and Hispanic students make up the lower rungs of track placement (Mickelson, 2001; Lucas and Berends, 2007). Therefore track placement could have particularly salient implications for how students of different racial and ethnic groups work.
Hypotheses For Study
This study assumes that “good” work effort is a standard cultural expectation of classrooms and that students in general will likely claim to exhibit “good” work effort.6 With these assumptions in mind, I examine the degree to which students and teachers similarly or dissimilarly rate student work effort, and how those similarities and differences are patterned by race and ethnicity as a function of cultural capital mismatch or oppositional culture7. Based on prior research regarding work effort and the factors that may affect it, the following hypotheses guide this study:
H1 (Oppositional Culture): Students exhibiting oppositional behavior should admit that they are not working hard. Because black and Hispanic students have been reported to exhibit oppositional culture in previous studies (Ogbu, 1991; Fordham and Ogbu, 1986; Portes and Zhou, 1993),and because white and Asian students tend to benefit from normative and “model minority” privilege (Lee, 2009), respectively,
6Positivity bias may be of some concern here, but I cannot control for this phenomenon in this study’s analyses. Conservative interpretation of results may offset the effect of some positivity bias.
7 To be clear, I do not assume that teachers are unbiased. Teachers, as agents of the white middle class
I expect that black and Hispanic students, along with their teachers, will be more
likely than white and Asian students to exhibit oppositional behavior by agreeing with
their teachers that they are not working hard.
H2 (Cultural Capital Mismatch): Students who are culturally mismatched with school expectations of work effort should think they are working hard but have teachers who
disagree. Students raised in lower socioeconomic classes are more likely to exhibit cultural capital mismatch with schools and teachers (Lareau, 2003), and black and Hispanic students are disproportionately represented in the lowest socioeconomic strata. Therefore,
I expect that black and Hispanic students will be more likely than white and Asian
students to exhibit cultural capital mismatch by rating their work effort highly when
their teachers rate it poorly.
III. METHODOLOGY Data
The data I use for this study are from The Educational Longitudinal Study of 2002 (ELS:2002). ELS:2002 is a nationally representative longitudinal survey study of 15,362 students from 752 schools and is designed to help researchers and policy informers better understand issues such as home life, particular course-taking paths, and school variation in the academic success of youth (U.S. Department of Education, National Center for Education Statistics). The first wave of the study examined a cohort of tenth grade high school
students.
study, though non-public Catholic and private schools were sampled at a higher rate. In the second stage, 17,591 tenth grade students were selected to take the surveys. Of those
selected, 15,362 completed the base year questionnaire. Among the students sampled, Asians and Hispanics are overrepresented, but black and white students are not. Students, as well as their parents (13,488), English and math teachers (7,135), principals (743), and head
Table 1. Descriptive Statistics
Variable Obs Valid Obs. Mean Std. Dev. Min Max
Race/Ethnicity
White 15325 15325 0.568 0.231 0 1
Black 15325 15325 0.132 0.339 0 1
Hispanic 15325 15325 0.145 0.352 0 1
Asian 15325 15325 0.096 0.294 0 1
AIAN/Multiracial 15325 15325 0.057 0.231 0 1
Math Test Scores 15325 15325 50.727 9.982 19.380 86.680
Demographic and School Controls Demographic and School Controls
Female 15,325 15325 0.502 0.500 1 2
SES 15,325 15325 0.043 0.743 -2.110 1.820
Public 15,325 15325 0.784 0.411 0 1
Catholic 15,325 15325 0.125 0.331 0 1
Other Private 15,325 15325 0.090 0.286 0 1
Urban 15,325 15325 0.333 0.471 0 1
Suburban 15,325 15325 0.482 0.500 0 1
Rural 15,325 15325 0.185 0.388 0 1
Northeast 15,325 15325 0.180 0.384 0 1
Midwest 15,325 15325 0.253 0.435 0 1
South 15,325 15325 0.366 0.482 0 1
West 15,325 15325 0.201 0.400 0 1
0-5% School Poverty 15,325 14073 0.315 0.465 0 1
6-10% School Poverty 15,325 14073 0.094 0.292 0 1
11-20% School Poverty 15,325 14073 0.171 0.376 0 1
21-30% School Poverty 15,325 14073 0.128 0.334 0 1
31-50% School Poverty 15,325 14073 0.149 0.356 0 1
51-75% School Poverty 15,325 14073 0.089 0.282 0 1
76-100% School Poverty 15,325 14073 0.055 0.228 0 1
General Track 15,325 15325 0.352 0.478 0 1
College Prep Track 15,325 15325 0.550 0.498 0 1
Vocational Track 15,325 15325 0.098 0.297 0 1
Discrimination Controls Math Teacher Race
White 15325 15325 0.723 0.447 0 1
Black 15325 15325 0.043 0.203 0 1
Hispanic 15325 15325 0.032 0.177 0 1
Asian 15325 15325 0.025 0.155 0 1
AIAN/Multiracial 15325 15325 0.177 0.381 0 1
Perceived Discrimination 15,325 14556 0.132 0.339 0 1
Reported Work Effort
Student Reported Effort 15,325 11162 0.573 0.494 0 1
Measures: Independent Variables
Student Race/Ethnicity: Students classified themselves according to one of the following seven racial or ethnic categories: non-Hispanic white, non-Hispanic black, Hispanic (two groups: race and non-race specified), American Indians/Alaskan natives, Asian/Pacific Islanders, and non-Hispanic multiracial. This study focuses on differences between white, black, Hispanic, and Asian students, so to simplify, I condensed race and non-race specified Hispanics into one category8. I also condensed American Indians/Alaskan natives and multiracial students into one “others” category because American Indians/ Alaskan natives make up less than one percent of the sample size. No students are missing race/ethnic information9.
Socioeconomic status is a continuous, composite variable created by ELS researchers. The variable is based on five equally weighted, standardized components: father’s/guardian’s education, mother’s/guardian’s education, family income, father’s/ guardian’s occupation, and mother’s/guardian’s occupation10. No students are missing SES information.11
8 The codebook did not specify which race with which the race-specified Hispanics identified. Because there was a large (n=1,229) number of race-specified Hispanics, I opted to condense them into the non-race-specified Hispanics into one category rather than eliminate them from analysis.
9 ELS researchers imputed any missing information.
10 Parental education is reported as one of 8 ordered categories: (1) did not finish high school (2) graduated high school or GED (3) attended 2-year school, no degree (4) graduated from 2-year school (5) attended college, no degree (6) graduated college (7) completed Master’s or equivalent (8) completed PhD or equivalent. Family income is reported from the parent questionnaire, which asks “Which category does your total family income from all sources in 2001 fall into?.” Responses are $5000 increments from $1,000 or less to $25,000; $25,001-$35,000; $35,001-$50,000; $50,001-$75,000; $75,001-$100,000; $100,001-$200,000; and $200,001+. Parental occupation score is calculated according to the 1961 Duncan index.
Student sex: Students were categorized as male or female. No information is missing on student sex.
Achievement: The American success narrative assumes that “hard work” will predict achievement. If this is the case, the achievement measure will provide a “check” on the extent to which teachers and students are accurately assessing student work effort. I used the students’ standardized math test scores (standardized T scores) to measure educational achievement. The standardized T score provides an estimate of student achievement relative to the population of spring 2002 tenth grade students. No information is missing for student achievement.
Track placement: Students in advanced curriculum tracks perform higher than students in regular or general curriculum tracks (Gamoran, 1992). However, the causal relationship between tracking and performance is unclear. Since schools tend to track racial minorities and lower SES students disproportionately into general and vocational tracks (Oakes, 1985) it is necessary to control for any race effect that tracking may have. Students were classified as being in either the general track, the college prep track, or the vocational track, and no information is missing on track placement.
Teacher race: Teacher race, in past research, has been a standard measure used to predict race-based teacher bias (Ferguson, 1998), though I expect that if teachers are truly agents of the middle class that teacher race will not prove to be significant. Nevertheless, I included this variable as a standard predictor of teacher bias. Like student race, teachers classified themselvesaccording to one of the following seven racial or ethnic categories: non-Hispanic white, non-Hispanic black, Hispanic (two groups: race and non-race specified), American Indians/Alaskan natives, Asian/Pacific Islanders, and non-Hispanic multiracial. I condensed these seven categories into five for this analysis: Hispanic white, non-Hispanic black, non-Hispanic, Asian/Pacific Islanders, American Indian/Alaskan native/ multiracial.
Perceived insult: Because I expected that teacher race may not provide a clear indication of teacher bias, I also included a measure of “perceived insult.” To the extent that this perceived insult is patterned by race, this measure attempts to capture race-based teacher bias. I created this variable from the following Likert-scale question from the student survey: “How much do you agree or disagree...[that] In class I often feel ‘put down’ by my teachers.” Responses ranges include strongly disagree, disagree, agree, and strongly agree. I
dichotomized responses into “no” or “yes.”
Measures: Dependent Variable
“when studying, I try to work as hard as possible.” Responses were measured using a four-point Likert scale: 4 = almost always, 3 = often, 2 = sometimes, 1 = almost never. I condensed these four responses into a binary category (1 and 2 = “no”, 3 and 4 = “yes”) to make a direct comparison to the teacher question, which asks the extent to which the teacher agrees with the following: “does this student usually work hard for good grades in your class?” This response was measured as yes or no. Math and English teachers’ responses were both available for each student; however, I use responses from the students’ math teachers only to compare to student responses.12
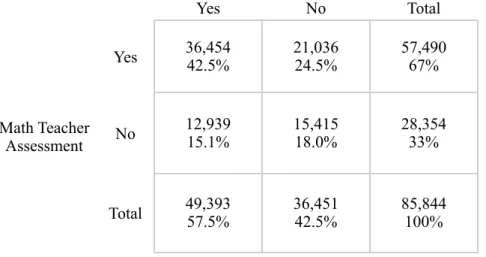
The dependent variable is a four-category cross-tabulation of the student and teacher responses. The categories resulting from the cross-tabulation include the following: “student yes, teacher yes,” “student no, teacher no,” “student no, teacher yes,” and “student yes, teacher no.” This measure provides a direct comparison between how well the students think they are working and how well the teachers perceive the students’ classroom effort.
Figure 1: Constructed Dependent Variable Outcomes
Student Yes, Teacher Yes Student Yes, Teacher No
Student No, Teacher Yes Student No, Teacher No
of their work effort13. Through preliminary analysis, I found that the data were not missing completely at random; there were significant differences as to whether a student or teacher answered the question of interest by student race/ethnic group.
Table 2. Frequency of Effort Missingness By Student Race/Ethnicity Table 2. Frequency of Effort Missingness By Student Race/Ethnicity Table 2. Frequency of Effort Missingness By Student Race/Ethnicity Table 2. Frequency of Effort Missingness By Student Race/Ethnicity Table 2. Frequency of Effort Missingness By Student Race/Ethnicity Works as Hard As Possible When Studies Works as Hard As Possible When Studies Works as Hard As Possible When Studies Works as Hard As Possible When Studies
No Yes Missing Total
White 33.8%2,956 43.7%3,820 22.4%1,959 8,735 100%
Black 23.4%475 35.6%721 41.0%831 2,027 100%
Hispanic 36.8%596 39.1%871 34.1%760 2,227 100%
Asian 26.9%394 47.0%689 26.1%382 1,465 100%
American Indian/ Multiracial
300
34.4% 39.0%340 27.6%231 100%871
Total 30.8%4,721 42.0%6,441 27.2%4,163 15,325 100%
To restore data for the full student sample, I used ICE multiple imputation in STATA to impute for missing values on all dependent and independent variables. All analyses therefore present estimates for five imputed data sets, each with a sample size of 15,325 students. Though imputed values are not ideal data, simulation research shows that estimates for imputed data often closely resemble estimates for complete data sets (Allison, 2002).
Analytic Strategy
The first part of this study explores patterns of student-teacher dis/agreement about student work effort using descriptive cross tabulations. I present general descriptive cross
tabulations of all four dependent variable outcomes as well as the frequency of each categorical outcome by race/ethnicity. I present all cross tabulations with Pearson’s chi-square to establish the extent to which racial/ethnic frequency in student-teacher dis/ agreement category placement is significantly different from zero. Though I present racial/ ethnic frequency for all four student-teacher dis/agreement categories, I focus further analysis on two categories of interest: “student no, teacher no,” and “student yes, teacher no.” These categories of interest directly represent oppositional culture and cultural capital mismatch, respectively.
To understand the conditions under which oppositional culture and cultural capital mismatch are present among minority students, the second part of the analysis explores predictors of racial and ethnic differences within the two categories of interest. I use logistic regression to model “student no, teacher no” and “student yes, teacher no” each as separate binaries where 1 is placement in the particular category of interest and 0 is placement in any of the other three outcome categories.
constant, then we can assume that the students in this category are low achievers, which often results from low levels of work effort. Likewise, if teachers are correct in their assessments of students’ effort, test scores will be negatively associated with the likelihood of being in the “student yes, teacher no” category. If this negative relationship attenuates significant under- or overrepresentation of students in this category, then we can assume that the students in the “student yes, teacher no” category are also low achievers--but unlike those in the “no, no” category, this group is not sure about what hard work means.
Since test scores are meant to provide a “check” on correct categorization of students’ work effort, I remove test scores from the rest of the statistical models, which predict student and environmental characteristics in the likelihood of over- or underrepresentation in
“student no, teacher no” and “student yes, teacher no” categories.14 Specifically, models include demographic and structural predictors to assess the extent to which racial/ethnic patterns of student-teacher dis/agreement may be a cultural response to structural variables. To this model I also add teacher race and perceived teacher insult as a check on whether students’ over or underrepresentation in each category of interest is determined by teacher discrimination. The following equation represents the analytical model for race/ethnicity and general predictors:
where X is a vector of all demographic predictors, Y is a vector of school characteristic and control variables, and Z is a vector of discrimination predictors.
Because track placement is likely a significant predictor for both outcomes of interest, I test an interaction between race/ethnicity and track placement to see if similar patterns exist here. Also, gender is expressed differently among racial and ethnic groups, such that the passivity and obedience teachers may deem to be characteristic of “hard work” varies by race (Fordham, 1993). To account for this, I also test the interaction between race and gender. The following equation describes the predictors plus interactions model:
IV. RESULTS
Degree of General Student-Teacher Agreement and Student-Teacher Agreement by Race
Table 3. General Frequency Distribution of Student-Teacher Work Effort Table 3. General Frequency Distribution of Student-Teacher Work Effort Table 3. General Frequency Distribution of Student-Teacher Work Effort Table 3. General Frequency Distribution of Student-Teacher Work Effort Table 3. General Frequency Distribution of Student-Teacher Work Effort Table 3. General Frequency Distribution of Student-Teacher Work Effort
Student Assessment Student Assessment Student Assessment
Yes No Total
Math Teacher Assessment
Yes 36,454 42.5% 21,036 24.5% 57,490 67%
Math Teacher Assessment No
12,939
15.1% 15,415 18.0% 28,354 33% Math Teacher
Assessment
Total 49,393 57.5% 36,451 42.5% 85,844 100%
Generally across the sample, teachers and students agree about the amount of effort students are putting forth about 60.5 percent of the time. More often than not, when teachers and students do agree, they agree that the student is working hard (42.5 percent of time). However, 18.0 percent of the time students and teachers recognize that the student is not working hard. This leaves approximately 39.5 percent of students who disagree overall with their teacher’s assessment of their performance16. Disagreement is not unidirectional, however; 15.1 percent of students overrate their performance and 24.5 percent of students actually underrate their performance.
Table 4. Frequency Distribution of Student-Teacher Effort Assessment, By Race/Ethnicity Table 4. Frequency Distribution of Student-Teacher Effort Assessment, By Race/Ethnicity Table 4. Frequency Distribution of Student-Teacher Effort Assessment, By Race/Ethnicity Table 4. Frequency Distribution of Student-Teacher Effort Assessment, By Race/Ethnicity Table 4. Frequency Distribution of Student-Teacher Effort Assessment, By Race/Ethnicity Table 4. Frequency Distribution of Student-Teacher Effort Assessment, By Race/Ethnicity
Student No,
Teacher No Teacher YesStudent No, Student Yes, Teacher No Student Yes, Teacher Yes Total
White 17.3%8,554 13,219 26.7% 12.5%6,187 21,571 43.6% 49,531 57.7%
Black 20.3%2,246 18.9%2,085 23.2%2,566 37.6%4,155 11,052 12.9%
Hispanic 21.3%2,604 19.7%2,407 20.1%2,460 39.0%4,781 12,525 14.3%
Asian 11.8%961 25.0%2,407 11.9%966 51.3%4,170 8,131 9.5%
American Indian/
Multiracial 21.5%1,050 26.5%1,291 15.6%760 36.4%1,777 4,878 5.7%
Total 15,415 18.0% 21,036 24.5% 12,939 15.1% 36,454 42.5% 85,844 100%
Note: All frequencies calculated using complete set of imputed data. Note: All frequencies calculated using complete set of imputed data. Note: All frequencies calculated using complete set of imputed data. Note: All frequencies calculated using complete set of imputed data.
Though all students, regardless of race/ethnicity, are most likely to agree that they are working hard versus any of the other categories, descriptive results do show racial/ethnic variation in all four categories of student-teacher work effort assessment. A cross-tabulation of the four-category outcome by racial and ethnic groups shows that of those in the “student yes, teacher yes” category, Asian students are the most likely to say they are working hard when their teacher agrees (51.3 percent of the Asian sample), followed by white students at 43.6 percent. Black, Hispanic, and American Indian/multiracial students all hover between 36.4 and 39.0 percent in the “yes, yes” category.
percent. The descriptive table shows that Asian students are the least likely to agree that they are not working hard, at 11.8 percent, and 17.3 percent of white students agree with their teachers that they are not working hard.
For the 40.4 percent of students who disagree with their teachers’ assessment of work effort, there are considerable differences by racial and ethnic groups. Though generally only 15.1 percent of students reported better work effort than what their teacher reported, black and Hispanic students are disproportionately represented in this category. Approximately 23.2 percent of black students and 20.1 percent of Hispanic students overrate their study effort. Conversely, the descriptive table shows that only 12.5 percent of white students and 11.9 percent of Asian students, and 15.6 percent of American Indian/multiracial students comprise the “student yes, teacher no” category.
Among the 23.8 percent of students who disagree that they are working hard, all minorities are slightly underrepresented. Black students are least likely to underrate their effort relative to their teachers at about 18.9 percent. Hispanics follow at 19.7 percent. Approximately 25 percent of Asian students underrate their work effort, and approximately the same percentage of white and American Indian/multiracial students do not think they work hard when their teachers think they do (26.7 and 26.5 percents, respectively).
Predictors of Racial Differences in Student-Teacher Dis/Agreement
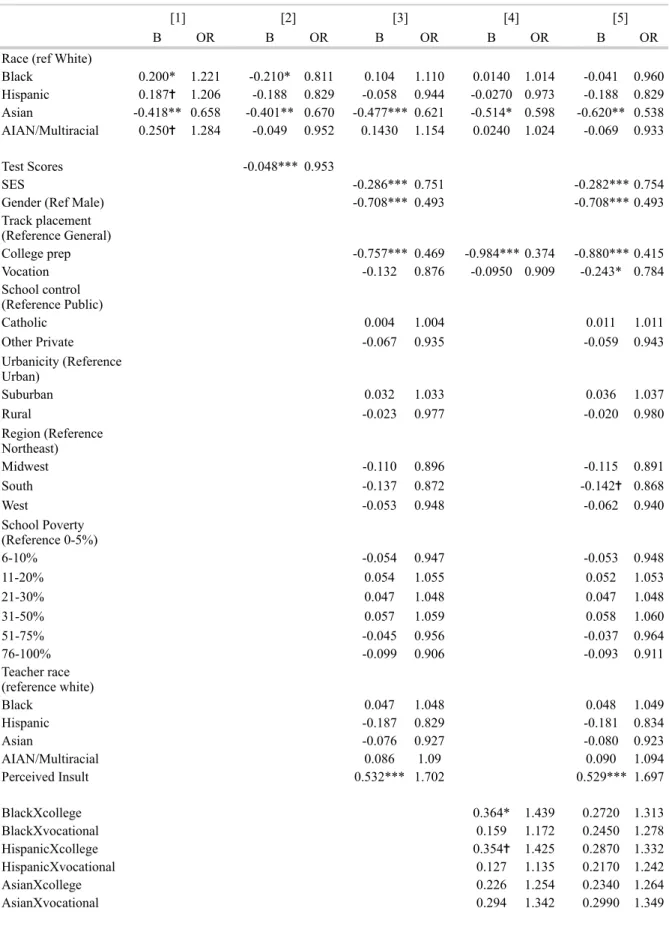
“Student No, Teacher No”: Hypothesis 1 predicted that black and Hispanic students would be more likely than white and Asian students to agree with their teachers that they were not working hard. I did find partial support for this hypothesis, as black, but not
Table 5. Predictors of “Student No, Teacher No” Category Likelihood Table 5. Predictors of “Student No, Teacher No” Category Likelihood Table 5. Predictors of “Student No, Teacher No” Category Likelihood Table 5. Predictors of “Student No, Teacher No” Category Likelihood Table 5. Predictors of “Student No, Teacher No” Category Likelihood Table 5. Predictors of “Student No, Teacher No” Category Likelihood Table 5. Predictors of “Student No, Teacher No” Category Likelihood Table 5. Predictors of “Student No, Teacher No” Category Likelihood Table 5. Predictors of “Student No, Teacher No” Category Likelihood Table 5. Predictors of “Student No, Teacher No” Category Likelihood Table 5. Predictors of “Student No, Teacher No” Category Likelihood Table 5. Predictors of “Student No, Teacher No” Category Likelihood Table 5. Predictors of “Student No, Teacher No” Category Likelihood Table 5. Predictors of “Student No, Teacher No” Category Likelihood Table 5. Predictors of “Student No, Teacher No” Category Likelihood
[1]
[1] [2][2] [3][3] [4][4] [5][5]
B OR B OR B OR B OR B OR
Race (ref White)
Black 0.200* 1.221 -0.210* 0.811 0.104 1.110 0.0140 1.014 -0.041 0.960
Hispanic 0.187✝ 1.206 -0.188 0.829 -0.058 0.944 -0.0270 0.973 -0.188 0.829
Asian -0.418** 0.658 -0.401** 0.670 -0.477***-0.477*** 0.621 -0.514* 0.598 -0.620** 0.538
AIAN/Multiracial 0.250✝ 1.284 -0.049 0.952 0.1430 1.154 0.0240 1.024 -0.069 0.933
Test Scores -0.048*** 0.953
SES -0.286***-0.286*** 0.751 -0.282***-0.282*** 0.754
Gender (Ref Male) -0.708***-0.708*** 0.493 -0.708***-0.708*** 0.493
Track placement (Reference General)
College prep -0.757***-0.757*** 0.469 -0.984***-0.984*** 0.374 -0.880***-0.880*** 0.415
Vocation -0.132 0.876 -0.0950 0.909 -0.243* 0.784
School control (Reference Public)
Catholic 0.004 1.004 0.011 1.011
Other Private -0.067 0.935 -0.059 0.943
Urbanicity (Reference Urban)
Suburban 0.032 1.033 0.036 1.037
Rural -0.023 0.977 -0.020 0.980
Region (Reference Northeast)
Midwest -0.110 0.896 -0.115 0.891
South -0.137 0.872 -0.142✝ 0.868
West -0.053 0.948 -0.062 0.940
School Poverty (Reference 0-5%)
6-10% -0.054 0.947 -0.053 0.948
11-20% 0.054 1.055 0.052 1.053
21-30% 0.047 1.048 0.047 1.048
31-50% 0.057 1.059 0.058 1.060
51-75% -0.045 0.956 -0.037 0.964
76-100% -0.099 0.906 -0.093 0.911
Teacher race (reference white)
Black 0.047 1.048 0.048 1.049
Hispanic -0.187 0.829 -0.181 0.834
Asian -0.076 0.927 -0.080 0.923
AIAN/Multiracial 0.086 1.09 0.090 1.094
Perceived Insult 0.532*** 1.702 0.529*** 1.697
BlackXcollege 0.364* 1.439 0.2720 1.313
BlackXvocational 0.159 1.172 0.2450 1.278
HispanicXcollege 0.354✝ 1.425 0.2870 1.332
HispanicXvocational 0.127 1.135 0.2170 1.242
AsianXcollege 0.226 1.254 0.2340 1.264
AI/MXcollege 0.457✝ 1.579 0.447✝ 1.611
AI/MXvocational 0.267 1.306 0.3120 1.366
Constant -1.497***-1.497*** 0.983*** -0.821***-0.821***-0.821*** -1.044***-1.044***-1.044*** -0.760***-0.760***-0.760***
Observations 15,325 15,325 15,325 15,325 15,325
Notes: Each model runs regressions on 5 sets of imputed data, each with 15,325 observations. Standard errors are in parentheses.
Notes: Each model runs regressions on 5 sets of imputed data, each with 15,325 observations. Standard errors are in parentheses.
Notes: Each model runs regressions on 5 sets of imputed data, each with 15,325 observations. Standard errors are in parentheses.
Notes: Each model runs regressions on 5 sets of imputed data, each with 15,325 observations. Standard errors are in parentheses.
Notes: Each model runs regressions on 5 sets of imputed data, each with 15,325 observations. Standard errors are in parentheses.
Notes: Each model runs regressions on 5 sets of imputed data, each with 15,325 observations. Standard errors are in parentheses.
Notes: Each model runs regressions on 5 sets of imputed data, each with 15,325 observations. Standard errors are in parentheses.
Notes: Each model runs regressions on 5 sets of imputed data, each with 15,325 observations. Standard errors are in parentheses.
Notes: Each model runs regressions on 5 sets of imputed data, each with 15,325 observations. Standard errors are in parentheses.
Notes: Each model runs regressions on 5 sets of imputed data, each with 15,325 observations. Standard errors are in parentheses.
Notes: Each model runs regressions on 5 sets of imputed data, each with 15,325 observations. Standard errors are in parentheses.
Notes: Each model runs regressions on 5 sets of imputed data, each with 15,325 observations. Standard errors are in parentheses.
Notes: Each model runs regressions on 5 sets of imputed data, each with 15,325 observations. Standard errors are in parentheses.
Notes: Each model runs regressions on 5 sets of imputed data, each with 15,325 observations. Standard errors are in parentheses.
Notes: Each model runs regressions on 5 sets of imputed data, each with 15,325 observations. Standard errors are in parentheses.
***p<.001; **p<.01; *p<.05; ✝p<.10 ***p<.001; **p<.01; *p<.05; ✝p<.10 ***p<.001; **p<.01; *p<.05; ✝p<.10 ***p<.001; **p<.01; *p<.05; ✝p<.10 ***p<.001; **p<.01; *p<.05; ✝p<.10 ***p<.001; **p<.01; *p<.05; ✝p<.10
What accounts for these race/ethnicity patterns? The first significant predictor is test scores. When I controlled for achievement, I found that the black students who previously were significantly more likely to agree they were not working hard were actually
significantly less likely than white students to be in the “student no, teacher no” category. This means that the black students who are more likely than white students to agree with their teachers that they are not working hard are low-performing students as measured by standardized tests. I expected some of the negative Asian coefficient to be absorbed by the effect of test scores because on average, Asian students do perform at slightly higher levels than white students on standardized math tests (National Center for Education Statistics). I expected that if Asian and white students’ test scores were held to a constant level, Asian students’ significant underrepresentation in the “student no, teacher no” category would disappear. However, even after controlling for test scores, Asian students are still 33 percent less likely (p<.01) than white students to be in the “student no, teacher no” category. This result may reflect a latent cultural norm that discourages Asian students from not working hard and/or a positive teacher bias for Asian students, drawing from the stereotype of the “model minority” (Lee, 2009).
Test scores provide a somewhat objective “check” on the accuracy of the teacher
“student no, teacher no” category. Model 3 in Table 5 shows that as SES increases, students are less likely to be in the “no, no” category. Female and college prep students are also less likely than are males and general track students to agree that they are not working hard. These three factors account for all of the racial and ethnic variation in the “no, no” category except for Asian students, which still show a significantly decreased log odds of being in the “no, no” category.
Table 6. Racial/Ethnic Distribution of Perception of Teacher Insult Table 6. Racial/Ethnic Distribution of Perception of Teacher Insult Table 6. Racial/Ethnic Distribution of Perception of Teacher Insult Table 6. Racial/Ethnic Distribution of Perception of Teacher Insult Table 6. Racial/Ethnic Distribution of Perception of Teacher Insult Table 6. Racial/Ethnic Distribution of Perception of Teacher Insult
Strongly Agree Agree Disagree DisagreeStrongly Total
White 1,207 2.3% 5,150 9.9% 30,773 59.2% 14,854 28.6% 51,993 100%
Black 3.0%356 1,256 10.4 53.2%6,400 33.4%4,026 12,038 100%
Hispanic 3.9%510 12.4%1,640 7,4100 56.0% 27.8%3,677 13,237 100%
Asian 2.7%236 10.6%924 60.5%5,275 26.2%2,279 8,714 100%
American Indian/ Multiracial
165
3.2% 13.0%675 58.2%3,025 25.7%1,334 5,199 100%
Total 2,474 2.7% 10.6%9,654 52,883 58.0% 26,170 28.7% 91,181 100%
Note: All frequencies calculated using complete set of imputed data. Note: All frequencies calculated using complete set of imputed data. Note: All frequencies calculated using complete set of imputed data. Note: All frequencies calculated using complete set of imputed data.
Additional analyses reveal an interesting relationship between school track placement and the likelihood of being in the “student no, teacher no” category for black and Hispanic students. As model 4 in Table 5 shows, generally, college preparatory track placement reduces the likelihood of students agreeing with their teacher that they do not work hard. However, the interaction between student’s race/ethnicity and track placement shows a significant positive coefficient for black students. This positive coefficient indicates that the racial difference between blacks and whites in the likelihood of being in the “no, no”
category is especially strong for those in the college prep track. A similarly positive relationship exists for Hispanic students, though it is just shy of significance at p=.059.
students to agree they are not working hard. Specifically, black college prep students are about 16 percent likely to agree that they are not working hard, versus an approximately 11.6 percent probability for white college prep students. However, in the general track, black and white students are both about 26 percent likely to agree with their teachers that they are not working hard. This interaction effect accounts for all of the significance of the black coefficient, suggesting that black students’ overrepresentation in the “no, no” category is mostly driven by the black students in the college prep program.
Once SES, gender, and other controls are considered in the model, the significant interaction of college prep track placement and race is rendered insignificant for black students. Within gender groups, predicted probabilities suggest that black students in the college prep program show a higher likelihood than their white counterparts of being in the “no, no” category, but these differences are not significant.17 Results of this final Model 5 suggest that black college prep students’ overrepresentation in the “no, no” category is driven mostly by males of relatively low socioeconomic status.
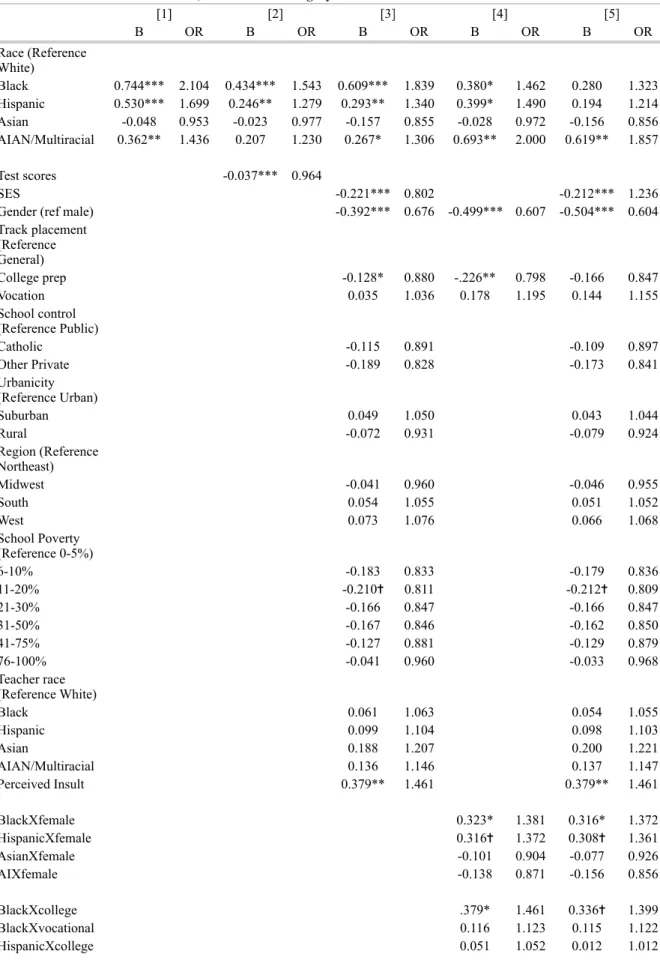
Table 7. Predictors of “Student Yes, Teacher No” Category Likelihood Table 7. Predictors of “Student Yes, Teacher No” Category Likelihood Table 7. Predictors of “Student Yes, Teacher No” Category Likelihood Table 7. Predictors of “Student Yes, Teacher No” Category Likelihood Table 7. Predictors of “Student Yes, Teacher No” Category Likelihood Table 7. Predictors of “Student Yes, Teacher No” Category Likelihood Table 7. Predictors of “Student Yes, Teacher No” Category Likelihood Table 7. Predictors of “Student Yes, Teacher No” Category Likelihood Table 7. Predictors of “Student Yes, Teacher No” Category Likelihood Table 7. Predictors of “Student Yes, Teacher No” Category Likelihood Table 7. Predictors of “Student Yes, Teacher No” Category Likelihood
[1]
[1] [2][2] [3][3] [4][4] [5][5]
B OR B OR B OR B OR B OR
Race (Reference White)
Black 0.744*** 2.104 0.434*** 1.543 0.609*** 1.839 0.380* 1.462 0.280 1.323
Hispanic 0.530*** 1.699 0.246** 1.279 0.293** 1.340 0.399* 1.490 0.194 1.214
Asian -0.048 0.953 -0.023 0.977 -0.157 0.855 -0.028 0.972 -0.156 0.856
AIAN/Multiracial 0.362** 1.436 0.207 1.230 0.267* 1.306 0.693** 2.000 0.619** 1.857
Test scores -0.037*** 0.964
SES -0.221*** 0.802 -0.212*** 1.236
Gender (ref male) -0.392*** 0.676 -0.499*** 0.607 -0.504*** 0.604
Track placement (Reference General)
College prep -0.128* 0.880 -.226** 0.798 -0.166 0.847
Vocation 0.035 1.036 0.178 1.195 0.144 1.155
School control (Reference Public)
Catholic -0.115 0.891 -0.109 0.897
Other Private -0.189 0.828 -0.173 0.841
Urbanicity (Reference Urban)
Suburban 0.049 1.050 0.043 1.044
Rural -0.072 0.931 -0.079 0.924
Region (Reference Northeast)
Midwest -0.041 0.960 -0.046 0.955
South 0.054 1.055 0.051 1.052
West 0.073 1.076 0.066 1.068
School Poverty (Reference 0-5%)
6-10% -0.183 0.833 -0.179 0.836
11-20% -0.210✝ 0.811 -0.212✝ 0.809
21-30% -0.166 0.847 -0.166 0.847
31-50% -0.167 0.846 -0.162 0.850
41-75% -0.127 0.881 -0.129 0.879
76-100% -0.041 0.960 -0.033 0.968
Teacher race (Reference White)
Black 0.061 1.063 0.054 1.055
Hispanic 0.099 1.104 0.098 1.103
Asian 0.188 1.207 0.200 1.221
AIAN/Multiracial 0.136 1.146 0.137 1.147
Perceived Insult 0.379** 1.461 0.379** 1.461
BlackXfemale 0.323* 1.381 0.316* 1.372
HispanicXfemale 0.316✝ 1.372 0.308✝ 1.361
AsianXfemale -0.101 0.904 -0.077 0.926
AIXfemale -0.138 0.871 -0.156 0.856
HispanicXvocation
al -0.375 0.687 -0.349 0.705
AsianXcollege 0.052 1.053 0.063 1.065
AsianXvocational -0.101 0.904 -0.090 0.914
AI/MXcollege -0.440 0.644 -0.443 0.642
AI/MXvocational -1.030* 0.357 -1.046* 0.351
Constant -1.900***-1.900*** -0.015 -1.590** -1.582*** -1.541***
Observations 15,325 15,325 15,325 15,325 15,325
Notes: Each model runs regressions on 5 sets of imputed data, each with 15,325 observations. Standard errors are in parentheses.
Notes: Each model runs regressions on 5 sets of imputed data, each with 15,325 observations. Standard errors are in parentheses.
Notes: Each model runs regressions on 5 sets of imputed data, each with 15,325 observations. Standard errors are in parentheses.
Notes: Each model runs regressions on 5 sets of imputed data, each with 15,325 observations. Standard errors are in parentheses.
Notes: Each model runs regressions on 5 sets of imputed data, each with 15,325 observations. Standard errors are in parentheses.
Notes: Each model runs regressions on 5 sets of imputed data, each with 15,325 observations. Standard errors are in parentheses.
Notes: Each model runs regressions on 5 sets of imputed data, each with 15,325 observations. Standard errors are in parentheses.
Notes: Each model runs regressions on 5 sets of imputed data, each with 15,325 observations. Standard errors are in parentheses.
Notes: Each model runs regressions on 5 sets of imputed data, each with 15,325 observations. Standard errors are in parentheses.
Notes: Each model runs regressions on 5 sets of imputed data, each with 15,325 observations. Standard errors are in parentheses.
Notes: Each model runs regressions on 5 sets of imputed data, each with 15,325 observations. Standard errors are in parentheses.
***p<.001; **p<.01; *p<.05; ✝p<.10 ***p<.001; **p<.01; *p<.05; ✝p<.10 ***p<.001; **p<.01; *p<.05; ✝p<.10 ***p<.001; **p<.01; *p<.05; ✝p<.10
“Student Yes, Teacher No:” Hypothesis 2 predicted that Black and Hispanic students would be more likely than white and Asian students to rate their work effort highly when their teachers rate it poorly. I did find support for this hypothesis. In the race-only model of Table 7, we see that black students are more than twice as likely as white students to overrate their work effort relative to their teachers, whereas Hispanic students are about 70 percent more likely to overrate their work effort. American Indian/multiracial students are
approximately 44 percent more likely than whites to overrate their work effort, and Asian students are no more likely than white students to overrate their work effort.
highly performing test takers but still do not exhibit the soft skills teachers expect of “hard workers,” or the teachers of these remaining students are colored by some racially-based bias.
Like in the “no, no” category, significant predictors of these racial and ethnic patterns in the “student yes, teacher no” category include class, gender, and track placement. Model 3 in Table 7 shows that together, SES, track placement, and gender account for some of the variation in the “student yes, teacher no” category. For black students the odds are reduced from 2.1 times as likely to 84 percent more likely. For Hispanic students the odds drop from 70 to 34 percent more likely, and for American Indian/multiracial students the odds drop from 44 to 31 percent more likely than white students to overrate work effort. Though track placement and gender are significant factors in the model, most of the effect is driven by SES, which is consistent with a class-based cultural capital argument. However, in the basic predictors model, much significant variation is still unexplained.
to be in the “student yes, teacher no” category if they are in the vocational track than if they are in the general track.
In terms of gender, generally, being female is negatively associated with an increased likelihood of overrating student effort, but an interaction between race/ethnicity and gender shows the opposite for blacks and Hispanics (though the relationship for Hispanics is just shy of significance at p=.074). In other words, whereas in the “no, no” category, males were still overall more likely to agree they were not working hard versus females regardless of race, in the “student yes, teacher no” category, black students are more likely to overrate their effort than are white students regardless of gender. For example, in the college prep track, the probability that a black female is overrating her work effort is about 22.7 percent. Compare this probability to the 9 percent probability that a white female or the 14 percent probability that a white male is overrating his work effort. In the general track, a black female is 20 percent likely to be overrating her effort, whereas a white female is 11 percent likely, and a white male is 17 percent likely to overrate work effort. In the vocational track, a black female is 25 percent likely to overrate her work effort, whereas a white female in the same track is 13 percent, and a white male is 19.7 percent likely to overrate. Finally, in all tracks black males are more likely to overrate their efforts than are black females, but the difference in percentage points is slight: a 3.2 point difference in the college prep track and a 3 point difference in the general and vocational tracks.
yes, teacher no” category, but they do not account for significant overrepresentation of black girls in the “student yes, teacher no” category or significant overrepresentation of American Indian/multiracial vocational track students in the “student yes, teacher no” category. V. DISCUSSION
In this study, I attempted to find support for either cultural capital mismatch or oppositional culture among minority students by comparing student perceptions of their effort with their teachers’ perceptions of their effort. If students thought they were working hard, but their teachers disagreed, cultural capital mismatch could explain the difference of opinion. If students and teachers both agreed the student was not working hard, then evidence might point toward the existence of oppositional culture.
Evidence Supporting Oppositional Culture
structure, still reflect a cultural reverence and commitment to education. The results from this study are not consistent with the theory that Hispanic students exhibit oppositional culture; however, Portes’ and Zhou’s work suggests that oppositional culture among Hispanic students is conditional upon environmental factors such as proximity to a recently arriving in-group immigrant community, proximity to a white upwardly mobile community, and generational status. Additionally, it is unclear as to whether the oppositional culture Portes and Zhou describe is specific to Mexican-Americans or Hispanics in general. These are all variables that cannot be ascertained from this data set and therefore cannot be explored here. However, future empirical research should assess the extent to which oppositional culture, however conditional, may be exhibited among Hispanic youths in a local or national context.
Though I found no support for oppositional culture among the general population of Hispanic students, I did find conditional support for oppositional culture among black math students, and that condition is track placement. Despite theoretical predictions, black math students in the college prep track are more likely than white students to agree with their teachers that they are not working hard. But there are two other conditions to this
phenomenon as well--being male and coming from a low socioeconomic status. In other words, if SES were equal for all black and white students in the college prep track, black males would be most likely to display oppositional culture, and white males would be next. Black college prep females would be third, white females would be least likely to exhibit oppositional culture.
potential for success. So why then, would black students in the college prep math program be the only significant group of black students to exhibit oppositional culture, when
theoretical wisdom would predict oppositional culture in the lowest track? One argument may come from the impact of structural inequality, reflecting an intersection of oppositional culture with cultural capital mismatch. Because black students in the college prep math program tend to be disadvantaged relative to their white peers in terms of SES, black students may not have the resources or skills they need to effectively compete with their white
classmates. Annette Lareau (2003) argues in Unequal Childhoods that students raised in lower class households are often less adept at interacting with their schools, teachers, and other institutions compared to middle class children, who are at home taught the type of communication and critical thinking skills that schools and teachers have come to expect. This would explain why teachers might rate black students in the college prep program lower than white students who are better able to perform according to the standards of the “middle class hegemony” (Farkas, et. al. 1990).