Microfluidic Array with Integrated Oxygenation Control for
Real-Time Live-Cell Imaging: Effect of Hypoxia on Physiology of
Microencapsulated Pancreatic Islets
Mohammad Nourmohammadzadeh1,2,*, Joe F. Lo3,*, Matt Bochenek1,2, Joshua E. Mendoza-Elias1,2, Qian Wang1,2, Ze Li1,2, Liyi Zeng1, Merigeng Qi1, David T. Eddington2, José
Oberholzer1,2, and Yong Wang1,2
1Department of Surgery/Transplant, University of Illinois at Chicago, Chicago, IL. 60612 2Department of Bioengineering, University of Illinois at Chicago, Chicago, IL. 60607
3Department of Mechanical Engineering, University of Michigan at Dearborn, Dearbor.Michigan.
48128
Abstract
In this report, we present a novel microfluidic islet array based on a hydrodynamic trapping principle. The lab-on-a-chip studies with live-cell multiparametric imaging allow understanding of physiological and pathophysiological changes of microencapsulated islets under hypoxic
conditions. Using this microfluidic array and imaging analysis techniques, we demonstrate that hypoxia impairs the function of microencapsulated islets at single islet level, showing a heterogeneous pattern reflected in intracellular calcium signaling, mitochondrial energetic, and redox activity. Our approach demonstrates an improvement over conventional hypoxia chambers that is able to rapidly equilibrate to true hypoxia levels through the integration of dynamic oxygenation. This work demonstrates the feasibility of array-based cellular analysis and opens up new modality to conduct informative analysis and cell-based screening for microencapsulated pancreatic islets.
Keywords
Microfluidic; Hydrodynamic trap; Islet trapping array; Microencapsulation; Pancreatic islets of Langerhans; Hypoxia; Calcium; Mitochondrial potential; Insulin secretion
INTRODUCTION
Human islet transplantation is a promising therapy for patients with Type I diabetes mellitus (T1DM)1, 2. Islet transplantation provides tight glycemic control without the need for exogenous insulin. However, islet transplantation requires immunosuppression that has unwanted side effects for both the patient and islet graft. The immunoisolation of islets in microcapsules has been heavily investigated to avoid immunosuppression. If successful, this strategy would have a significant impact on islet transplant outcomes. Despite initial promising results in both small animal and non-human primate transplant models, only short-term and partial graft function have been achieved in clinical trials3–5. Several factors have been proposed to be responsible for graft loss of microencapsulated islets: insufficient
NIH Public Access
Author Manuscript
Anal Chem. Author manuscript; available in PMC 2014 December 03.
Published in final edited form as:
Anal Chem. 2013 December 3; 85(23): 11240–11249. doi:10.1021/ac401297v.
NIH-PA Author Manuscript
NIH-PA Author Manuscript
material biocompatibility, limited immunoprotective properties, inadequate permissibility of nutrient, hypoxia, and suboptimal insulin release 6, 7.
While research has focused heavily on material biocompatibility and immune-protection, a comprehensive understanding of physiological or pathophysiological changes of
microencapsulated islets is often constrained due to the availability of research tools. Functionality of microencapsulated islets is typically determined using glucose static incubation (GSI), where microencapsulated islets are challenged with glucose and the “bulk” insulin secreted is then quantified using ELISA. Oxygen consumption rates (OCR) of microencapsulated islets are often measured using a Clark’s electrode inserted in a glass chamber connected to a data acquisition system 8. However, most of these assays are either static or examine a single parameter at a time and hence cannot be used to fully investigate the complexity of physiological and pathophysiological changes of encapsulated islets. There has been growing interest in the development of microfluidic platforms that allow for the manipulation of the microenvironment of individual cells and control stimuli for the study of complex intracellular processes 9, 10. Recently, several microfluidic studies have attempted to exploit high-throughput live-cell assays at single cell, including studies in drug-induced cardiotoxicity, anti-cancer drug screening, and cellular responses to electrically controlled dosing 11–14. Additionally, the integrated microfluidics have also been applied to comprehensive and systematic studies of cell signaling and cancer biomarkers 15. These studies show great promise and highlight unique advantages for this technology: simplicity in execution, robustness in data results, and inexpensive cost. Microfluidics also offer advantages in scalability and is emerging for scalable imaging tools in precisely controlled and dynamic microenvironments.
In order to achieve single-cell and real-time imaging, the microfluidics must be designed to enable precise analysis of an individual cell in a specific location, such as an array, with minimal shear force and cell stress. Hydrodynamic-based microfluidics have been developed to confine cells with high precision16–19. Using the hydrodynamic trapping approach, cells are directed along the fluidic path of least resistance to areas of constriction, where they are then held in place by flow pressure. This approach allows the sequential trapping of cells with consistent trapping efficacy. Here, we describe a microfluidic array based on the same principle, which allows for the entrapment and positioning of microencapsulated islets in an array. Furthermore, the device can be used to perform real-time fluorescence imaging of key insulin stimulation-secretion coupling factors at the single encapsulated islet. An
oxygenation channel was then integrated to study the pathophysiological changes under hypoxia; one factor proposed to contribute to the graft failure of microencapsulated islet. This work establishes a novel and reliable approach to perform high-content analysis of islet cells in the field of microencapsulation and islet transplantation.
EXPERIMENTAL SECTION
Design idea and trapping principleThis microfluidic array is a three-layer, polydimethylsiloxane (PDMS) device as
schematically shown and photoimage shown Figure 1A and 1B. The device design is based on the hydrodynamic trapping principle, which was first described by Tan and Takeuchi 20 with some dimensional modifications in consideration of capsule diameter range (400-550 μm). The top layer consists of four areas: 1.) an inlet channel for islet loading and fluid delivery (2 mm in diameter); 2.) a serpentine channel (width = 575 μm and height = 600 μm) to facilitate cell loading by dampening pressure and arranging particles prior to the trapping of microencapsulated islets; 3.) a capsule-trapping array composed of square-wave shaped loop channels superimposed onto a straight channel. An array of U-cup shape kinetic
NIH-PA Author Manuscript
NIH-PA Author Manuscript
pockets along the straight channel is designed to trap the microcapsules. The U-cup diameter of the pocket is 550 μm and has a depth of 450 μm. There is an exit flow aperture at the apex of the U-cup with a reduction in width (175 μm), which we refer to as a straight channel. When flow carries a capsule to the junction between the U-cup and loop channel, the flow encounters less resistance in the straight channel through the unoccupied cup. As a capsule trapped in this cup, the resistance is increased in the straight channel and the flow is redirected into the loop channel. This flow then carries subsequent capsule towards the next trap, iterating the trapping downstream throughout the device. 4.) Finally, there is an outlet to collect perifusate waste. The middle layer is a 100 μm gas-permeable PDMS membrane for oxygen control designed based on our previous study 21. The bottom layer is a gas channel for delivery of oxygen (2 mm inlet diameter and 300 μm in height). More information about calculation of pressure drop for designing geometry was in Supplementary Information (SI).
Device fabrication
The microfluidic array device was fabricated using the soft lithography technique as described previously 22, 23. (Please see the Device fabrication in the SI).
Computer simulation
2D computational fluid dynamics (CFD) simulations were performed in COMSOL
Multiphysics 4.2 (COMSOL, MA) using a ‘stationary laminar flow’ model. All sub-domains were assigned with a density of ρ = 1000 kg/m3 and a dynamic viscosity of η= 0.001 Pa · s (for water at 20 °C). No-slip boundary conditions were applied to the walls of the channels. The height of all channels was 600 μm. The complete mesh consisted of 79561 elements. Error tolerance was 10−6.
Device oxygenation validation
An optical sensor (Neofox, Ocean optics, FL) was used to determine the oxygen concentration. The oxygen probe uses photoluminescence-quenching of a ruthenium compound to detect oxygen molecules and has a reaction time of 15-20 s in gaseous phase and 30-45 s in aqueous media. Two-point sensor calibration was carried out according to the manufacturer’s instructions, with all gas mixtures balanced with nitrogen consisting of 0% O2/5% CO2 and 21% O2/5% CO2 as references for 0% of O2 and 21% of O2, respectively. Oxygenation efficacy in the microfluidic channel was evaluated in both gaseous (diffused) and aqueous (dissolved) modes in either an alternating pattern of 5%– 21% of O2 or a step-down pattern of 21-10-5-1% of O2.
Islet isolation
Rat and human islets were isolated according to a previously described protocol 24, 25, 26, 27 and detailed information was described in the SI.
Encapsulation in Ca2+/Ba2+ Alginate Microbeads
Encapsulation of both rat and human islets in Ca2+/Ba2+ alginate microbeads was performed using previously described 28 and the detailed information was described in the SI.
Device preparation and cell loading
The microfluidics was first prepared by flowing 100% of ethanol for 5 min to prevent potential bubble formation and then rinsed with distilled water thoroughly. Before loading cells, the device was filled with Krebs-Ringer buffer containing 2 mM glucose (KRB2) and then positioned on a glass heating stage at 37 ºC. In order to allow high trapping efficacy
NIH-PA Author Manuscript
NIH-PA Author Manuscript
and minimize shear force on microcapsulated islets, both islets and fluids were delivered into the device using a hydrostatic pressure-driven method. First, a 1 mL pipette tip was inserted into the inlet and filled with KRB2 up to 50 mm in height (50 mm higher than that of the outlet) while the outlet was clamped. The microencapsulated islets were hand picked under a dissecting microscope using a P20 pipette and transferred into the loading pipette. The outlet was then unclamped, which allowed the fluid and capsules in the inlet to flow into the device by gravity. Using this method, one hundred capsules were arrayed in less than 30 s.
Fluorescence imaging
All imaging experiments were conducted according to previously described methods 23, 29. For simultaneous fluorescence imaging, microencapsulated islets were labeled with ratiometric fluorescent dye Fura-2/AM (Fura-2, Molecular Probes, CA) to determine intracellular calcium levels ([Ca++]i). Fluorescent Rhodamine 123 dye (Rh123, Sigma, MO) was used to determine changes in mitochondrial potentials (ψm). Due to the speed limitation of the microscope, all imaging studies were conducted on 25 of the 100 encapsulated islets in the array to demonstrate proof-of-concept. The information of the fluorescence imaging, stimulation protocol, and oxygenation protocol used was described in the SI.
Statistical analysis
All data were expressed in mean ± SD. For multiple comparisons, one-way ANOVA was used and then confirmed with bonferroni post-test. P-values < 0.05 were regarded as statistically significant.
RESULTS AND DISCUSSION
Evaluation of flow dynamicsCOMSOL flow-velocity results within the microchannel and the region of the capsule immobilization site were shown in Figure 2A with a close-up view of the velocity
distribution and velocity streamlines around the trapping site (U-cup shape kinetic pockets). A laminar inflow boundary condition with a flow rate of 250 JL/min was applied to the inlet and the boundary condition at the outlets was assigned with a pressure of 0 Pa. As observed, the highest flow velocity was located in the immobilization site, while there was a decrease in flow-velocity from the trapping site to the loop channel. From the close-up view (Fig. 1A), the velocity streamlines indicated that there was a partially diverted liquid into the immobilization site generated by a hydrodynamic force and would allow capsules to flow towards the immobilization sites. A particle occupying the U-cup pocket increases the flow resistance that allows flow to bypass the U-cup pocket and directs flow into the loop channels (Fig. 2B).
Device oxygenation capability
In order to expose the microencapsulated islets to a controlled hypoxia, a thin (100 μm thickness) PDMS membrane was added to the microfluidics (Fig. 1A) as previously published 21, 30. The added membrane allowed for dynamic gas delivery independent of the flow control. It allowed for more precise temporal control of oxygenation over the target cells when compared to traditional perifusion methods. Using inflow to carry dissolved oxygen to cells had low efficacy in the modulation of oxygen concentration and is
operationally cumbersome. Our design principle allowed for controlled delivery of oxygen directly into the targeted encapsulated islet without interfering with flow and provided a much improved method to study hypoxia than has been previously achieved (see the SI for further information of the device oxygenation capability).
NIH-PA Author Manuscript
NIH-PA Author Manuscript
Loading and trapping efficacy of microcapsulated islets
Microfluidic arraying through differential hydrodynamic fluidic resistance has been proven highly reliable and efficient in literature 16, 31. Additionally, this passive trapping
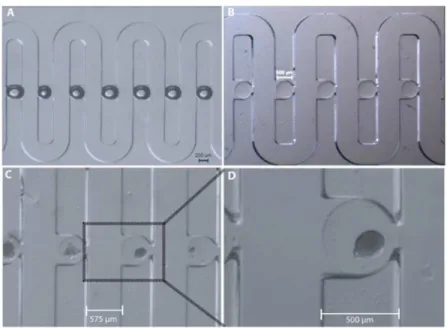
mechanism is less sensitive to flow fluctuations caused by either spontaneous gas bubbles or switching of solutions. Our design for hydrodynamic confinement of microencapsulated islets was based on the same principle. As shown in both Figure 3A and 3B, both artificially created air bubbles and empty alginate capsules (D = 500 μm), were successfully arrayed in the microfluidic array with a high trapping efficiency (~ 99%). In Figure 3C and 3D, it was shown that the microcapsulated islets were also precisely positioned in the trap sites without any deformation of the capsules, also shown in SI V1. Furthermore, the trapped
microencapsulated islets could be easily released for further analysis, such as immunohistochemistry (SI V1), by flow inversion.
The responses of microcapsulated islets to insulin secretagogues under normoxia are heterogeneous
The dynamic visualization of physiological and pathophysiological changes in individual encapsulated islets has clear advantages over existing “static and bulk” assays and can provide detailed spatiotemporal information in a quantified manner. The microencapsulation process is a very complex and multi-step process. Each manipulation step may be stressful and even detrimental to the viability of an islet. The current standard assay to determine the function and viability of a microcapsulated islet provide limited information on the
physiological or pathophysiological changes of microencapsulated islets. Using this microfluidic-based islet-trapping array, we can observe individual islet responses to secretagogues, focusing on several key insulin stimulator-secretion coupling pathways. Insulin secretion is controlled by β-cell electrical activity, metabolic events, and ion
signaling and displays biphasic and pulsatile kinetic profiles in response to changes in blood glucose. In short, glucose catabolism generates ATP through the mitochondrial tricarboxylic acid cycle, which consequently closes ATP-sensitive K+ channels, initiates plasma
membrane depolarization and increases [Ca2+]i via voltage-dependent calcium channels. This glucose-stimulated increase in [Ca2+]i triggers the fusion of insulin granules with the cell membrane and, subsequently, results in the exocytosis of insulin.
Microencapsulated rat islets, in response to 14 mM glucose under normoxia (21% O2), showed heterogeneous [Ca2+]i changes with a mean change of 105.82% ± 1.51 (max: 108.67 % and min: 103.68%). Microencapsulated rat islets in response to 30 mM KCI stimulation also showed heterogeneous [Ca2+]i with a mean change of 110.09% ± 2.44 (max: 115.67% and min: 107.54%). For microencapsulated rat islets in response to 14 mM glucose, ψm mean change was 82.87% ± 3.06 (max: 86.78% and min 76.36%) (Fig. 5) (For Fig. 4 & 5, n = 65 from three experiments).
Microencapsulated rat and human islets in response to either 14 mM or 25 mM glucose showed heterogeneous changes in NAD(P)H autofluorescence with a means of 110.28% ± 0.95 (max: 111.54% and min: 108.02%) for rat islets and a means of 106.59% ± 0.95 (max: 108.01% and min: 104.40%) for human islets. (Fig. 6. n = 65 from three experiments). The islet array integrated with live-cell imaging techniques can provide more detailed spatiotemporal information of an individual islet response to extracellular stimulators. In addition to serving as a tool to determine the functionality and viability of
microencapsulated islets, the array may also be used in the future as a screening tool for therapeutic screening in order to improve the survival and function of microencapsulated islets.
NIH-PA Author Manuscript
NIH-PA Author Manuscript
Hypoxia impaired the function of microcapsulated islets
Hypoxia is widely considered to be one of the primary factors associated with the functional loss of encapsulated islets 3, 32, 33 and has also been linked to the immunoisolation failure of microencapsulation 3. Isolated islets are exposed to a hypoxic environment at many levels: (i) isolated islets have a disrupted vascular network and are dependent on diffusion for oxygen supply 34–36, (ii) the microencapsulation process may further aggravate islet hypoxia by both preventing islet revascularization and increasing the oxygen diffusional distance due to capsule sizes that are often larger than 500 μm 37; (iii) the intraperitoneal space, a
common transplant site for microencapsulated islets, has a low oxygen tension (5-5% O2), which is significantly lower than the in situ pancreas 38. Hypoxia may also facilitate the attraction of macrophages and subsequently cause cell overgrowth on the microcapsule 3, 33. Here, we further investigated the impact of hypoxia on [Ca2+]i signaling, m changes, and NAD(P)H of microencapsulated islets. As shown in Figure 7A and B, the [Ca2+]i of microencapsulated human islets in response to glucose were oxygen concentration-dependent and were inhibited by hypoxia. Under normoxia (21% O2), the average [Ca2+]i
increased by 118.28% ± 0.85 in response to 25 mM glucose, while hypoxic concentrations decreased [Ca2+]i: 108.10% ± 0.38 in 10% O2, 104.04% ± 0.242 in 5% O2, and 102.51% ±
0.15 in 1% O2 (p < 0.001 when 21% O2 vs. the three hypoxic groups as well as p < 0.001
when 10% vs. 5% and 1%) (n = 65 from three experiments for each oxygen condition). Similarly, ψm changes, often used as an indicator of cellular energetic status, were also
inhibited in an oxygen concentration-dependent manner (21-10-5-1%): 83.70% ± 0.59, 92.71% ± 0.38, 95.72% ± 0.37, and 97.79% ± 0.17 (p < 0.001 when comparing 21% vs. all three hypoxic groups; p < 0.001 when comparing 10% vs. 5% and 1%, and p < 0.01 when comparing 5% and 1%) as shown in Figure 8A an 8B (n = 65 from three experiments for each oxygen condition).
The pyridine nucleotide NAD(P)H is required to drive a number of cellular processes. Recently, these co-factors have also been shown to be involved in physiological functions of aging, oxidative stress, [Ca2+]i homeostasis, ROS, and cell death. Perturbed NADPH can promotes mitochondrial permeability transition pore opening, and increases sensitivity to ROS and apoptosis. NADPH has also been shown to participate in insulin release process in β-cells through transferring its reducing power to the electron transport chain, resulting in ATP synthesis that further influence ATP-dependent insulin secretion39–41. NAD(P)H imaging by autofluorescence is a quantitative measure of the combined redox signal from NADH and NADPH (referred to as NAD(P)H) with excellent spatiotemporal resolution. Therefore, a direct measurement of NAD(P)H can be used for providing insight of glucose metabolism and ROS.
Microencapsulated rat islets, under normoxia (21% O2) and 14 mM glucose, demonstrated a mean NAD(P)H change of 110.34% ± 0.64. Under hypoxic conditions, NAD(P)H changes were 112.54% ± 0.40 for 10% O2, 113.23 ± 0.61 for 5% O2 and 114.87% ± 0.60 for 1% O2, showing gradual increasing NAD(P)H in response to glucose (Fig. 9A) Statistical analysis showed that there were significant differences when comparing 21% vs. the three hypoxic groups (p < 0.05 for 10% O2, p < 0.01 for 5% O2, and p < 0.001 for 1% O2), Additionally, there was also a statistical difference between 10% O2 and 1% O2 (p <0.05) (n = 65 from three experiments for each oxygen condition).
CONCLUSION
Herein, the presented novel microfluidics can trap individual microencapsulated islets and allow for real-time live cell imaging. This device was achieved a high trapping efficacy for microencapsulated islets (~99%) with minimal physical stress to islets. The integration of
NIH-PA Author Manuscript
NIH-PA Author Manuscript
the gas modulation allowed for rapid membrane-diffused oxygenation of islet’s at the microscale-level. This provided a practical tool to study hypoxia on microencapsulated islets. We further investigated the hypoxia on β-cells and demonstrated that [Ca2+]i signaling, ψm, and β-cell redox status in response to insulin secretagogues were impaired under hypoxia. This is first report on real-time multiparametric imaging of metabolic changes of microcapsulated islets under hypoxia, a feat previously unachievable using either hypoxic chambers or existing microfluidic devices. In the future, this device may be used to improve the long-term function and viability of microencapsulated islets prior to
transplantation, such as intermittent hypoxia preconditioning (IH) or chemical
preconditioning. In a previous study, we successfully applied IH preconditioning (1 min/ 1min 5-21% cycling for 1 hr) to diminish hypoxic injury on naked islets and improved islet insulin secretion21. Additionally, this array laid out the groundwork for future applications in the area of islet microencapsulation and may potentially act as a screening tool for therapeutic screens. One application is to study capsule-islet-macrophage interaction. Although hypoxia is one of many reasons for islet graft failure, immune rejection and surface overgrowth (fibrosis) on microcapsule can also play a role. Therefore, it would be interesting to utilize the hypoxic device with modifications to understand capsule-islet-macrophage interactions.
Supplementary Material
Refer to Web version on PubMed Central for supplementary material.
Acknowledgments
This work was supported by NIH R01 DK091526 (JO) and Chicago Diabetes Project. DE is supported by Chicago Biomedical Consortium with support from the Searle Funds at The Chicago Community Trust. Joshua E. Mendoza-Elias is supported by: the American Diabetes Association (ADA) Clinical Scientist Training Program Grant (Grant Reference No.: 7-12-CST-03); the American Society of Transplant Surgeons (ASTS) Presidential Student Mentor
Grant.
References
1. Shapiro AM, Lakey JR, Ryan EA, Korbutt GS, Toth E, Warnock GL, Kneteman NM, Rajotte RV. N Engl J Med. 2000; 343:230–238. [PubMed: 10911004]
2. Gangemi A, Salehi P, Hatipoglu B, Martellotto J, Barbaro B, Kuechle JB, Qi M, Wang Y, Pallan P, Owens C, Bui J, West D, Kaplan B, Benedetti E, Oberholzer J. Am J Transplant. 2008; 8:1250– 1261. [PubMed: 18444920]
3. Calafiore R, Basta G, Luca G, Lemmi A, Montanucci MP, Calabrese G, Racanicchi L, Mancuso F, Brunetti P. Diabetes Care. 2006; 29:137–138. [PubMed: 16373911]
4. Tuch BE, Keogh GW, Williams LJ, Wu W, Foster JL, Vaithilingam V, Philips R. Diabetes Care. 2009; 32:1887–1889. [PubMed: 19549731]
5. Qi M, Strand BL, Morch Y, Lacik I, Wang Y, Salehi P, Barbaro B, Gangemi A, Kuechle J, Romagnoli T, Hansen MA, Rodriguez LA, Benedetti E, Hunkeler D, Skjak-Braek G, Oberholzer J. Artif Cells Blood Substit Immobil Biotechnol. 2008; 36:403–420. [PubMed: 18925451]
6. Morch YA, Donati I, Strand BL, Skjak-Braek G. Biomacromolecules. 2006; 7:1471–1480. [PubMed: 16677028]
7. Vaithilingam V, Oberholzer J, Guillemin GJ, Tuch BE. Am J Transplant. 2010; 10:1961–1969. [PubMed: 20645943]
8. Cornolti R, Figliuzzi M, Remuzzi A. Cell Transplant. 2009; 18:195–201. [PubMed: 19499707] 9. Mitchell P. Nat Biotechnol. 2001; 19:717–721. [PubMed: 11479557]
10. Whitesides GM. Nature. 2006; 442:368–373. [PubMed: 16871203]
11. Kim MJ, Lee SC, Pal S, Han E, Song JM. Lab Chip. 2011; 11:104–114. [PubMed: 21060932]
NIH-PA Author Manuscript
NIH-PA Author Manuscript
12. Liu D, Wang L, Zhong R, Li B, Ye N, Liu X, Lin B. J Biotechnol. 2007; 131:286–292. [PubMed: 17706314]
13. McKenna BK, Evans JG, Cheung MC, Ehrlich DJ. Nat Methods. 2011; 8:401–403. [PubMed: 21478861]
14. Lim KH, Park J, Rhee SW, Yoon TH. Cytometry A. 2012; 81:691–697. [PubMed: 22674831] 15. Wlodkowic D, Skommer J, Darzynkiewicz Z. Cytometry A. 2008; 73:496–507. [PubMed:
18260152]
16. Wlodkowic D, Faley S, Zagnoni M, Wikswo JP, Cooper JM. Anal Chem. 2009; 81:5517–5523. [PubMed: 19514700]
17. Thorsen T, Maerkl SJ, Quake SR. Science. 2002; 298:580–584. [PubMed: 12351675] 18. Di Carlo D, Lee LP. Anal Chem. 2006; 78:7918–7925. [PubMed: 17186633]
19. Skelley AM, Kirak O, Suh H, Jaenisch R, Voldman J. Nat Methods. 2009; 6:147–152. [PubMed: 19122668]
20. Tan WH, Takeuchi S. Lab Chip. 2008; 8:259–266. [PubMed: 18231664]
21. Lo JF, Wang Y, Blake A, Yu G, Harvat TA, Jeon H, Oberholzer J, Eddington DT. Anal Chem. 2012; 84:1987–1993. [PubMed: 22296179]
22. Mohammed JS, Wang Y, Harvat TA, Oberholzer J, Eddington DT. Lab Chip. 2009; 9:97–106. [PubMed: 19209341]
23. Adewola AF, Lee D, Harvat T, Mohammed J, Eddington DT, Oberholzer J, Wang Y. Biomed Microdevices. 2010; 12:409–417. [PubMed: 20300858]
24. Avila JG, Wang Y, Barbaro B, Gangemi A, Qi M, Kuechle J, Doubleday N, Doubleday M, Churchill T, Salehi P, Shapiro J, Philipson LH, Benedetti E, Lakey JR, Oberholzer J. Am J Transplant. 2006; 6:2861–2870. [PubMed: 17062000]
25. Qi M, Barbaro B, Wang S, Wang Y, Hansen M, Oberholzer J. J Vis Exp. 2009 26. Qi M, Barbaro B, Wang S, Wang Y, Hansen M, Oberholzer J. J Vis Exp. 2009
27. Barbaro B, Salehi P, Wang Y, Qi M, Gangemi A, Kuechle J, Hansen MA, Romagnoli T, Avila J, Benedetti E, Mage R, Oberholzer J. Transplantation. 2007; 84:1200–1203. [PubMed: 17998877] 28. Qi M, Morch Y, Lacik I, Formo K, Marchese E, Wang Y, Danielson KK, Kinzer K, Wang S,
Barbaro B, Kollarikova G, Chorvat D Jr, Hunkeler D, Skjak-Braek G, Oberholzer J, Strand BL. Xenotransplantation. 2012; 19:355–364. [PubMed: 23198731]
29. Lee D, Wang Y, Mendoza-Elias JE, Adewola AF, Harvat TA, Kinzer K, Gutierrez D, Qi M, Eddington DT, Oberholzer J. Biomed Microdevices. 2012; 14:7–16. [PubMed: 21850483] 30. Mauleon G, Fall CP, Eddington DT. PLoS One. 2012; 7:e43309. [PubMed: 22905255]
31. Frimat JP, Becker M, Chiang YY, Marggraf U, Janasek D, Hengstler JG, Franzke J, West J. Lab Chip. 2011; 11:231–237. [PubMed: 20978708]
32. Basta G, Calafiore R. Curr Diab Rep. 2011; 11:384–391. [PubMed: 21826429]
33. de Groot M, Schuurs TA, van Schilfgaarde R. J Surg Res. 2004; 121:141–150. [PubMed: 15313388]
34. Menger MD, Jaeger S, Walter P, Feifel G, Hammersen F, Messmer K. Diabetes. 1989; 38(Suppl 1):199–201. [PubMed: 2463196]
35. Carlsson PO, Palm F, Andersson A, Liss P. Diabetes. 2001; 50:489–495. [PubMed: 11246867] 36. Mellgren A, Schnell Landstrom AH, Petersson B, Andersson A. Diabetologia. 1986; 29:670–672.
[PubMed: 3098614]
37. De Vos P, Vegter D, De Haan BJ, Strubbe JH, Bruggink JE, Van Schilfgaarde R. Diabetes. 1996; 45:1102–1107. [PubMed: 8690158]
38. Rother KI, Harlan DM. J Clin Invest. 2004; 114:877–883. [PubMed: 15467822]
39. Nunemaker CS, Dishinger JF, Dula SB, Wu R, Merrins MJ, Reid KR, Sherman A, Kennedy RT, Satin LS. PLoS One. 2009; 4(12):e8428. [PubMed: 20037650]
40. Heat E, Yaney GC, Corkey RF, Schultz V, Lue E, Deeney JT, Shirihai O, Tornheim K, Smith PJ, Corkev BE. Biochem J. 2007; 403(1):197–205. [PubMed: 17181533]
41. Luciani DS, Misler S, Polonsky KS. J Physiol. 2006; 572:379–392. [PubMed: 16455690]
NIH-PA Author Manuscript
NIH-PA Author Manuscript
Figure 1. Schematics and photoimage of the three-layer microfluidic array
(A) Schematics of the microfluidic islet array and structure dimension. (B) A photoimage of the microfluidic array.
NIH-PA Author Manuscript
NIH-PA Author Manuscript
Figure 2. Characterization of microfluidic islet trapping array fluid dynamics
(A) A 2D CFD simulation of flow-velocity inside microchannel and region of capsule
immobilization site and a closeup view of the velocity distribution and velocity streamlines around the trapping site. (B) 2D CFD simulation of flow-velocity inside microchannel and capsule immobilization site when the immobilization site is occupied.
NIH-PA Author Manuscript
NIH-PA Author Manuscript
Figure 3. The trapping and immobilization capability of the microfluidic array
(A) An array of artificial air bubbles. (B) An array of empty microcapsules (500 μm size). (C) An array of microencapsulated human islets (500 μm). (D) A close-view of single microencapsulated human islet.
NIH-PA Author Manuscript
NIH-PA Author Manuscript
Figure 4. Microencapsulated rat islets show a heterogeneous [Ca2+]i changes in response to glucose and KCI under 21% O2
Eight representative traces of [Ca2+]i of microencapsulated rat islets in response to 14 mM glucose followed by 30 mM KCl under 21% O2 (n = 65 from three experiments).
NIH-PA Author Manuscript
NIH-PA Author Manuscript
Figure 5. Microencapsulated rat islets show heterogeneous ψm changes in response to glucose and KCl under 21% O2
Eight representative traces of ψm changes of microcapsulated rat islets (n = 65 from three experiments).
NIH-PA Author Manuscript
NIH-PA Author Manuscript
Figure 6. Microencapsulated rat and human islets show heterogeneous NAD(P)H changes of in response to glucose under 21% O2
(A) Four representative traces of NAD(P)H changes of microcapsulated rat islets in response
to 14 mM glucose (n = 65 from three experiments). (B) Four representative traces of NAD(P)H changes of microcapsulated human islets in response to 25 mM glucose (n = 65 from three experiments).
NIH-PA Author Manuscript
NIH-PA Author Manuscript
Figure 7. Hypoxia impaired [Ca2+]i signaling of microencapsulated human islets
(A) Representative traces of [Ca2+]i of microencapsulated human islets in response to 25 mM glucose under hypoxic concentrations (B) Statistical analysis of [Ca2+]i changes under hypoxic concentrations (n = 65 from three experiments. *p< 0.001).
NIH-PA Author Manuscript
NIH-PA Author Manuscript
Figure 8. Hypoxia impaired ψm changes of microencapsulated human islets
(A) Representative traces of ψm changes of microencapsulated human islets in response to 25 mM glucose under hypoxic concentrations. (B) Statistical analysis of ψm changes under hypoxic concentrations. n = 65 from three experiments for each oxygen condition.*p < 0.001. **p <0.01.
NIH-PA Author Manuscript
NIH-PA Author Manuscript
Figure 9. Hypoxia impaired NAD(P)H levels of microencapsulated rat islets
(A) Representative traces of NAD(P)H of microencapsulated rat islets in response to 14 mM
glucose under hypoxic concentrations. (B) Statistical analysis of NAD(P)H changes under hypoxic concentrations. n = 65 from three experiments.


![Figure 4. Microencapsulated rat islets show a heterogeneous [Ca 2+ ] i changes in response to glucose and KCI under 21% O 2](https://thumb-us.123doks.com/thumbv2/123dok_us/8925285.2375338/12.918.270.746.97.571/figure-microencapsulated-islets-heterogeneous-changes-response-glucose-kci.webp)


![Figure 7. Hypoxia impaired [Ca 2+ ] i signaling of microencapsulated human islets](https://thumb-us.123doks.com/thumbv2/123dok_us/8925285.2375338/15.918.275.725.88.719/figure-hypoxia-impaired-ca-signaling-microencapsulated-human-islets.webp)


