Journal of Athletic Training 2017;52(3):175–185 doi: 10.4085/1062-6050-52.1.15
Óby the National Athletic Trainers’ Association, Inc
www.natajournals.org original research
Epidemiology of Sport-Related Concussions in High
School Athletes: National Athletic Treatment,
Injury and Outcomes Network (NATION), 2011–2012
Through 2013–2014
Kathryn L. O’Connor, MS*; Melissa M. Baker, BA
†
; Sara L. Dalton, MEd, LAT,
ATC
†
; Thomas P. Dompier, PhD, ATC
†
; Steven P. Broglio, PhD, ATC*;
Zachary Y. Kerr, PhD, MPH
‡
*NeuroTrauma Research Laboratory, University of Michigan, Ann Arbor; †Datalys Center for Sports Injury Research and Prevention, Inc, Indianapolis, IN; ‡Department of Exercise and Sport Science, University of North Carolina at Chapel Hill
Context: Sports participation is one of the leading causes of concussions among nearly 8 million US high school student-athletes.
Objective: To describe the epidemiology of sport-related concussion (SRC) in 27 high school sports during the 2011– 2012 through 2013–2014 academic years.
Design: Descriptive epidemiology study.
Setting: Aggregate injury and exposure data from 27 sports in 147 high schools in the National Athletic Treatment, Injury and Outcomes Network (NATION).
Patients or Other Participants: Boy and girl high school athletes during the 2011–2012 through 2013–2014 academic years.
Main Outcome Measure(s): Sport-related concussion counts, percentages, rates per 10 000 athlete-exposures (AEs), rate ratios (RRs), and injury proportion ratios (IPRs) were reported with 95% confidence intervals (CIs). Rate ratios and IPRs with 95% CIs not containing 1.0 were considered significant.
Results: Overall, 2004 SRCs were reported among 27 high school sports, for a rate of 3.89 per 10 000 AEs. Football had the highest SRC rate (9.21/10 000 AEs), followed by boys’ lacrosse
(6.65/10 000 AEs) and girls’ soccer (6.11/10 000 AEs). The SRC rate was higher in competition than in practice (RR¼3.30; 95% CI¼3.02, 3.60). Among sex-comparable sports, the SRC rate was higher in girls than in boys (RR¼1.56; 95% CI¼1.34, 1.81); however, the proportion of SRCs due to player-to-player contact was higher in boys than in girls (IPR¼1.48; 95% CI¼1.27, 1.73). Common symptoms reported among all athletes with SRCs were headache (94.7%), dizziness (74.8%), and difficulty concentrating (61.0%). Only 0.8% of players with SRCs returned to play within 24 hours. The majority of athletes with SRCs (65.8%) returned to play between 7 and 28 days. More players had symptoms resolve after 7 days (48.8%) than less than a week (40.7%).
Conclusions: Our findings provide updated high school SRC incidence estimates and further evidence of sex differenc-es in reported SRCs. Few athletdifferenc-es with SRCs returned to play within 24 hours or a week. Most injured players returned after 7 days, despite a smaller proportion having symptoms resolve within a week.
Key Words: injury surveillance, traumatic brain injuries, return to play
Key Points
Per 10 000 athlete-exposures, the rates of sport-related concussion were highest in football (9.21), boys’ lacrosse (6.65), and girls’ soccer (6.11).
Among sex-comparable sports, the rate of sport-related concussion was 56% higher in girls than in boys.
Most athletes with sport-related concussions returned to play after 7 days, despite resolution of symptoms in a smaller proportion within 1 week.
I
n spite of the potential benefits attributed to sports participation,1sport-related concussions (SRCs) pose aparticular concern among high school athletes due to this critical period for brain, social, and academic development.2Sport-related concussion has garnered recent
media attention, particularly to the possible acute and chronic risks associated with contact sports. Among retired National Football League players, recurrent concussions have been associated with mild cognitive impairment and
depression. The media and research focus on SRC has largely surrounded collegiate and professional athletes,3,4
yet at nearly 8 million participants annually,5 high school
athletes make up the single largest athletic cohort in the country. Because small proportions of high school athletes continue to play at the collegiate and professional levels,6it
contact and collision sports of football, ice hockey, lacrosse, or soccer,5 where SRC is a common injury.6,7
Sport-related concussions account for roughly 15% of all high school sport-related trauma,8 but this is likely an
underestimate as athletes commonly fail to report their injuries.9–11
The Institute of Medicine has called for more research on the incidence of SRC in youths aged 5 to 21 years.6
Describing the incidence of concussion in interscholastic sports is essential to identifying those at greatest risk of injury and where injury-reduction interventions should be targeted. When sports are evaluated independently, those with high concussion rates include rugby,12football,13girls’
soccer,13 cheerleading,14,15 and boys’ wrestling.13
Numer-ous authors7,13,16,17 have reported concussion rates across
various samples of high school sports. Although these data7,13,17,18provided an initial understanding of concussion
incidence, the latest reports extended through the 2011– 2012 athletic season. Given the general upward trend in reported high school level concussions associated with state legislative requirements and increased general injury awareness,19 more up-to-date incidence rates are needed.
Also, previous research12,16,20,21was conducted in singular
geographic regions or states. Using the National Athletic Treatment, Injury and Outcomes Network (NATION) surveillance program, our aim was to provide more recent concussion-incidence estimates in 27 sports using a nationwide sample of high schools.
METHODS
The NATION study was designed and implemented by the Datalys Center for Sports Injury Research and Prevention, Inc, in 2011. The NATION study uses a convenience sample of 147 high schools drawn from 26 states to compile data on 31 sports. Data were collected across 3 academic years (2011–2012 through 2013– 2014).22,23A total of 47 schools participated in year 1, 68
schools in year 2, and 147 schools in year 3; 30 schools participated all 3 years. Most of the participating high schools were public (84.4%), coeducational (98.6%), set in nonurban areas (75.5%; rural¼37.4%, suburban¼38.1%), and had enrollments of less than 1000 students (51.0%).23
Both full-time and part-time athletic trainers (ATs) at these schools were responsible for collecting injury and exposure data and were internally hired by or contracted from nearby clinics or university graduate programs. The NATION project was reviewed by the Western Institutional Review Board (Puyallup, WA) and determined to be exempt from human subjects protections review.
Data Collection
All injuries reported in the NATION database were evaluated or treated (or both) by ATs who attended practices and competitions during the preseason, regular season, and postseason. All athletic injuries and exposures were recorded for each session. Using a common data element standard, data were gathered across multiple injury-surveillance tools. The ATs documented injuries as part of their clinical practice using their preferred software application (Athletic Trainer System, Keffer Development Services, Inc, Grove City, PA; Injury Surveillance Tool, Datalys Center for Sports Injury Research and Prevention,
Inc, Indianapolis, IN; or Sports Injury Monitoring System, FlanTech, Iowa City, IA).23 Each data-collection system
compiles the type of injury, severity, mechanism, and session type. To record exposures, ATs listed the number of athletes participating in each session.
Data were exported and sent to the Datalys Center to be verified and analyzed. Before export, all identifying information was removed and encrypted. Athletic trainers could modify injury data up to 30 days postseason; after 30 days, the injury data submissions were deemed final. The NATION data–quality-control staff reviewed data across the academic year for accuracy and completeness, reducing the risk of memory decay. When invalid data were flagged, the data-control staff and ATs worked together to rectify the errors before the data were entered into the research database.22
Definitions
Injury. An injury is defined as any event that occurred
during an organized competition or practice and required attention from a health care provider (eg, AT, physician). Only injuries diagnosed by a health care provider were submitted to the NATION; events in which no medical care was sought or no diagnosis was made were not included.
Sport-Related Concussion. Concussion was defined by
the AT’s local institution or state guidelines. If no institutional or state guidelines were available, the definition provided by the Consensus Statement on Concussion in Sport was used.24 The Consensus
Statement on Concussion in Sport defines concussion as
‘‘a complex pathophysiological process affecting the brain, induced by biomechanical forces.’’24(p555) To differentiate
SRC from concussions that may have been sustained outside of the high school sports setting, our study examined only those that occurred during organized competitions and practices.
Athlete-Exposure. An athlete-exposure (AE) was
defined as 1 athlete participating in 1 practice or competition. Only those athletes with playing time in a competition were included in competition exposure calculations.
Event Type. Event type was the specific event (ie,
practice, competition) in which the SRC was reported to have occurred.
Injury Mechanism.Injury mechanismwas defined as the
manner in which the student-athlete sustained the SRC. In the NATION, ATs select from a preset list of options, including player-to-player contact, surface contact, equipment contact, contact with out-of-bounds object, noncontact, overuse, illness, infection, and other/unknown.
Recurrence.Athletic trainers identified those SRCs that
were recurrent (ie, a recurrence of the injury that was sustained either earlier in the current academic year or prior).
Symptoms.Symptoms were selected from a 17-item yes/
no checklist originating from the National Collegiate Athletic Association (NCAA) Injury Surveillance Program (ISP).25 After initially inputting injury data, ATs
Symptom-Resolution Time. The ATs selected from a categorical variable for the symptom-resolution time after SRC.Symptom resolutionis a global measure reflecting the resolution time from the presence of any symptom(s) until no symptoms are reported. Symptom resolution for all symptoms was categorized as less than 1 hour; 1 to 23 hours; more than 1 to 3 days; more than 3 to 7 days; 8 to 14 days; 15 to 28 days; and more than 28 days.
Return-to-Play Time. Sport-related concussions were
categorized by the number of days between the date of the concussive event and the date of full return to participation.
Statistical Analysis
Sport-related concussion rates per 10 000 AEs were defined as
SRC rate¼ X
SRC
X
AE *10 000;
wherePSRC is the sum of all SRCs andPAE is the sum of all AEs.26,27We also examined the distributions of SRC
by mechanism of injury, recurrence, symptoms, and recovery (ie, symptom-resolution time and return-to-play time). Our analysis of mechanism of injury retained the player-to-player contact, surface contact, and equipment contact values; all other values plus any missing data were placed into another/unknown category (n¼160). Missing data for recurrence (n¼2), symptom-resolution time (n¼
210), and return-to-play time (n¼13) were placed into a
missingcategory. Of the 319 cases with at least 1 variable with missing data, the majority came from football (53.6%, n ¼ 171); in addition, the large majority of these cases (92.2%, n¼294) had missing or other/unknown data for only 1 variable, followed by 2 (6.3%, n¼20) and 3 (0.9%, n ¼ 3) variables. To calculate the proportion of SRCs associated with these variables, missing data were included in the denominator (as opposed to excluding them from the analyses). We recalculated the analyses to exclude missing and other/unknown data. However, no meaningful changes in the effect estimates were found. Thus, such analyses excluding missing and other/unknown data are not presented here.
Rate ratios (RRs) and injury proportion ratios (IPRs) were also calculated. The rate ratio is defined as the relative difference between 2 events, groups, or sports and compares the incidence of SRC during competition and practice.Injury proportion ratiois defined as a comparison of the proportion of SRCs with a certain characteristic between 2 groups. An example of an IPR, comparing the proportion of SRCs from player-to-player contact in boys and girls, is
IPR¼ X
SRC from player-to-player contact in boys
X
SRC in boys
, X
SRC from player-to-player contact in girls
X
SRC in girls : The RRs and IPRs were used to compare rates and proportions, respectively, in sex-comparable sports (ie, baseball or softball, basketball, crew, cross-country, golf, lacrosse, soccer, swimming and diving, tennis, indoor track
and field, and outdoor track and field). Those RRs and IPRs with 95% confidence intervals (CIs) not containing 1.0 were considered significant. In addition, because the number of symptoms was not normally distributed, we used the Wilcoxon rank sum test to examine the difference in distributions of the number of symptoms reported between boys and girls among sex-comparable sports. A
Pvalue of less than .05 was considered significant. All data were analyzed using SAS Enterprise Guide (version 5.1; SAS Institute Inc, Cary, NC).
RESULTS
Sport-Related Concussion Rates
During the 2011–2012 through 2013–2014 academic years, a total of 2004 SRCs were reported, leading to an overall SRC rate of 3.89 per 10 000 AEs among all sports (Table 1). Football had the highest overall SRC rate (9.21/ 10 000 AEs), followed by boys’ lacrosse (6.65/10 000 AEs) and girls’ soccer (6.11/10 000 AEs). No SRCs were reported in boys’ crew, cross-country, golf, and swimming and diving and girls’ golf.
During competitions, football (19.87/10 000 AEs), boys’ lacrosse (17.51/10 000 AEs), and girls’ soccer (17.16/ 10 000 AEs) had the highest SRC rates (Table 1). During practice sessions, football (6.78/10 000 AEs), boys’ wres-tling (4.75/10 000 AEs), and girls’ lacrosse (3.44/10 000 AEs) had the highest SRC rates. Overall, the SRC rate was higher in competition than in practice (RR¼3.30; 95% CI
¼ 3.02, 3.60). Most sports had significantly higher SRC rates in competition than in practice, except for boys’ baseball and tennis and girls’ gymnastics, swimming and diving, indoor track and field, and outdoor track and field. Among sports in which both sexes participated (ie, baseball or softball, basketball, crew, cross-country, lacrosse, soccer, swimming and diving, tennis, indoor track and field, and outdoor track and field), the collective overall SRC rate was higher in girls than in boys (RR¼1.56; 95% CI¼ 1.34, 1.81; Table 2). During competition, girls had 1.46 (95% CI ¼1.20, 1.77) times the SRC rate of boys, increasing to 1.75 (95% CI¼1.39, 2.20) times the SRC rate during practices. Within specific sex-comparable sports, girls had increased SRC rates compared with boys for baseball or softball, basketball, soccer, and indoor track and field. Among competition SRC rates, girls had greater rates than boys in baseball or softball, basketball, and soccer; among practice SRC rates, girls had increased rates relative to boys in baseball or softball, soccer, and tennis.
Mechanism of Injury
Player-to-player contact was the most common SRC injury mechanism (62.8%, n ¼ 1258) in the following sports: football (79.6%, n¼812), boys’ soccer (69.9%, n¼
Table 1. Concussion Counts and Rates Among High School Athletes in 27 Sports, National Athletic Treatment, Injury and Outcomes Network (NATION), 2011–2012 Through 2013–2014 Academic Years
Sport
Concussions, No.
Concussion Rate/10 000 Athlete-Exposuresa
(95% Confidence Interval) Competition Versus Practice Rate Ratio (95% Confidence Interval) Competitions Practices Overall Competitions Practices Overall
Boys’ football 409 611 1020 19.87 (17.95, 21.80) 6.78 (6.24, 7.31) 9.21 (8.64, 9.78) 2.93 (2.59, 3.32)c
Boys’ wrestling 45 92 137 10.21 (7.23, 13.20) 4.75 (3.78, 5.72) 5.76 (4.80, 6.73) 2.15 (1.51, 3.07)c
Girls’ field hockey 39 27 66 9.83 (6.74, 12.91) 2.47 (1.54, 3.40) 4.42 (3.36, 5.49) 3.99 (2.44, 6.51)c
Girls’ gymnastics 2 6 8 5.27 (0.00, 12.58) 2.28 (0.45, 4.10) 2.65 (0.81, 4.49) 2.32 (0.47, 11.48) Girls’ volleyball 28 46 74 3.67 (2.31, 5.03) 2.09 (1.49, 2.69) 2.50 (1.93, 3.06) 1.76 (1.10, 2.81)c
Boys’ baseball 7 11 18 1.22 (0.31, 2.12) 0.73 (0.30, 1.16) 0.86 (0.46, 1.26) 1.67 (0.65, 4.31) Girls’ softball 24 26 50 6.33 (3.80, 8.86) 2.54 (1.57, 3.52) 3.57 (2.58, 4.56) 2.49 (1.43, 4.33)c
Boys’ basketball 45 47 92 4.93 (3.49, 6.36) 1.72 (1.23, 2.21) 2.52 (2.01, 3.04) 2.86 (1.90, 4.31)c
Girls’ basketball 81 47 128 10.52 (8.23, 12.82) 2.22 (1.59, 2.86) 4.44 (3.67, 5.20) 4.74 (3.31, 6.79)c
Boys’ crew 0 0 0 0.00 0.00 0.00 NA
Girls’ crew 0 3 3 0.00 1.61 (0.00, 3.43) 1.36 (0.00, 2.89) NA
Boys’ cross-country 0 0 0 0.00 0.00 0.00 NA
Girls’ cross-country 0 3 3 0.00 0.17 (0.00, 0.37) 0.15 (0.00, 0.32) NA
Boys’ golf 0 0 0 0.00 0.00 0.00 NA
Girls’ golf 0 0 0 0.00 0.00 0.00 NA
Boys’ lacrosse 74 37 111 17.51 (13.52, 21.49) 2.97 (2.01, 3.93) 6.65 (5.41, 7.89) 5.90 (3.97, 8.75)c
Girls’ lacrosse 30 26 56 11.75 (7.55, 15.95) 3.44 (2.12, 4.76) 5.54 (4.09, 6.99) 3.42 (2.02, 5.78)c
Boys’ soccer 60 23 83 11.33 (8.46, 14.20) 1.48 (0.87, 2.08) 3.98 (3.12, 4.83) 7.67 (4.74, 12.40)c
Girls’ soccer 66 40 106 17.16 (13.02, 21.30) 2.96 (2.04, 3.88) 6.11 (4.94, 7.27) 5.80 (3.91, 8.58)c
Boys’ indoor
track and field 0 3 3 0.00 0.15 (0.00, 0.33) 0.14 (0.00, 0.29) NA Girls’ indoor
track and field 3 6 9 1.27 (0.00, 2.72) 0.40 (0.08, 0.71) 0.52 (0.18, 0.85) 3.21 (0.80, 12.83) Boys’ outdoor
track and field 4 3 7 0.82 (0.02, 1.63) 0.13 (0.00, 0.28) 0.25 (0.07, 0.44) 6.32 (1.41, 28.25)c
Girls’ outdoor
track and field 3 6 9 0.79 (0.00, 1.69) 0.33 (0.07, 0.59) 0.41 (0.14, 0.68) 2.40 (0.60, 9.59) Boys’ swimming
and diving 0 0 0 0.00 0.00 0.00 NA
Girls’ swimming
and diving 2 2 4 1.73 (0.00, 4.13) 0.62 (0.00, 1.49) 0.92 (0.02, 1.82) 2.78 (0.39, 19.70) Boys’ tennis 3 3 6 2.13 (0.00, 4.53) 0.45 (0.00, 0.95) 0.74 (0.15, 1.32) 4.78 (0.96, 23.66) Girls’ tennis 0 11 11 0.00 1.94 (0.79, 3.08) 1.59 (0.65, 2.53) NA Boys’ sports totalb 193 127 320 4.86 (4.17, 5.54) 0.85 (0.70, 1.00) 1.69 (1.51, 1.88) 5.70 (4.56, 7.14)c
Girls’ sports totalb 209 170 379 7.07 (6.11, 8.03) 1.49 (1.27, 1.71) 2.64 (2.37, 2.90) 4.75 (3.88, 5.81)c
Overall total 925 1079 2004 8.71 (8.15, 9.27) 2.64 (2.48, 2.80) 3.89 (3.72, 4.06) 3.30 (3.02, 3.60)c
Abbreviation: NA, not applicable.
aOne athlete-exposure¼1 athlete participating in 1 practice or competition.
bOnly includes sports in which both sexes participated (ie, baseball or softball, basketball, crew, cross-country, golf, lacrosse, soccer,
swimming and diving, tennis, indoor track and field, and outdoor track and field).
cStatistically significant (ie, rate ratio„1.00).
Table 2. Comparison of Concussion Rates Among High School Athletes by Event Type, National Athletic Treatment, Injury and Outcomes Network (NATION), 2011–2012 Through 2013–2014 Academic Yearsa
Sport
Boys Versus Girls: Rate Ratio (95% Confidence Interval)
Competitions Practices Overall
Baseball and softball 5.21 (2.24, 12.09)b 3.50 (1.73, 7.08)b 4.14 (2.42, 7.09)b
Basketball 2.14 (1.48, 3.08)b 1.29 (0.86, 1.93) 1.76 (1.34, 2.30)b
Lacrosse 0.67 (0.44, 1.03) 1.16 (0.70, 1.91) 0.83 (0.60, 1.15) Soccer 1.51 (1.07, 2.15)b 2.00 (1.20, 3.35)b 1.53 (1.15, 2.05)b
Tennis NA 4.35 (1.21, 15.59)b 2.16 (0.80, 5.85)
Indoor track and field NA 2.56 (0.64, 10.25) 3.81 (1.03, 14.08)b
Outdoor track and field 0.96 (0.22, 4.29) 2.53 (0.63, 10.13) 1.63 (0.61, 4.38) Totalc 1.46 (1.20, 1.77)b 1.75 (1.39, 2.20)b 1.56 (1.34, 1.81)b
Abbreviation: NA, not applicable.
aSports in which both sexes had concussion counts,5 are not shown (ie, crew, cross-country, golf, swimming and diving). bStatistically significant (ie, 95% confidence interval does not include 1.00).
cOnly includes sports in which both sexes participated (ie, baseball or softball, basketball, crew, cross-country, golf, lacrosse, soccer,
More than 50% of SRCs were caused by equipment contact in boys’ baseball (61.1%, n¼ 11), girls’ softball (60.0%, n¼30), girls’ volleyball (58.1%, n¼43), girls’ lacrosse (57.1%, n¼32), and girls’ field hockey (56.1%, n
¼37; Table 3). Equipment contact accounted for a larger proportion of SRCs in girls than in boys (36.7%, n¼139 versus 18.1%, n¼58; IPR¼2.02; 95% CI¼1.55, 2.64). The majority of equipment contact-related SRCs across all sports resulted from contact with the ball (66.8%, n¼197).
Recurrence
In total, 2.9% (n ¼ 59) of SRCs were reported to be recurrent. Within each sport, girls’ field hockey reported the greatest proportion of SRCs that were recurrent (4.5%, n¼
3), followed by football (3.6%, n¼37) and girls’ lacrosse
(3.6%, n ¼ 2). Among sex-comparable sports, the proportion of SRCs that were recurrent did not differ in boys and girls (1.3% [n¼4] versus 2.9% [n¼11]; IPR¼
0.43; 95% CI¼0.14, 1.34).
Symptoms and Recovery
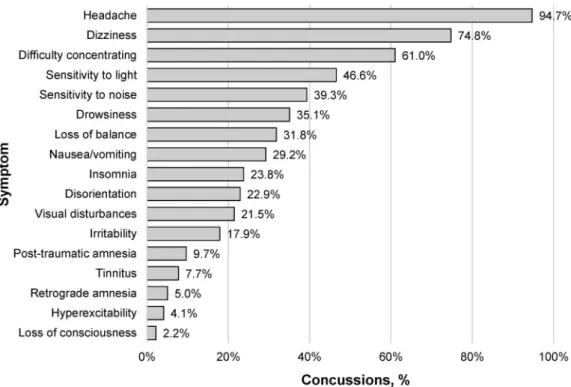
The overall number of symptoms reported with each SRC was right-tail skewed, with 54.9% of the athletes reporting 5 or more symptoms (Figure 1). Distributions of the number of symptoms reported between boys and girls among sex-comparable sports did not differ (P ¼ .09). Common symptoms reported were headache (94.7%, n ¼ 1898), dizziness (74.8%, n ¼ 1498), difficulty concentrating (61.0%, n¼1223), sensitivity to light (46.6%, n¼933), and sensitivity to noise (39.3%, n¼788; Figure 2).
Table 3. Distributions of Concussion by Injury Mechanism Among High School Athletes, National Athletic Treatment, Injury and Outcomes Network (NATION), 2011–2012 Through 2013–2014 Academic Years, No. (%)a
Injury Mechanism
Sport Player to Player Surface Equipment Other/Unknown
Boys’ football 812 (79.6) 94 (9.2) 13 (1.3) 101 (9.9) Boys’ wrestling 70 (51.1) 52 (38.0) 4 (2.9) 11 (8.0) Girls’ field hockey 22 (33.3) 7 (10.6) 37 (56.1) 0 (0.0) Girls’ gymnastics 1 (12.5) 4 (50.0) 1 (12.5) 2 (25.0) Girls’ volleyball 13 (17.6) 12 (16.2) 43 (58.1) 6 (8.1) Boys’ baseball 6 (33.3) 0 (0.0) 11 (61.1) 1 (5.6) Girls’ softball 15 (30.0) 5 (10.0) 30 (60.0) 0 (0.0) Boys’ basketball 55 (59.8) 26 (28.3) 7 (7.6) 4 (4.4) Girls’ basketball 69 (53.9) 31 (24.2) 17 (13.3) 11 (8.6) Boys’ lacrosse 67 (60.4) 15 (13.5) 22 (19.8) 7 (6.3) Girls’ lacrosse 13 (23.2) 7 (12.5) 32 (57.1) 4 (7.1) Boys’ soccer 58 (69.9) 13 (15.7) 11 (13.3) 1 (1.2) Girls’ soccer 43 (40.6) 13 (12.3) 49 (46.2) 1 (0.9) Girls’ swimming and diving 1 (25.0) 1 (25.0) 1 (25.0) 1 (25.0)
Boys’ tennis 2 (33.3) 0 (0.0) 2 (33.3) 2 (33.3)
Girls’ indoor track and field 2 (22.2) 4 (44.4) 2 (22.2) 1 (11.1) Boys’ outdoor track and field 1 (14.3) 1 (14.3) 3 (42.9) 2 (28.6) Girls’ outdoor track and field 3 (33.3) 4 (44.4) 2 (22.2) 0 (0.0) Boys’ sports totalb 189 (59.1) 56 (17.5) 58 (18.1) 17 (5.3)
Girls’ sports totalb 151 (39.8) 66 (17.4) 139 (36.7) 23 (6.1)
Overall total 1258 (62.8) 291 (14.5) 295 (14.7) 160 (8.0)
aSports with concussion counts,5 are not shown (ie, boys’ crew, cross-country, golf, swimming and diving, and indoor track and field and
girls’ crew, cross-country, golf, and swimming and diving).
bOnly includes sports in which both sexes participated (ie, baseball or softball, basketball, crew, cross-country, golf, lacrosse, soccer,
swimming and diving, tennis, indoor track and field, and outdoor track and field).
Most athletes with SRCs reported symptom resolution within 7 days (40.7%, n¼814) or 8 to 14 days (21.7%, n¼
234; Figure 3). Among sex-comparable sports, the proportion of SRCs with symptom resolution time within 7 days was higher in boys than in girls (44.4% [n¼142] versus 32.2% [n¼122]; IPR¼1.38; 95% CI¼1.14, 1.67). In contrast, the proportion of SRCs with
symptom-resolution time greater than 14 days was higher in girls than in boys (33.0% [n¼125] versus 24.4% [n¼78]; IPR¼
1.35; 95% CI¼1.06, 1.72). The proportion of SRCs with symptom-resolution time greater than 28 days was also higher in girls than in boys but not significantly so (14.8% [n¼56] versus 10.3% [n¼33]; IPR¼1.43; 95% CI¼0.96, 2.15).
Figure 2. Symptoms reported after concussions sustained by high school athletes, National Athletic Treatment, Injury and Outcomes Network (NATION), 2011–2012 through 2013–2014 academic years.
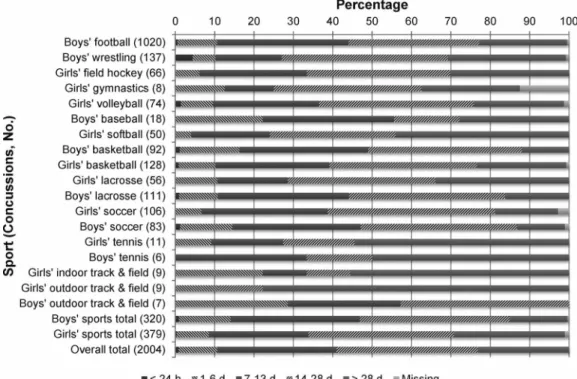
Less than 1% (n¼16) of all SRCs resulted in the athlete returning to play within 24 hours (Figure 4). Boys’ wrestling was the sport that had the largest proportion of athletes with SRCs returning within 24 hours (4.4%; n¼6). Overall, 211 (10.5%) players with SRCs had a return-to-play time of less than 7 days. Among sex-comparable sports, the proportion of athletes with SRCs who had a return-to-play time of less than 7 days was higher in boys than in girls (14.1% [n¼45] versus 8.4% [n¼32]; IPR¼
1.67; 95% CI¼1.09, 2.56). Conversely, 23.0% (n¼461) of all athletes and more girls than boys (28.2% [n ¼ 107] versus 14.7% [n¼47]; IPR¼1.92; 95% CI¼1.41, 2.62) required greater than 28 days to return to play.
DISCUSSION
In this study, we examined the descriptive epidemiology of more than 2000 athletes with SRCs in 27 high school sports as reported by ATs during the 2011–2012 through 2013–2014 academic years. Our data support previous research results7,17,27,28indicating that most SRCs were due
to player contact. Football had the highest overall, competition, and practice SRC rates. However, the SRC rate was higher in girls than in boys in sex-comparable sports. These findings will help guide policy and program-ming to reduce the incidence of SRC within high school athletes.
As seen in previous studies13,17,28 examining SRC,
football had the highest reported SRC rate. This differs from previous NCAA data, which showed that ice hockey and wrestling had higher SRC rates.27 However,
Zucker-man et al27 cautioned about interpretation of the high
wrestling rate, given the lower participation level compared with other sports. In addition, as previously noted, sports
included in the studies varied, with some researchers not examining high school ice hockey.13,17,28Nevertheless, the
typical football roster size exceeds that of ice hockey and wrestling, making football one of the largest athlete populations nationwide5; therefore, it is likely that the total
incidence of SRCs within football players is higher than previously reported ice hockey and wrestling rates. Thus, our findings emphasize the need to continue ensuring ongoing support for appropriate medical coverage of high school football in order to detect, diagnose, and manage SRCs.
The overall SRC rate we report (3.89/10 000 AEs) lies between estimates from previous epidemiologic stud-ies13,17,28 ranging from 2.4 to 5.1 per 10 000 AEs. The
variations in reported SRC rates may be due to numerous factors. First, authors of older studies19may have collected
data at a time when there was less concussion education, awareness, and reporting. Second, we examined 27 sports, many of which, such as crew and golf, had not been previously examined. Furthermore, concussion disclosure may vary by sex and sport29,30and thus may further affect
reported rates. Last, concussion incidence and reporting may be associated with additional environmental factors. For example, high schools with fewer students may have greater SRC rates than larger high schools.31The difference
in SRC rate school size might be related to a smaller athlete-to-staff ratio facilitating patient-clinician relation-ships or greater coverage at athletic events and increasing detection of SRCs. Furthermore, although other injury-surveillance systems7,13,17,28 use stratified sampling based
on US Census region and school size, they may not control for factors such as urbanicity and rurality. Most high schools in NATION were located in nonurban areas, whereas most high schools in other surveillance studies
were located in urban areas. Therefore, sampling among these surveillance programs may be associated with reported SRC rates. Continued research within different high school populations will help to identify common trends in SRC estimates across sports.
Previous investigators28indicated that reported SRC rates
were lower in high school than in collegiate athletes. Compared with recent SRC data from the NCAA-ISP during the 2009–2010 through 2013–2014 academic years, the high school reported SRC rate estimated from NATION is smaller than in the collegiate sample (3.89 versus 4.47/ 10 000 AEs). Although the study periods differed slightly, concerns about varying methods may be mitigated, given that both the NATION and the NCAA-ISP use the same methods.23,32The reasons for the differences between high
school and collegiate rates are not entirely clear, but most collegiate teams have their own AT present at competitions and practices. At the high school level, among approxi-mately 9000 public high schools, 70% of schools provided AT services, although these included a combination of full-time, part-full-time, and per diem AT staff.33Only 48% of high
schools provided coverage at practices for all teams, and 37% employed a full-time AT.33 Because of this possible
gap in services provided at some high schools compared with college, SRCs may have not been detected and reported in an equitable manner.
Interestingly, despite overall higher SRC rates in collegiate compared with high school athletes, we found the opposite in specific sports. Overall, high school SRC rates were higher than college SRC rates for football (9.21 versus 6.71/10 000 AEs) and boys’ soccer (3.98 versus 3.44/10 000 AEs).27 However, when stratified by event
type, high school football had a higher practice rate (6.78 versus 4.20/10 000 AEs) and a lower competition rate (19.87 versus 30.07/10 000 AEs); high school soccer had a lower practice rate (1.48 versus 1.75/10 000 AEs) and a higher competition rate (11.33 versus 9.69/10 000 AEs).27
The different SRC rates between high school and collegiate athletes may result from greater variability in athlete sizes and abilities, resulting in more frequent mismatches and increased concussion risk. In addition, those young athletes who continue playing at the collegiate level may possess unique characteristics that make them less injury prone.9In
youth football, attempts to control for mismatches have resulted in players being placed on teams and in competition levels based on their age and weight. However, SRC rates did not differ among those in age-weight and age-only leagues.34 These findings highlight the need to
consider the association of competition level and possible size and skill mismatches among players with SRC risk.
Future researchers must continue examining differences in SRC rates among various competition levels, while evaluating the effectiveness of injury-prevention strategies intended to reduce contact and SRC incidence. In 2014, the NCAA introduced recommended practice contact guide-lines limiting the amount of live contact.35Live contact is
defined by the NCAA as ‘‘any practice that involves live tackling to the ground and/or full-speed blocking.’’35Many
of these guidelines have been established for younger athlete populations as well. Most notably, the US Soccer Federation recently banned heading for those under the age of 11 and limited the number of headers for those aged 11 to 13 years.36 In 2011, USA Hockey eliminated body
checking for those under 12 years of age.37Youth football
organizations have enacted coaching education to teach better tackling and blocking strategies and have limited the number of contact practices per week; such interventions have been associated with lower injury rates.38Our results
support continued efforts by organizations and their many stakeholders (eg, coaches, athletic directors, school boards) to reduce the incidence of SRCs.
With more than 8 million athletes participating in high school athletics,5SRCs in high school athletes represent a
large public health concern. Boys’ football ranks highest for both the number of concussive injuries (n¼1020) and the rate of concussive injury (9.21/10 000 AEs). Compared with practices, competitions produced almost 4 times the rate of concussions for both male and female sports. In calculating the attributable fraction for competition ([Ratecompetition – Ratepractice]/Ratecompetition), we found
that, by decreasing the concussion rate in competitions so that it was equivalent to that in practices, we would eliminate 70% of all concussions in competitions ([8.71 – 2.64]/8.71). Improving our understanding of which groups are at greatest risk for injury will promote the reallocation of clinical resources to support the athletes at greatest risk. Among sex-comparable sports, the rate of SRCs was about 56% higher in girls than in boys. These findings are slightly lower than the previously reported twofold higher rate in girls.17 The difference in findings could be the
result of variations in sports examined, as our study included many noncontact sports, such as crew and golf. In particular, the differences were most apparent in baseball and softball, with girls having about 4 times the SRC rate of boys. This is a larger disparity than reported earlier,13,17,28 although we caution that the number of
SRCs reported in baseball was relatively small (n¼18). Nevertheless, the results highlight an overall sex disparity in concussion between males and females that is consistent with the literature. Previous authors28,39
theo-rized that women may be at more risk of concussion for biological and sociocultural reasons; however, given recent research29,30 that demonstrated more nondisclosure
of concussion among male athletes than among female athletes, it is possible that the higher rate among females is a function of more concussions being reported. Future concussion-prevention and -education efforts should consider strategies for increasing disclosure of symptoms among athletes, not only to better detect and manage concussions but also to ensure more valid estimates of the true incidence of concussion (as opposed to the reported incidence).
Player-to-player contact was the most frequent injury mechanism in both boys and girls. However, a higher proportion of SRCs was due to player-to-player contact in boys than in girls, particularly in full-contact sports, such as football and wrestling. Such findings are consistent with previous results.40Although rule differences exist between
boys’ and girls’ lacrosse (eg, checking is not allowed among girls), the finding once again highlights sex differences associated with SRC risk. Less examined in research has been the role of equipment contact in SRC incidence. As in previous studies,40 we noted that the
proportion of SRCs due to equipment contact was higher in girls than in boys. Recent investigators41focused on SRCs
majority occurred from player-to-player contact, but they also showed a higher heading-related SRC rate in girls, particularly due to contact with the ball. It has been theorized that the greater ball-to-neck ratio among females compared with males may place them at higher risk for SRC.39 However, the role of equipment contact in SRC
needs to be further examined among other sports.
The current study also elucidates a high school athlete’s recovery trajectory. Significant proportions of concussions resolve so that athletes may return within the second (30%) to third (36%) week after injury. This return-to-play timeline follows the resolution of metabolic abnormalities after injury.42 Returning to play after this period of
susceptibility minimizes the likelihood of subsequent injury and cumulative effects of multiple concussions. Although fewer than 11% of concussed athletes returned to play in less than a week, 41% of athletes reported symptom resolution by day 7 postinjury. Despite a significant proportion of athletes experiencing symptom resolution, few athletes returned to play within a week of injury, suggesting conservative clinical management and imple-mentation of a return-to-play protocol. Conservative management may ensure an athlete is healthy enough to return to play, as there is evidence of persistent cognitive43
and gait44deficits even in the absence of symptoms.
Comparing the recovery trajectories between males and females in equivalent sports, we found that males were more likely to experience symptom resolution within a week of injury. Females, however, were more likely to have symptoms resolve by 14 to 28 days after injury compared with their male counterparts. The longer recovery time in females has been demonstrated previously in adolescents, with 41% of females recovering after 21 days compared with 19% of males.45Females appear to be less influenced by their
peers and thus tend to report more symptoms than males.46
Social norms may drive sex differences. Whereas males may be influenced by perceptions of toughness and self-reliance, females may be more indifferent to such perceptions and thus more likely to report symptoms.47 Other authors48 have
observed no mediating role of sex on symptom-resolution time. Differences in methods may explain the discrepancy between our study and the findings of Frommer et al,48who
did not limit their analyses to sex-comparable sports. The limited number of sex-comparable sports and predominance of male concussions (male¼610, female¼202) in the study by Frommer et al may have influenced comparisons of symptom-resolution time between sexes. Moreover, 70% of athletes reported symptom resolution within 3 days of injury,48 which is substantially quicker than the 20% we
noted. Concussion education and awareness increased between 2005 and 2014 and may be driving the difference in symptom-resolution times between the studies.
One focus of concussion education and legislation has been the immediate removal of concussed athletes with no same-day return to play.19Previous investigators evaluating
same-day return to play generated estimates as high as 30% among collegiate and high school football players9 and
approximately 2% among all high school athletes.7
However, our findings are encouraging, given that we estimated fewer than 1% of concussions resulted in athletes returning to play within 24 hours. In fact, for the majority of SRCs (88.8%), athletes returned to play after 7 days, despite a smaller proportion having symptoms resolve within a
week (40.7%). Our findings align with recommenda-tions24,49 that no concussed athletes be returned to play
within a week of injury. Team medical staff are probably not considering symptom resolution as the sole guideline for returning an athlete to play. Such management may also be helping to deter the risk of reinjury, as previous SRC is associated with an increased risk of subsequent concussive injury.50–52This may be demonstrated by the proportion of
SRCs that were recurrent in our study (3%) being lower than the previously reported 11%.17 In addition, 6.5% of
concussed collegiate athletes experienced a second concus-sion within the same season, most within 7 days of the first.50This finding highlights the importance of an on-site
medical staff to ensure safe and proper management of athletes with concussions and recovering athletes.
Limitations
Although our study captured more than 2000 SRCs in high school athletes from 27 sports in 26 states, our findings may not be representative of the national population of high school athletes. These results may also not be generalizable to sports in other settings (eg, youth, recreational leagues). In addition, we did not include sports such as ice hockey and rugby, which are experiencing increased participa-tion53,54but are also high risk for SRC.12,18,21,55
Cheerlead-ing has a high concussion incidence as well.14,15,56 Some
noncontact sports (eg, crew, cross-country, golf) also lacked sufficient numbers of reported SRCs to generate more precise rate estimates. Similarly, given the short 3-year study period (2011–2012 through 2013–2014), we did not evaluate time trends in SRC rates. As seen in previous research with larger study timeframes,13,17SRC rates may
have changed over time. Similar to other sports injury-surveillance programs,13,25,27,41,57 we did not provide a
working definition of concussionand instead relied on the expertise of the ATs who collected the data and the guidance provided by their local institution or state guidelines; where no guidelines existed, we referred them to the definition provided by the‘‘Consensus Statement on Concussion in Sport.’’24 Also, the use of rates per 10 000
AEs relies on exposure data that is not time based, and we were unable to account for variations in competitions and practices. Nonetheless, using AEs as the denominator data minimized the burden placed on the ATs who were providing the injury and exposure data. Last, data were missing for certain variables. The importance of the missing data ranged from minimal (eg, recurrence: 0.1% [n ¼ 2]; return to play time: 0.6% [n ¼ 13]) to more concerning (eg, symptom-resolution time: 10.5% [n ¼
210]). These percentages also varied by sport. Although the analyses of sex differences among sex-comparable sports did not meaningfully change when missing data were excluded, we advocate the need for continued efforts to ensure complete data collection.
CONCLUSIONS
associated with as much risk as comparable male sports, increased female SRC rates indicate a possible increase in clinical resources. Similarly, the higher rate of concussions occurring in competitions relative to practices emphasizes how the former moderates the rate of concussion. Thus, both clinicians and coaches should be aware of the increased likelihood of injury in competition to minimize athlete behaviors such as aggressiveness and risk taking that may put the athlete at greater risk.
The proportion of athletes with concussions who returned to play in less than 24 hours was lower than in earlier research,7 with most players returning after 7 days.
Increases in education, clinical protocols, legislation, and AT presence and improved medical care may partially explain the longer time that concussed athletes are being withheld from participation. Continued efforts may further reduce the number of athletes with concussions returned to play within 24 hours. Overall, our results highlight the high school sports at greatest risk of injury and incidence rate differences between sexes and suggest improved clinical management of concussive injuries.
ACKNOWLEDGMENTS
This study would not have been possible without the assistance of the many high school ATs who participated in the program. This project was funded by the National Athletic Trainers’ Association Research and Education Foundation and the Central Indiana Corporate Partnership Foundation in cooperation with BioCrossroads. The content of this report is solely the responsibility of the authors and does not necessarily reflect the views of the National Athletic Trainers’ Association Research and Education Foundation, Central Indiana Corporate Partnership Foundation, or BioCrossroads.
REFERENCES
1. Bailey R. Physical education and sport in schools: a review of benefits and outcomes.J Sch Health. 2006;76(8):397–401. 2. McCrory P, Collie A, Anderson V, Davis G. Can we manage sport
related concussion in children the same as in adults?Br J Sports Med. 2004;38(5):516–519.
3. Guskiewicz KM, Marshall SW, Bailes J, et al. Recurrent concussion and risk of depression in retired professional football players.Med Sci Sports Exerc. 2007;39(6):903–909.
4. Guskiewicz KM, Marshall SW, Bailes J, et al. Association between recurrent concussion and late-life cognitive impairment in retired professional football players.Neurosurgery. 2005;57(4):719–726. 5. National Federation of State High School Associations. NFHS
Handbook 2015–16. National Federation of State High School Associations: Indianapolis, IN; 2015.
6. Institute of Medicine. Sports-Related Concussions in Youth. Wash-ington, DC: Institute of Medicine; 2013:1–4.
7. Marar M, McIlvain NM, Fields SK, Comstock RD. Epidemiology of concussions among United States high school athletes in 20 sports. Am J Sports Med. 2012;40(4):747–755.
8. Meehan WP III, d’Hemecourt P, Collins CL, Comstock RD. Assessment and management of sport-related concussions in United States high schools.Am J Sports Med. 2011;39(11):2304–2310. 9. Guskiewicz KM, Weaver NL, Padua DA, Garrett WE Jr.
Epidemi-ology of concussion in collegiate and high school football players. Am J Sports Med. 2000;28(5):643–650.
10. LaRoche AA, Nelson LD, Connelly PK, Walter KD, McCrea MA. Sport-related concussion reporting and state legislative effects.Clin J Sport Med. 2016;26(1):33–39.
11. McCrea M, Hammeke T, Olsen G, Leo P, Guskiewicz K. Unreported concussion in high school football players: implications for prevention.Clin J Sport Med. 2004;14(1):13–17.
12. Marshall SW, Spencer RJ. Concussion in rugby: the hidden epidemic.J Athl Train. 2001;36(3):334–338.
13. Rosenthal JA, Foraker RE, Collins CL, Comstock RD. National high school athlete concussion rates from 2005–2006 to 2011–2012.Am J Sports Med. 2014;42(7):1710–1715.
14. Shields BJ, Fernandez SA, Smith GA. Epidemiology of cheerleading stunt-related injuries in the United States.J Athl Train. 2009;44(6): 586–594.
15. Currie DW, Fields SK, Patterson MJ, Comstock RD. Cheerleading injuries in United States high schools.Pediatrics. 2016;137(1):1–9. 16. Schulz MR, Marshall SW, Mueller FO, et al. Incidence and risk
factors for concussion in high school athletes, North Carolina, 1996– 1999.Am J Epidemiol. 2004;160(10):937–944.
17. Lincoln AE, Caswell SV, Almquist JL, Dunn RE, Norris JB, Hinton RY. Trends in concussion incidence in high school sports: a prospective 11-year study.Am J Sports Med. 2011;39(5):958–963. 18. Pfister T, Pfister K, Hagel B, Ghali WA, Ronksley PE. The incidence
of concussion in youth sports: a systematic review and meta-analysis. Br J Sports Med. 2016;50(5):292–297.
19. Gibson TB, Herring SA, Kutcher JS, Broglio SP. Analyzing the effect of state legislation on health care utilization for children with concussion.JAMA Pediatr. 2015;169(2):163–168.
20. Hinton RY, Lincoln AE, Almquist JL, Douoguih WA, Sharma KM. Epidemiology of lacrosse injuries in high school-aged girls and boys: a 3-year prospective study.Am J Sports Med. 2005;33(9):1305–1314. 21. Emery C, Kang J, Shrier I, et al. Risk of injury associated with bodychecking experience among youth hockey players.CMAJ. 2011; 183(11):1249–1256.
22. Dompier TP, Kerr ZY, Marshall SW, et al. Incidence of concussion during practice and games in youth, high school, and collegiate American football players.JAMA Pediatr. 2015;169(7):659–665. 23. Dompier TP, Marshall SW, Kerr ZY, Hayden R. The National
Athletic Treatment, Injury and Outcomes Network (NATION): methods of the surveillance program, 2011–2012 through 2013– 2014.J Athl Train. 2015;50(8):862–869.
24. McCrory P, Meeuwisse WH, Aubry M, et al. Consensus Statement on Concussion in Sport: the 4th International Conference on Concussion in Sport, Zurich, November 2012.J Athl Train. 2013; 48(4):554–575.
25. Wasserman EB, Kerr ZY, Zuckerman SL, Covassin T. Epidemiology of sports-related concussions in National Collegiate Athletic Association Athletes from 2009–2010 to 2013–2014: symptom prevalence, symptom resolution time, and return-to-play time. Am J Sports Med. 2016;44(1):226–233.
26. Knowles SB, Marshall SW, Guskiewicz KM. Issues in estimating risks and rates in sports injury research. J Athl Train. 2006;41(2): 207–215.
27. Zuckerman SL, Kerr ZY, Yengo-Kahn A, Wasserman E, Covassin T, Solomon GS. Epidemiology of sports-related concussion in NCAA athletes from 2009-2010 to 2013-2014: incidence, recurrence, and mechanisms.Am J Sports Med. 2015;43(11):2654–2662.
28. Gessel LM, Fields SK, Collins CL, Dick RW, Comstock RD. Concussions among United States high school and collegiate athletes. J Athl Train. 2007;42(4):495–503.
29. Llewellyn T, Burdette GT, Joyner AB, Buckley TA. Concussion reporting rates at the conclusion of an intercollegiate athletic career. Clin J Sport Med. 2014;24(1):76–79.
30. Kerr ZY, Register-Mihalik JK, Kroshus E, Baugh CM, Marshall SW. Motivations associated with nondisclosure of self-reported concussions in former collegiate athletes.Am J Sports Med. 2016;44(1):220–225. 31. King H, Campbell S, Herzog M, Popoli D, Reisner A, Polikandriotis
32. Kerr ZY, Dompier TP, Snook EM, et al. National Collegiate Athletic Association Injury Surveillance System: review of methods for 2004–2005 through 2013–2014 data collection.J Athl Train. 2014; 49(4):552–560.
33. Pryor RR, Casa DJ, Vandermark LW, et al. Athletic training services in public secondary schools: a benchmark study.J Athl Train. 2015; 50(2):156–162.
34. Kerr ZY, Marshall SW, Simon JE, et al. Injury rates in age-only versus age-and-weight playing standard conditions in American youth football.Orthop J Sports Med. 2015;3(9):2325967115603979. 35. National Collegiate Athletic Association. NCAA Football: Recom-mendation made to reduce contact in practices. http://www.ncaa. c o m / n e w s / f o o t b a l l / a r t i c l e / 2 0 1 6 0 7 2 8 / n c a a f o o t b a l l -recommendation-made-reduce-contact-practices. Accessed January 3, 2017.
36. Strauss B. US Soccer, resolving lawsuit, will limit headers for youth players.New York TimesWeb site. nytimes.com/2015/11/10/sports/ soccer/us-soccer-resolving-lawsuit-will-limit-headers-for-youth-players.html. Published November 9, 2015. Accessed January 3, 2017.
37. Rule changes for a safer game. Minnesota Hockey Web site. http:// www.minnesotahockey.org/news_article/show/286889?referrer_ id¼866105. Published 2013. Accessed April 21, 2016.
38. Kerr ZY, Yeargin SW, Valovich McLeod TC, Mensch J, Hayden R, Dompier TP. Comprehensive coach education reduces head impact exposure in American youth football.Orthop J Sports Med. 2015; 3(10):2325967115610545.
39. Collins CL, Fletcher EN, Fields SK, et al. Neck strength: a protective factor reducing risk for concussion in high school sports. J Prim Prev. 2014;35(5):309–319.
40. Dick RW. Is there a gender difference in concussion incidence and outcomes?Br J Sports Med. 2009;43(suppl 1):i46–i50.
41. Comstock RD, Currie DW, Pierpoint LA, Grubenhoff JA, Fields SK. An evidence-based discussion of heading the ball and concussions in high school soccer.JAMA Pediatr. 2015;169(9):830–837.
42. Giza CC, Hovda DA. The new neurometabolic cascade of concussion.Neurosurgery. 2014;75(suppl 4):S24–S33.
43. Gosselin N, Th´eriault M, Leclerc S, Montplaisir J, Lassonde M. Neurophysiological anomalies in symptomatic and asymptomatic concussed athletes.Neurosurgery. 2006;58(6):1151–1161.
44. Martini DN, Sabin MJ, DePesa SA, et al. The chronic effects of concussion on gait.Arch Phys Med Rehabil. 2011;92(4):585–589.
45. Baker JG, Leddy JJ, Darling SR, Shucard J, Makdissi M, Willer BS. Gender differences in recovery from sports-related concussion in adolescents.Clin Pediatr (Phila). 2015;55(8):771–775.
46. Bloodgood B, Inokuchi D, Shawver W, et al. Exploration of awareness, knowledge, and perceptions of traumatic brain injury among American youth athletes and their parents.J Adolesc Health. 2013;53(1):34–39.
47. Kroshus E, Garnett BR, Baugh CM, Calzo JP. Social norms theory and concussion education.Health Educ Res. 2015;30(6):1004–1013. 48. Frommer LJ, Gurka KK, Cross KM, Ingersoll CD, Comstock RD, Saliba SA. Sex differences in concussion symptoms of high school athletes.J Athl Train. 2011;46(1):76–84.
49. Broglio SP, Cantu RC, Gioia GA, et al. National Athletic Trainers’ Association position statement: management of sport concussion.J Athl Train. 2014;49(2):245–265.
50. Guskiewicz KM, McCrea M, Marshall SW, et al. Cumulative effects associated with recurrent concussion in collegiate football players: the NCAA Concussion Study.JAMA. 2003;290(19):2549–2555. 51. McGuine TA, Hetzel S, McCrea M, Brooks MA. Protective
equipment and player characteristics associated with the incidence of sport-related concussion in high school football players: a multifactorial prospective study. Am J Sports Med. 2014;42(10): 2470–2478.
52. Funk JR, Rowson S, Daniel RW, Duma SM. Validation of concussion risk curves for collegiate football players derived from HITS data.Ann Biomed Eng. 2012;40(1):79–89.
53. Membership statistics, 2015. USA Hockey Web site. www. usahockey.com/page/show/839306-membership-statistics. Accessed January 3, 2017.
54. Soshnick S. Football participation fell 21% from 2008–13: rugby, lacrosse up. Bloomberg Web site. www.bloomberg.com/news/ articles/2014-12-10/football-participation-fell-21-from-200813-rugby-lacrosse-up. Published December 2014. Accessed January 3, 2017.
55. Emery CA, Meeuwisse WH. Injury rates, risk factors, and mechanisms of injury in minor hockey. Am J Sports Med. 2006; 34(12):1960–1969.
56. Miyashita TL, Diakogeorgiou E, Hellstrom B, Kuchwara N, Tafoya E, Young L. High school athletes’ perceptions of concussion.Orthop J Sports Med. 2014;2(11):2325967114554549.
57. Rowhani-Rahbar A, Chrisman SP, Drescher S, Schiff MA, Rivara FP. Agreement between high school athletes and their parents on reporting athletic events and concussion symptoms.J Neurotrauma. 2016;33(8):784–791.