BIOFEEDBACK TO MODULATE PUSH-OFF INTENSITY IN OLDER ADULTS: IMPLICATIONS AT THE MUSCLE, JOINT, LIMB, AND WHOLE-BODY LEVELS
Michael Gordon Browne
A dissertation submitted to the faculty at the University of North Carolina at Chapel Hill in partial fulfillment of the requirements for the degree of Doctor of Philosophy in the Joint Department of Biomedical Engineering at the University of North Carolina at Chapel Hill and
North Carolina State University.
Chapel Hill 2019
Approved by: Jason R. Franz
© 2019
ABSTRACT
Michael Gordon Browne: Biofeedback to Modulate Push-Off Intensity in Older Adults: Implications at the Muscle, Joint, Limb, and Whole-Body Levels
(Under the direction of Jason R. Franz)
force generating potential and ankle joint moment generation during walking. Finally, we investigated a translational barrier to the clinical implementation of these biofeedback paradigms;
To my parents, who believe in me without question and have supported me every step of the way To Bethany, it’s your turn – go get it
ACKNOWLEDGEMENTS
Given the long, intensive nature of a PhD, there is no way to thank everyone who has played a role in this accomplishment. Nevertheless, I will do my best but if you think you played even a small role in my dissertation, I thank you as well.
First, I thank my advisor, Jason Franz. Jason, you were born to be a PI, and I’m honored to be your first PhD grad. The encouraging, flexible, and excited way that you direct the lab makes us not only a productive lab group, but a truly happy one. Your guidance has given me the confidence to pursue a career in academia as well and to push myself to constantly improve.
I also thank my committee members for their support from day one. Greg, Mike, Caterina, and Carol, I thank you for not only focusing on the science, but on my personal development. I thank you for challenging me, reminding me that science is fun, showing me respect, building my confidence, and reminding me why I do the work that I do. I couldn’t ask for a better committee. For both current and past lab members, thank you for the random and relevant conversations, the help with data and presentations, and generally being supportive throughout. I like you and respect you all immensely.
TABLE OF CONTENTS
LIST OF TABLES ... xi
LIST OF FIGURES ... xii
CHAPTER 1: INTRODUCTION ... 1
CHAPTER 2: THE INDEPENDENT EFFECTS OF SPEED AND PROPULSIVE FORCE ON JOINT POWER GENERATION IN WALKING ... 7
INTRODUCTION ... 7
METHODS... 9
Participants ... 9
Procedures ... 10
Measurement and analysis ... 10
Statistical Analysis ... 12
RESULTS... 12
Propulsive Force ... 12
Joint and Whole Body Mechanics ... 12
Electromyography ... 13
DISCUSSION ... 23
CONCLUSION ... 28
CHAPTER 3: MORE PUSH FROM YOUR PUSH-OFF: JOINT-LEVEL MODIFICATIONS TO MODULATE PROPULSIVE FORCES IN OLD AGE ... 29
INTRODUCTION ... 29
MATERIALS AND METHODS ... 31
Procedures ... 32
Measurement and analysis ... 33
Redistribution Ratio ... 34
Statistical Analysis ... 35
RESULTS... 42
Joint-level modifications used by young and older subjects to modulate FP ... 42
Effects of baseline distal-to-proximal redistribution in older adults ... 43
DISCUSSION ... 44
Joint-level modifications used to modulate propulsive forces ... 45
The effects of baseline distal-to-proximal redistribution ... 46
Age-related biomechanical plasticity? ... 47
Limitations ... 48
CONCLUSION ... 49
CHAPTER 4 PROLOGUE: BIOMECHANICAL EFFECTS OF AUGMENTED ANKLE POWER OUTPUT DURING HUMAN WALKING ... 50
Introduction ... 50
Methods ... 53
Subjects ... 53
Visual Biofeedback ... 53
Experimental Protocol ... 54
Measurement and Analysis ... 55
Statistical Analysis ... 56
Results ... 56
Ankle power and biofeedback efficacy ... 56
Ankle and hip joint kinetics and kinematics ... 57
Discussion ... 63
CHAPTER 4: ANKLE POWER BIOFEEDBACK ATTENUATES THE DISTAL-TO-PROXIMAL REDISTRIBUTION IN OLDER ADULTS ... 69
INTRODUCTION ... 69
METHODS... 71
Participants ... 71
Measurements ... 71
Protocol and biofeedback ... 71
Data analysis ... 73
Statistical Analysis ... 73
RESULTS... 74
DISCUSSION ... 82
CONCLUSION ... 86
CHAPTER 5: INCREASING GASTROCNEMIUS ACTIVITY DURING WALKING MAY ELICIT COUNTERPRODUCTIVE EFFECTS ON FASCICLE BEHAVIOUR IN OLDER ADULTS ... 87
INTRODUCTION ... 87
METHODS... 88
Protocol and biofeedback ... 89
Ultrasound Imaging ... 90
Biomechanical and EMG data analysis ... 91
Statistical Analysis ... 91
RESULTS... 94
DISCUSSION ... 94
Ultrasound Limitations ... 95
INTRODUCTION ... 97
METHODS... 100
Subjects ... 100
Visual biofeedback paradigm ... 100
Experiment 1 Protocol ... 101
Experiment 2 Protocol ... 101
Data collection and analysis ... 102
Statistical analysis ... 104
RESULTS... 105
Experiment 1. The independent effects of walking speed and propulsive force ... 105
Experiment 2. The preferred combination of walking speed and propulsive force ... 106
DISCUSSION ... 113
Independent effects of walking speed and FP on dynamic balance control ... 113
The stability maximization hypothesis ... 115
Decoupling changes in kinematic variability versus dynamic stability ... 116
Step Length Changes ... 117
Implications for biomechanical changes in elderly gait ... 118
Limitations ... 119
CHAPTER 7: RESTORING PROPULSIVE FORCES IN ELDERLY GAIT DOES NOT IMPAIR DYNAMIC STABILITY ... 121
INTRODUCTION ... 121
METHODS... 122
RESULTS AND DISCUSSION ... 122
CONCLUSIONS ... 123
CONCLUSIONS... 126
LIST OF TABLES
Table 1 ... 16
Table 2 ... 38
Table 3 ... 81
LIST OF FIGURES
Figure 1 ... 15
Figure 2 ... 17
Figure 3 ... 18
Figure 4 ... 19
Figure 5 ... 20
Figure 6 ... 21
Figure 7 ... 22
Figure 8 ... 36
Figure 9 ... 37
Figure 10 ... 39
Figure 11 ... 40
Figure 12 ... 41
Figure 13 ... 59
Figure 14 ... 60
Figure 15 ... 61
Figure 16 ... 62
Figure 17 ... 76
Figure 18 ... 77
Figure 19 ... 78
Figure 20 ... 79
Figure 21 ... 80
Figure 23 ... 107
Figure 24 ... 108
Figure 25 ... 109
Figure 26 ... 110
Figure 27 ... 111
Figure 28 ... 124
CHAPTER 1: INTRODUCTION
Declines in walking performance are extremely prevalent with aging; 17% of people 65– 74 years old and 28% of 75–84 years old self-report walking difficulties that affect performance of daily activities (US Dept of Health and Human Services, 2011). Preferred walking speed may be considered one of such walking difficulties as it, on average, decreases by 16% per decade after age 60 and is also correlated with reduced lifespan [1]. Furthermore, preferred walking speed has been shown to be an accurate predictor of overall health and quality of life among the aging population [2-4]. Unfortunately, it is seemingly impossible to isolate a singular cause for a reduction in preferred walking speed as older adults manifest a large slew of biomechanical and neurological changes. At perhaps the highest biomechanical level, walking speed scales linearly with stride length and propulsive ground reaction forces (FP) during the push-off phase of walking [5-7]. Accordingly, slower walking speeds are associated with shorter strides and reduced FP not only with age [8], but also following stroke [9] and multiple sclerosis [10]. Even prior to succumbing to slower walking speeds, however, older adults walk with shorter strides and decreased push-off intensity, making it challenging to draw conclusions without comparing between similar walking speeds.
the knee and hip [5, 11-17]. Indeed, older adults generate up to 26% less trailing limb power during push-off compared to young adults walking at the same speed [12, 16, 18, 19]. In order to maintain walking speed, this power must be compensated for by other musculature. Accordingly, we observe two independent changes in hip muscle power generation: the contralateral hip extensors act to redirect the center of mass forward through early to mid-stance phase [20] while the ipsilateral hip flexors perform a greater “pull-off”, acting to pull the leg into swing at the termination of stance phase moving into swing [21]. One main goal of this research is to reverse this distal-to-proximal redistribution – ultimately encouraging older adults to walk with similar joint- and limb-level biomechanics to their younger counterparts.
maximum force generating capacity alone does not explain the changes in push-off intensity, neuromuscular control should be considered. Indeed, aging has been associated with altered motor unit discharge properties [37-40], reduced motor unit size and numbers [41, 42] and slowing in whole muscle contractile properties [43-46]. But irrespective of maximum force generating capacity, muscle force is largely explained by a force-length relationship which is extrapolated from the sarcomere level [47]. In short, muscles operate on a force-length bell-curve such that, given a certain activation and contractile velocity, muscles may generate maximum force at approximately neutral length though shorter or longer muscle lengths prohibit maximum force generation [47]. Older adult plantarflexor muscles have been shown to operate at shorter lengths than young adults during walking [48, 49]. Thus, older adults must either increase activation of plantarflexor muscles or operate at more optimal lengths (i.e. farther up the force-length curve) to increase muscle force output during walking. Increased activation during walking, however, also posed the potential to further shorten muscles and inhibit force generation abilities. Unfortunately, it is poorly understood how older adults may leverage muscle-level biomechanics to generate larger forces and, as a result, greater push-off intensity. As another main goal of this dissertation, we plan to investigate this force-length-activation relationship for older adults during walking to help understand some of the mechanisms by which older adults may modulate push-off intensity.
proprioception of older adults [55] and older adults with proprioceptive disadvantages have been shown to suffer from larger balance impairments [55, 56]. An additional factor to consider with the cognitive declines associated with aging is a fear of falling, most prevalent in those who have fallen previously [57, 58]. Fear of falling has been correlated with global representations of strength as well as increased anterior-posterior sway tasks which may allude to a further contribution of cognition to falls risk [58-60]. But, in their seminal (1990) paper, David Winter and colleagues suggested that older adults decreased their “destabilizing” push-off, shortened their stride, then slowed their walking speed in order to reduce falls risk [61]. Further work has anecdotally supported this hypothesis demonstrating that walking slower can improve metrics of stability in the fit and healthy elderly [62] and shortened stride lengths at a constant speed can reduce falls risk when young adults were subjected to a slip [63]. Still, when walking at the same speed as young, older adults walk with impaired balance control [64-67]. So, while it is clear that older adults walk with balance deficits, these combined results are unable to explain the role that balance control may play in regulating push-off intensity and vice versa. Thus, rehabilitative technologies or strategies to enhance push-off intensity in older adults must appreciate the potentially interdependent effects on walking balance integrity.
symmetry in populations impacted unilaterally such as persons post-stroke [71, 75] or with an amputation [76, 77]. Recently, visual biofeedback has been implemented again in persons post-stroke to improve affected-limb propulsive ground reaction forces [78]. Unfortunately, there is no consensus for what type of biofeedback is most appropriate and, in fact, the only identified study evaluating different types of sensory feedback found that patient preference and study design were the factors to consider when implementing a biofeedback paradigm [79]. Ultimately, discrete visual biofeedback was chosen as a testbed for this research to enable a closed-loop system to encourage volitional changes in various measures of push-off intensity.
CHAPTER 2: THE INDEPENDENT EFFECTS OF SPEED AND PROPULSIVE FORCE
ON JOINT POWER GENERATION IN WALKING1
INTRODUCTION
Walking speed is modulated using propulsive forces generated during push-off (i.e., the anterior component of the ground reaction force vector; FP), and both preferred speed and FP decrease considerably with aging [8]. However, even prior to a clinically relevant decline in walking speed, a reduction in FP may be accompanied by potentially unfavorable changes in joint power generation. For example, compared to young adults walking at the same speed, older adults exhibit a redistribution of mechanical power generation from the propulsive plantarflexor (i.e., ankle extensor) muscles to more proximal muscles crossing the knee and hip [5, 11]. In addition to preceding the age-related slowing of preferred speed, these changes may in part mediate the age-related reduction in walking economy [80]. Intuitively, reduced FP and slowed preferred speed arise at least in part from altered joint kinetics, in turn governed by joint-level neuromuscular constraints (e.g., muscle weakness). However, the presumably complex interaction between joint-level coordination, whole-body FP, and walking speed is not well understood, even in healthy young adults.
1 Browne MG, Franz JR. The independent effects of speed and propulsive force on joint power generation in walking. J Biomech. 2017;55:48-55. Epub 2017/03/07. doi:
All biomechanical features of walking scale with speed. At the whole-body level, slower walking speeds are accompanied by nearly linear reductions in peak FP, propulsive impulse, and thus total trailing leg positive work performed during push-off [8, 81, 82]. Walking speed effects on leg joint kinetics are also well described in the literature [7, 83-86]. For example, Lelas et al. (2003) showed that peak leg joint moments and power generation decreased systematically when walking slower and could be well-predicted in healthy subjects based on their walking speed alone [7]. More recently, Farris and Sawicki (2012) revealed that although walking slower reduced peak leg joint kinetics and total positive joint work, the relative contributions from muscles spanning the ankle, knee, or hip to that total was preserved across walking speed [87]. We interpret these findings in healthy young adults to suggest that, at least in the absence of joint-level neuromuscular constraints, maintaining these patterns of joint-level coordination is an important and highly functional component of walking.
of preferred speed, is fundamentally different from that associated with walking slower. A more complete understanding of the biomechanical changes that precede the slowing of walking speed may have broad implications; similar and simultaneous interdependent changes in walking speed, FP, and joint kinetics also emerge with more acute mobility impairment such as that following stroke [93, 94]. However, unlike the well-documented biomechanical changes due to walking speed, to our knowledge no study to date has successfully decoupled the independent effects of reducing FP on joint power generation from the neuromuscular constraints that may precipitate them. Lewis and Ferris (2008) attempted to do so using verbal cues, but these were met with relatively invariant leg joint kinetics. Interestingly, those authors cited a lack of neuromuscular constraints as a likely explanation [74].
The purpose of this study was to investigate the interaction between walking speed, FP, and joint power generation during walking in young adults. Using systematic adjustments in treadmill speed and visual biofeedback based on real-time FP measurements, we tested the hypotheses that: (i) walking slower reduces FP and total positive joint work without affecting joint-level coordination, while conversely, (ii) reducing FP modulates joint-joint-level coordination without affecting total positive joint work. Finally, given their prominent role in generating propulsion [95], we hypothesized that plantarflexor muscle activity during push-off would decrease progressively with incremental reductions in walking speed or FP.
METHODS
Participants
deviation age of 26.2 ± 3.1 years, height of 1.75 ± 0.09 m, and body mass of 71.6 ± 8.8 kg. All subjects were free of neurologic impairments and musculoskeletal injury.
Procedures
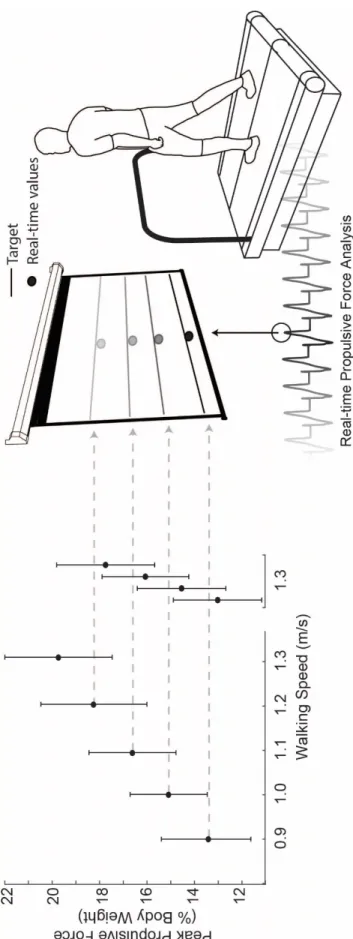
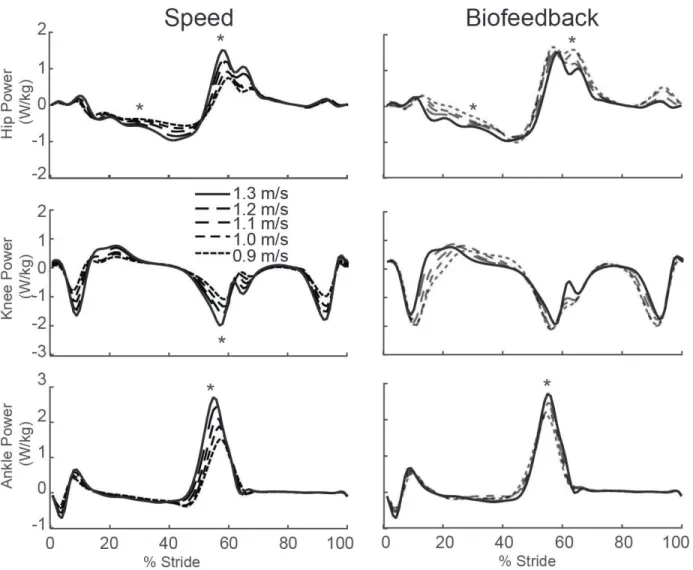
Subjects first walked normally on a dual-belt, force-sensing treadmill (Bertec, Columbus, OH) at 1.3 m/s, approximating their preferred speed, and at four slower speeds (0.9 – 1.2 m/s) in 0.1 m/s increments for 1 min each in randomized order. We immediately processed and extracted subject’s average bilateral peak FP from each walking speed for use as target values in subsequent visual biofeedback trials. For trials incorporating visual biofeedback, a custom Matlab (Mathworks, Natick, MA) script continuously computed the average bilateral peak FP from each set of four consecutive steps and visually displayed those values in real-time (Fig. 1). Subjects completed an exploration trial of at least 3 min while freely modulating their instantaneous FP on the projected display to become familiar with the biofeedback paradigm. Finally, subjects walked at 1.3 m/s for 2 min each while matching their instantaneous FP to target values representing the averaged FP extracted from the slower speeds. We sought to investigate naturally emergent biomechanical patterns underlying reductions in FP, and thus did not instruct subjects how to attain target values. We only explained the timing of push-off and that the muscles of the leg generated a force during that time to propel their body forward.
Measurement and analysis
muscle activity from the medial gastrocnemius (MG), a major plantarflexor muscle, and its primary antagonist, the tibialis anterior (TA), at 1000 Hz using wireless electrodes (Delsys Trigno, Natick, MA) applied using conductive gel.
We analyzed only the second minute of biofeedback trials to allow subjects time to reach each target. Marker trajectories and ground reaction forces were filtered using 4th order low-pass Butterworth filters with cutoff frequencies of 6 Hz and 100 Hz, respectively. We then used the static standing calibration and functional hip joint centers from a leg circumduction task [96] to scale a seven segment, 18 degree-of-freedom model of the pelvis and right and left legs [97]. We used the filtered marker and force data to estimate hip, knee, and ankle joint angles, moments, and powers using an inverse dynamics routine described in detail previously [12]. From each subject’s average curve, we extracted values corresponding to local minima and maxima for each kinematic and kinetic variable. Further, due to the lack of a distinct peak, we also extracted values corresponding to midstance (i.e., 30% stride). Finally, at the limb level, we calculated the total work performed on the center of mass (CoM) by the leading and trailing legs during double support and the stance leg during single support using the Individual Limbs Method (ILM) [82].
Statistical Analysis
Shapiro-Wilks tests confirmed normal distributions for each outcome measure (i.e., FP, hip, knee, and ankle joint angles, moments, and powers, total positive joint work and relative joint contributions, CoM work, and EMG activity). We then tested for main effects of speed and FP on all outcome measures using two one-way repeated measures analyses of variance. When a significant main effect was found, planned post-hoc pairwise comparisons were focused between normal walking at 1.3 m/s and either the slower speed conditions (Hypotheses 1 and 3) or the reduced FP conditions (Hypotheses 2 and 3). Finally, paired t-tests determined the success of subjects’ reaching FP targets. Significance was defined using an alpha level of 0.05.
RESULTS
Propulsive Force
FP decreased linearly with slower walking speed by up to 32% across the range of speeds tested (main effect, p<0.001) (Fig. 1). When walking at 1.3 m/s, subjects also significantly and systematically reduced their average FP to match the prescribed targets (main effect, p<0.001) (Fig. 1). Subjects average FP differed significantly from the target values only for those extracted from the 1.0 m/s (p=0.011) and 1.1 m/s (p<0.001) conditions, and in both cases subjects undershot the target values. For the same reduction in FP, walking slower and walking with smaller FP elicited comparable reductions in stride length (p’s<0.001) (Table 1).
Joint and Whole Body Mechanics
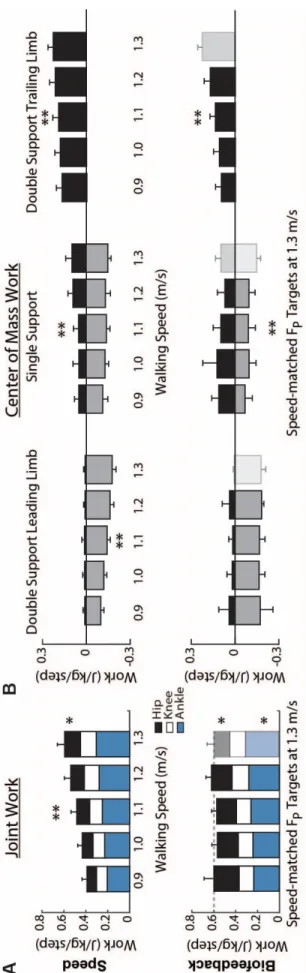
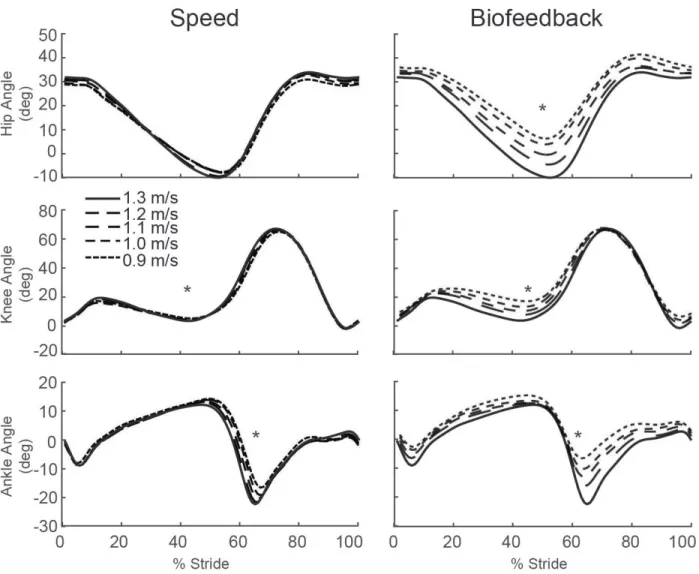
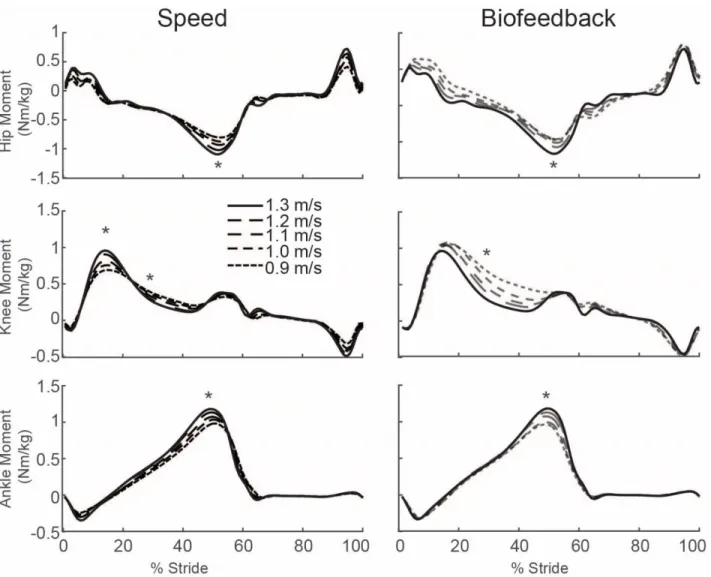
to total positive work (p=0.005) (Fig. 2A). Positive CoM work, both that performed by the trailing leg during push-off and by the stance leg during single support, decreased systematically with slower speed (p’s<0.001) (Fig. 2B). For example, compared to walking at 1.3 m/s, positive push-off work and positive single support work decreased by 27% and 48%, respectively, when walking at 0.9 m/s. Finally, walking slower elicited modest but statistically significant reductions in knee extension during stance (p=0.001) and ankle plantarflexion during push-off (p<0.001) (Fig. 3).
Despite exerting identical FP during push-off, walking at 1.3 m/s while independently reducing FP using biofeedback elicited substantially different biomechanical changes from those observed when walking slower. With smaller FP, total positive joint work remained unchanged, regardless of reduction in force (Fig. 2A). However, for the lowest FP condition compared to walking normally, the ankle’s contribution to total positive joint work per step decreased from 51% to 39% (p<0.001) and the hip’s contribution increased from 25% to 39% (p<0.001) when walking with smaller FP. These changes were accompanied by significant decreases in ankle moment (p<0.001) and increases in hip moment (p<0.001) (Fig. 4). To reduce FP, subjects progressively decreased positive CoM work performed by the trailing leg during push-off by up to 58% (p’s<0.001) (Fig. 2B). Moreover, and in contrast to walking slower, reducing FP tended to increase positive CoM work during single support (p=0.057), also the phase in which we observed the most prominent increase in hip joint power generation (Fig. 5). Finally, regarding kinematic changes, reducing FP decreased extension at all leg joints (p’s<0.001) (Fig. 3).
Electromyography
Table 1.Mean ± standard deviation stride length during normal and biofeedback trials (m)
Paired Speed (m/s) Normal Biofeedback
0.9 1.15 ± 0.06 1.16 ± 0.08
1.0 1.21 ± 0.06 1.19 ± 0.08
1.1 1.27 ± 0.07 1.24 ± 0.06
1.2 1.34 ± 0.06 1.32 ± 0.06*
1.3 1.40 ± 0.07 N/A
* significantly different between Normal and Biofeedback (p<0.05)
18
Figure 4: Group average lower extremity joint angles as modified by reductions in speed (left) and FP (right). Positive values indicate flexion. Gray dashed lines represent biofeedback trials at 1.3 m/s with FP target values prescribed from the corresponding walking speeds. Asterisks (*) represent significant main effects of speed or reduced FP.
19
Figure 6: Group average lower extremity joint moments as modified by reductions in speed (left) and FP (right). Positive values indicate external extension moments. Gray dashed lines represent biofeedback trials at 1.3 m/s with FP target values prescribed from the corresponding walking speeds. Asterisks (*) represent significant main effects of speed or reduced FP.
Figure 8: Group average lower extremity joint powers as modified by reductions in speed (left) and FP (right). Positive values indicate power generation. Gray dashed lines represent biofeedback trials at 1.3 m/s with FP target values prescribed from corresponding walking speeds. Asterisks (*) represent significant main effects of speed or reduced FP.
DISCUSSION
Humans modulate their walking speed using propulsive forces (FP) generated during push-off. Accordingly, clinically relevant reductions in preferred speed in old age are universally accompanied by smaller peak FP, which may in turn be governed by complex changes in leg joint kinetics. This high degree of interdependence among walking speed, FP, and underlying joint kinetics may confound efforts to investigate the onset and progression of biomechanical changes in aging. Therefore, in this study, we decoupled and quantified the independent effects of walking slower and reducing FP on leg joint power generation during the stance phase of walking. First, our results reveal that, despite being highly interdependent, reducing FP elicits profound effects on leg joint kinetics that differ substantially from those due to reducing walking speed. Second, and much more surprisingly, we found that young adults, in the absence of joint-level neuromuscular constraints, reduced FP using naturally emergent joint- and limb-level biomechanical patterns that very closely resemble those due to aging.
least in the absence of joint-level neuromuscular constraints, the maintenance of joint-level coordination is a functionally relevant component of normal, unimpaired walking. Thus, we posit that the presence of altered joint-level coordination, regularly observed with aging but not independently associated with walking speed, is more closely associated foremost with reductions in FP.
to reducing FP. Specifically, subjects progressively reduced trailing limb positive work during push-off which, given the requirement to preserve their walking speed, subsequently precipitated an increase in net positive work performed during single support. Cumulatively, and as we elaborate more below, these joint- and limb-level biomechanical changes elicited solely by prescribing smaller FP are precisely those most ascribed to elderly gait.
Young adults walking at a given speed but with smaller FP elicited a multitude of biomechanical adaptations reminiscent of elderly gait. Consistent with our young subjects walking with smaller FP, older adults walk with a well-described distal to proximal redistribution of power generation during walking compared to young adults walking normally [11, 18] In addition, Franz and Kram (2014) reported that older adults exhibit the phase-dependent redistribution of positive CoM during walking, from the trailing limb during push off to the stance limb during single support [5], also evident in our young subjects. We also noted several kinematic similarities between our young subjects responding to biofeedback and characteristic age-related changes in walking, including reduced peak hip extension and shorter step lengths. Thus, our findings may allude to complex associations between joint- and limb-level biomechanical changes that emerge with age-related mobility impairment and the onset of reductions in FP during push-off.
reduction in MG activity was systematically coupled with a step-wise increase in TA activity with smaller FP. Increased TA activity, and presumably muscle force, would facilitate a reduction in the net plantarflexor moment during push-off, a second major determinant of FP [99]. Moreover, these neuromuscular changes used to reduce FP were distinct from the simultaneous reductions in both MG and TA activity used to walk slower, despite very similar consequences on the net ankle moment during push-off. Thus, in the absence of neuromuscular constraints (i.e., muscle weakness, etc.), our findings suggest that changes to muscle recruitment patterns are capable of contributing to reduced ankle power generation and FP during push-off. This is particularly relevant given the profound changes in leg muscle recruitment patterns that emerge in old age [100, 101].
extracted from the slowest speeds. One possible explanation is that a redistribution to more proximal leg muscles for power generation is energetically costly [103]. We note that older adults consume oxygen 15-20% faster than young adults during walking. Thus, future work should investigate the extent to which age-related declines in walking economy are biomechanically mediated as well as the energetic consequences of targeted interventions designed to enhance push-off power generation via FP [80].
CONCLUSION
CHAPTER 3: MORE PUSH FROM YOUR PUSH-OFF: JOINT-LEVEL
MODIFICATIONS TO MODULATE PROPULSIVE FORCES IN OLD AGE2
INTRODUCTION
Older adults (age>65 years) tend to walk at slower speeds with shorter steps and higher metabolic energy costs than young adults [1, 13, 89, 91]. Often preceding, and likely contributing to these age-associated changes is a prominent decrease in push-off intensity generated predominantly from the ankle plantarflexor muscles [11, 16, 18, 104]. As a potential compensation for this decrease in ankle power, older adults rely more than young adults on hip musculature for power generation, a phenomenon known as a distal-to-proximal redistribution [11]. This redistribution may explain, at least in part, the greater metabolic energy costs of older adults and could thereby be considered maladaptive; the longer muscle fascicles and relatively short tendons spanning the hip are less metabolically favorable than the short fascicles and long, series elastic tendons spanning the ankle [105, 106]. Moreover, increases in proximal leg muscle power generation appear unable to completely offset age-related reductions in ankle power output, as older adults continue to exert smaller propulsive forces (the peak anterior component of the ground reaction force during push-off [FP]) than young adults walking at the same speed [5].
Despite reductions in ankle power output and FP compared to young adults, many older adults retain the ability to increase both during walking when faced with task requirements that
2 Browne MG, Franz JR. More push from your push-off: Joint-level modifications to modulate propulsive forces in old age. PLoS One. 2018;13(8):e0201407. Epub 2018/08/09. doi:
challenge propulsion. For example, older adults increase ankle power output by up to 24% to walk at speeds faster than preferred [14] and increase FP by approximately 40% to walk uphill at a 9° grade [5]. Based on the apparent availability of these “propulsive reserves” in older adults, our previous work has also demonstrated that visual biofeedback can encourage older adults to increase their FP by up to 25% when walking on level ground at their preferred speed. More curiously, older subjects in that study retained the ability to exert even larger propulsive forces than those exerted normally by young adults [6]. Those subjects simultaneously exhibited increased plantarflexor muscle activation during push-off, alluding to potential neuromechanical improvements at the ankle (i.e. moment and/or power). Still, the specific joint-level modifications used by older adults to enhance their FP generation has yet to be elucidated – leaving a major gap in our understanding.
potentially favorable response that could mitigate compensatory mechanical power demands at the hip? Alternatively, are older adults functionally limited in their ability to increase ankle power output during walking, a constraint that would require exacerbating their reliance on more proximal leg muscles? Understanding the joint-level mechanisms by which older adults enhance FP generation during walking is important for informing the development and prescription of interventions aimed at improving walking performance in the elderly.
The purpose of this study was to identify the joint-level modifications used by young and older adults to modulate FP when walking at their preferred speed. We first hypothesized that young and older adults would increase/decrease FP by increasing/decreasing ankle power. Second, based on compensatory trade-offs between the ankle and hip musculature, we hypothesized that such changes in FP would be met by changes in hip power that oppose those in ankle power. This outcome would imply that increased FP may reverse the distal-to-proximal redistribution in older subjects while alternatively that decreases in FP would do the opposite, increasing the reliance on hip musculature. Finally, we hypothesized that baseline distal-to-proximal redistribution (i.e. the amount an older adult relies on hip versus ankle musculature for mechanical power generation) would influence the means by which they increase push-off intensity. Specifically, older adults with a greater baseline distal-to-proximal redistribution may be more inclined to exacerbate that redistribution when increasing FP.
MATERIALS AND METHODS
Participants
(i.e., 23.0 %BW vs. 20.2 %BW) [6]. Thus, we recruited 9 healthy young adults (5F/4M) with mean (standard deviation) age: 25.1 (5.6) years, height: 1.76 (0.06) m, and mass: 72.0 (7.1) kg and, to address a subgroup analysis described in more detail below, 16 older adults (11F/5M) with age: 75.3 (3.5) years, height: 1.68 (0.09) m, and mass: 65.0 (11.5) kg to participate. Our exclusion
criteria, assessed via health questionnaire, were BMI≥30, self-reported inability to walk
comfortably for 20 consecutive minutes, lower extremity fracture within 6 months, neurological disorder affecting the legs, pain during walking, medication causing dizziness, leg prosthesis, and requiring an assistive aid for ambulation. All subjects provided written, informed consent according to the University of North Carolina Institutional Review Board prior.
Procedures
harder or softer with their foot during push-off, the dot would rise or fall, respectively. Finally, subjects walked at their PWS for 90 s each while matching their instantaneous FP to targets representing ±10% and ±20% different from preferred, presented in fully-randomized order.
Measurement and analysis
In addition to the exploration trial, we also allowed each subject 30 seconds to accommodate to each condition by using the final 60 seconds for all analyses. Pelvis and lower extremity kinematics were recorded using a 14-camera motion capture system (Motion Analysis Corporation, Santa Rosa, CA, USA) operating at 100 Hz. We used 14 anatomical markers placed bilaterally on subjects’ first and fifth metatarsal heads, calcaneus, lateral malleoli, lateral knee joint center (placed between the tibial and femoral epicondyles), anterior superior iliac spines, and posterior superior iliac spines. An additional 14 tracking markers were attached bilaterally using asymmetric rigid clusters to subjects’ shank and thigh segments. These 28 markers were used during all walking trials and medial knee and ankle markers were added during a static standing trial.
We also estimated the positive ankle angular impulse by calculating the area under the positive portion of the ankle moment versus time curve. GRFs were normalized to body weight and reported as a percent and all joint kinetic outcomes were normalized to body mass. We calculated stride length and trailing limb extension at peak FP according to previously published methods [99]. Finally, we took the average between left and right legs for each outcome variable for statistical analysis.
Redistribution Ratio
We divided our older adult subjects into two cohorts: one with a less exaggerated and one with a more exaggerated distal-to-proximal redistribution. Here, we developed the Redistribution Ratio (RR) which uses stance phase positive ankle and hip joint work to operationally define subjects’ reliance on distal vs. proximal leg muscles in generating positive power during walking. The RR is defined according to Equation 1:
𝑅𝑅𝑅𝑅= 1− 𝑊𝑊𝐴𝐴+−𝑊𝑊𝐻𝐻+ 𝑊𝑊𝐴𝐴++𝑊𝑊𝐻𝐻+ (1)
Statistical Analysis
Table 2. Peak kinematic and kinetic outcome measures for all groups and conditions.
Fp Biofeedback Target Main Effect
-20% -10% Preferred +10% +20% p-value
Peak Fp (% Body Weight)
Young 16.7 ± 1.3* 18.9 ± 1.5* 21.1 ± 1.8 22.8 ± 1.8* 25.3 ± 2.2* <0.001
Old 14.6 ± 2.9* 16.0 ± 3.3* 17.1 ± 4.3 18.5 ± 4.3* 19.5 ± 4.7* <0.001
RRLow -- -- 16.9 ± 3.7 18.6 ± 3.7* 19.6 ± 4.0* <0.001
RRHigh -- -- 17.2 ± 5.0 18.4 ± 5.1* 19.4 ± 5.6* <0.001
Peak Ankle Plantarflexion (°)
Young -13.9 ± 5.1* -18.6 ± 4.9* -23.0 ± 7.6 -28.5 ± 7.7* -30.2 ± 7.8* <0.001
Old -14.1 ± 8.0* -16.5 ± 8.5 -18.9 ± 8.0 -20.5 ± 8.8* -20.6 ± 8.2* <0.001
RRLow -- -- -20.5 ± 8.1 -22.4 ± 8.2 -22.2 ± 7.5 NS
RRHigh -- -- -17.3 ± 8.2 -18.6 ± 9.5 -19.1 ± 9.0 NS
Peak Hip Extension (°)
Young -8.1 ± 6.0* -10.1 ± 6.7 -12.3 ± 4.6 -15.0 ± 4.9* -15.5 ± 4.7* <0.001
Old 0.0 ± 6.6* -2.6 ± 6.8* -5.7 ± 7.2 -4.8 ± 7.2 -5.5 ± 7.3 <0.001
RRLow -- -- -6.5 ± 8.4 -4.9 ± 9.1 -5.9 ± 9.0 NS
RRHigh -- -- -4.9 ± 6.2 -4.6 ± 5.2 -5.1 ± 5.7 NS
Trailing Limb Extension (°)
Young 14.6 ± 1.3* 15.1 ± 3.0 16.7 ± 1.6 18.0 ± 1.5* 18.7 ± 1.3* <0.001
Old 14.4 ± 2.7* 15.7 ± 2.6 16.3 ± 2.9 17.0 ± 2.7* 17.4 ± 3.0* <0.001
RRLow -- -- 16.8 ± 2.6 17.4 ± 2.5 17.7 ± 2.9 NS
RRHigh -- -- 15.7 ± 3.3 16.6 ± 3.1* 17.2 ± 3.2* <0.001
Stride Length (m)
Young 1.24 ± 0.09* 1.30 ± 0.10 1.34 ± 0.05 1.41 ± 0.09* 1.46 ± 0.11* <0.001
Old 1.10 ± 0.14* 1.19 ± 0.15 1.21 ± 0.15 1.22 ± 0.12 1.24 ± 0.13 <0.001
RRLow -- -- 1.23 ± 0.19 1.21 ± 0.16 1.23 ± 0.15 NS
RRHigh -- -- 1.19 ± 0.10 1.23 ± 0.09 1.26 ± 0.12 NS
Peak Ankle Moment (Nm/kg)
Young -1.45 ± 0.12* -1.54 ± 0.17* -1.60 ± 0.17 -1.59 ± 0.18 -1.54 ± 0.18 <0.001
Old -1.27 ± 0.12* -1.29 ± 0.11* -1.36 ± 0.13 -1.35 ± 0.14 -1.31 ± 0.15 0.008
RRLow -- -- -1.41 ± 0.12 -1.39 ± 0.16 -1.32 ± 0.17 NS
RRHigh -- -- -1.32 ± 0.13 -1.31 ± 0.12 -1.30 ± 0.14 NS
Ankle Angular Impulse (Nms/kg)
Young 0.38 ± 0.05* 0.43 ± 0.05 0.44 ± 0.03 0.51 ± 0.04* 0.51 ± 0.07* <0.001
Old 0.40 ± 0.07 0.43 ± 0.07 0.43 ± 0.07 0.49 ± 0.09* 0.50 ± 0.09* <0.001
RRLow -- -- 0.44 ± 0.06 0.50 ± 0.09* 0.51 ± 0.09* <0.001
RRHigh -- -- 0.43 ± 0.07 0.48 ± 0.09* 0.49 ± 0.09* <0.001
Peak Ankle Power (W/kg)
Young 3.25 ± 0.78* 3.52 ± 0.87* 3.85 ± 0.85 3.79 ± 0.79 3.72 ± 0.89 0.001
Old 2.68 ± 0.68 2.56 ± 0.62* 2.79 ± 0.66 2.68 ± 0.61 2.54 ± 0.61* 0.037
RRLow -- -- 2.78 ± 0.74 2.72 ± 0.65 2.46 ± 0.52 NS
RRHigh -- -- 2.80 ± 0.61 2.65 ± 0.62 2.62 ± 0.71 NS
H1 Hip Power Peak (W/kg)
Young 1.09 ± 0.37 1.04 ± 0.35 0.98 ± 0.42 0.91 ± 0.34 0.71 ± 0.21 0.007
Old 1.03 ± 0.25 1.08 ± 0.29 1.05 ± 0.28 1.10 ± 0.34 1.11 ± 0.35 NS
RRLow -- -- 0.94 ± 0.16 1.00 ± 0.25 0.99 ± 0.21 NS
RRHigh -- -- 1.17 ± 0.34 1.21 ± 0.4 1.23 ± 0.43 NS
H3 Hip Power Peak (W/kg)
Young 1.59 ± 0.30 1.55 ± 0.27 1.62 ± 0.43 1.40 ± 0.30* 1.28 ± 0.31* <0.001
Old 1.45 ± 0.42 1.45 ± 0.45 1.44 ± 0.49 1.35 ± 0.40 1.28 ± 0.43 NSa
RRLow -- -- 1.30 ± 0.36 1.29 ± 0.28 1.15 ± 0.21 NS
RRHigh -- -- 1.58 ± 0.58 1.41 ± 0.51* 1.41 ± 0.55 0.033
Redistribution Ratio
Young 0.95 ± 0.15* 0.86 ± 0.17* 0.75 ± 0.16 0.66 ± 0.11 0.57 ± 0.13* <0.001
Old 1.04 ± 0.17* 1.01 ± 0.15 0.96 ± 0.16 0.94 ± 0.20 0.94 ± 0.18 0.013
RRLow -- -- 0.84 ± 0.08 0.82 ± 0.11 0.85 ± 0.08 NS
RESULTS
Joint-level modifications used by young and older subjects to modulate FP
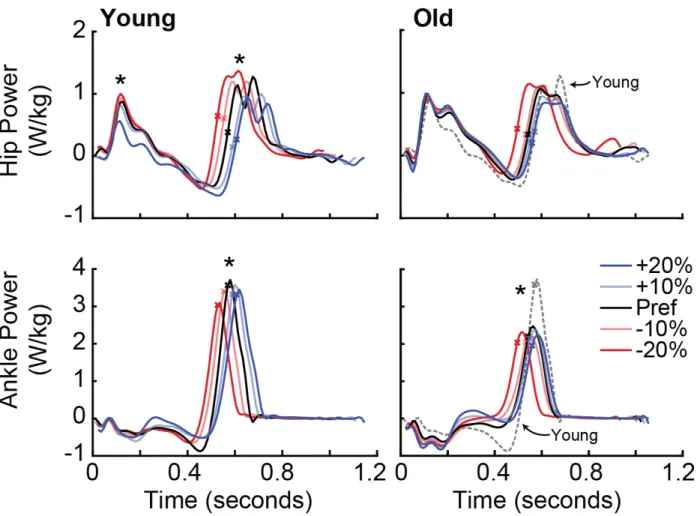
Preferred walking speed, and thus the treadmill speed, did not significantly differ between young, 1.30 (0.12) m/s, and older subjects, 1.25 (0.20) m/s (p=0.498). Compared to young adults, older adults walked habitually at their preferred speed with 19% smaller FP (p=0.014, Fig. 8B), 15% smaller peak ankle moment (p<0.001), 28% smaller peak ankle power (p=0.002), and a 29% higher RR indicative of a distal-to-proximal redistribution (Fig. 9, Table 1). Older (young) adults successfully modified their FP to respective targets, by an average of -14.6% (-20.6%) and +14.1% (+20.3%) when targeting changes of -20% and +20%, respectively (Fig. 8B, Table 2).
Subjects also altered their hip and ankle joint kinematics when modulating FP. Specifically, we found for both age groups significant main effects of FP target condition on trailing limb extension,
peak ankle and hip extension, and stride length (p≤0.001) (Fig. 10 and Table 2). Pairwise
comparisons in older (young) adults showed that changes in trailing limb extension mirrored those in FP, decreasing by 11.6% (12.6%) when targeting 20% smaller than preferred FP, and increasing by 7.2% (12.1%) when targeting 20% larger than preferred FP in older (young) subjects. However, the pairwise response for other outcome measures differed between groups. Compared to preferred walking, young adults decreased peak ankle and hip extension and walked with shorter strides when targeting smaller FP and increased each when targeting larger FP (p<0.001). In contrast, we found significant pairwise comparisons in older adults for decreases in ankle plantarflexion, peak hip extension, and shorter stride length when targeting smaller than preferred FP (p<0.033); only ankle plantarflexion increased significantly when older adults targeted larger than preferred FP (p<0.047).
Effects of baseline distal-to-proximal redistribution in older adults
RR was indistinguishable between RRLow subjects and young adults (mean [sd]: 0.84 [0.08] vs. 0.75 [0.16], p=0.168), but was significantly higher in RRHigh subjects (1.08 [0.20], p<0.001 vs. Young, p<0.001 vs RRLow; Table 1). RRLow and RRHigh did not significantly differ in any outcome measure during preferred walking, including PWS. In addition, both groups of older subjects were relatively successful using FP biofeedback, increasing by 15.5% (RRLow) and 12.7% (RRHigh) when targeting 20% larger than preferred FP (Fig. 8B).
for example in the +10% condition, RRHigh but not RRLow decreased hip flexor power generation during push-off by 11% (p=0.047). In addition, only RRHigh subjects increased trailing limb extension when targeting larger than preferred FP (p<0.001). Conversely, RRLow subjects did not modulate hip power nor any kinematic outcome measure when targeting larger than preferred FP.
DISCUSSION
Joint-level modifications used to modulate propulsive forces
Positive power generated about the ankle during the push-off phase of walking contributes both to accelerating the body’s center of mass (CoM) and initiating leg swing [19, 82]. Consistent with previous efforts to improve push-off intensity during walking, neither young nor older adults responded to biofeedback designed to increase FP with any increase in peak ankle power [74]. We caution against interpreting this finding to imply that older adults are incapable of increasing their peak ankle power generation during walking. While the functional consequences of sarcopenia (i.e., the loss of skeletal muscle mass) and muscle weakness are well-documented [111, 112], our results imply only that older adults opt not to alter their peak ankle moment nor power when walking with larger than preferred FP. Indeed, because our young adult subjects also failed to increase their peak ankle joint kinetics, our results do not necessarily allude to any specific functionally limiting impairment in elderly gait. Further, the ability of both young and older adults to increase positive ankle angular impulse suggests an increase in cumulative loading of ankle musculature that does not reveal itself in values isolated to the push-off phase of walking. Our findings highlight a clear opportunity for the implementation of biofeedback paradigms that focus specifically on enhancing mechanical power output from the plantarflexor muscles, perhaps through the use of real-time inverse dynamics [113].
increases in walking speed and not a prerequisite for increasing FP. Indeed, ankle joint moment and power increase relatively linearly with walking speed [7, 110]. Instead, at a given walking speed, increased trailing limb extension would serve to reorient the GRF vector more anteriorly and thereby produce larger FP. In addition, if this change in limb posture were to permit the GRF vector to pass closer to the hip joint during push-off, this may explain the smaller hip flexor power requirements when walking with larger than preferred FP that we discuss in more detail below.
The effects of baseline distal-to-proximal redistribution
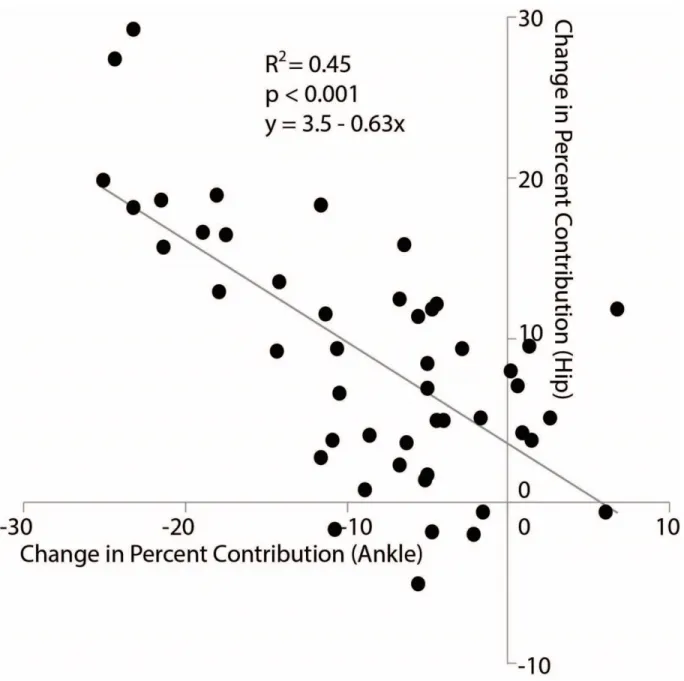
As a second major goal of this study, we sought to determine whether baseline distal-to-proximal redistribution (i.e. the amount to which an older adult relies on hip versus ankle musculature for mechanical power generation) would influence how older adults increase their push-off intensity. Here, we introduce the redistribution ratio, a metric for quantifying the extent to which an individual walks with a distal-to-proximal redistribution calculated using the total positive ankle and hip joint work performed across the stance phase. Indeed, our older adult subjects walked with a wide spectrum of baseline redistribution (Fig. 11) that may be relevant to understanding their response to interventions designed to enhance push-off intensity. RRLow subjects successfully increased FP to values larger than preferred, but apparently did so by only increasing ankle angular impulse. In contrast, RRHigh, who walked with a more exaggerated distal-to-proximal redistribution than their peers, exhibited larger and more pervasive responses. We believe the joint-level modifications used by RRHigh to increase FP may suggest interesting functional implications for individuals with a higher baseline distal-to-proximal redistribution.
accompany larger FP is at first counterintuitive. However, hip flexor power generation serves to pull the trailing leg into swing through concentric action of hip flexor muscles (e.g., iliacus, psoas, and rectus femoris). Consistent with the premise of Siegel et.al. (2004), excessive hip flexor power generation to initiate leg swing may simultaneously inhibit ankle power generation from directly contributing to FP production during push-off [114]. Lewis and Ferris (2008) observed a similar phenomenon of decreased hip power generation when their young adult subjects tried to walk with an exaggerated ankle strategy [74]. Indeed, attenuating excessive hip flexor power generation may have facilitated older adults getting ‘more bang for their ankle power buck’. Moreover, at least in health young adults, leg swing initiation ordinarily accounts for as much as 10% of the metabolic cost of walking – a value that, due to their reliance on less economically favorable leg muscles for power generation, could be much higher in older adults [115]. Accordingly, we posit that attenuating excessive mechanical power demands at the hip may ultimately have metabolic benefits – a logical next step in this line of research.
Age-related biomechanical plasticity?
mechanical power demands on proximal leg muscles. Interestingly, these changes were only evident in RRHigh subjects (i.e., older subjects we would interpret as using more of a distal-to-proximal redistribution during preferred walking than their peers) and young adults (i.e. subjects we would interpret as having normative patterns of joint power generation). Accordingly, despite relatively invariant ankle power generation during push-off, observed here for older and young subjects, we posit that certain components of age-related biomechanical plasticity may in fact be more elastic than previously appreciated. In this context, older adults may not have permanently yielded to age-related neuromuscular changes. Rather, their greater hip power generation during walking, considered by some maladaptive for its potential impact on walking economy, can, under the appropriate circumstances, return to its original, more youthful, state. Unfortunately, these results do little to address why older adults instinctively opt to walk at their preferred speed with smaller peak FP and greater hip power generation than young adults. Nevertheless, that some older adults retain the capacity to walk with more youthful biomechanical patterns suggests that some may walk with a certain biomechanical elasticity and may be trained to walk with more favorable patterns of joint power generation. Taken together, our results suggest that considering baseline patterns of joint power generation (e.g. distal-to-proximal redistribution) may be an important step toward the more personalized prescription of interventions aimed at enhancing walking performance by improving push-off intensity. Future work will investigate clinically viable surrogates for FP using wearable sensors such as inertial measurement units.
Limitations
our opinion, unfavorable biomechanical changes attributed to elderly gait - deficits in FP and ankle power generation compared to young adults. In addition to providing subjects time to practice walking with visual biofeedback, we analyzed the last 60 s of each walking trial to allow more time for subjects to acclimate to each biofeedback target. However, it is possible that subjects had not grown fully accustomed to each target. Indeed, while outside the scope of this study, learning and adaptation to propulsive biofeedback remains an interesting and important future direction. Our participants walked on the treadmill at their overground PWS, and there may be differences in how individuals respond to walking and/or biofeedback on a treadmill compared to overground. We also excluded the knee in our joint-level kinematic and kinetic analysis. Net positive work performed by muscles spanning the knee is relatively small in walking and, instead, is more prominent in performing negative work during the stance phase of walking [116].
CONCLUSION
CHAPTER 4 PROLOGUE: BIOMECHANICAL EFFECTS OF AUGMENTED ANKLE
POWER OUTPUT DURING HUMAN WALKING3
Introduction
Extensor muscles spanning the ankle (i.e., plantarflexors) are a critical functional component of the
human musculoskeletal system, powering daily activities such as walking. These muscles generate as much
as 50% of the total mechanical power needed for vertical support, forward propulsion, and leg swing
initiation during the terminal stance phase and are presumed critical for modulating step length and walking
speed [20, 87, 117, 118]. Moreover, the biological architecture of the plantarflexor muscles (i.e., short
pennate fascicles and long tendons) is well suited for economical force and power generation during ankle
push-off [106, 119]. Accordingly, the well-documented and disproportionate effects of aging and many gait
pathologies (e.g., stroke) on reducing ankle power output during walking are regularly accompanied by
shorter steps, slower speeds, and reduced walking economy (i.e., rate of oxygen consumption per unit
distance) [11, 13, 61, 93, 104, 120]. However, before we can implicate ankle power output in precipitating
functional changes associated with aging and gait pathology, it is fundamentally important to understand
its precise influence on joint- and limb-level biomechanics during normal walking in healthy young
subjects.
Ankle power generation during the push-off phase of walking decreases by 11-35% in old age and
can decrease by more than 50% in stroke survivors [11, 13, 61, 93, 104, 120, 121]. In addition to the
immediate functional implications, any reduction in ankle power output is also accompanied by increases
in mechanical power demands from muscles spanning more proximal leg joints. Moreover, redistributing
mechanical power demands to the hip could have implications for walking economy [11, 13, 61, 120, 121].
Indeed, compensating for lack of ankle power output by redistributing lower limb mechanical workload to
more proximal muscles has emerged as one potential explanation for reduced walking economy, both in
old age and in people with gait pathology [93, 104, 106]. Some support for this notion comes from Huang
et al. (2015), who restricted ankle joint rotation in young adults and found that for every unit reduction in
trailing limb power generation during push-off, hip and knee power generation during single support
increased by an average of one unit and metabolic power by more than two units [122]. However, the
experimental paradigm used in that study placed the ankle, knee, and hip joints in exaggerated flexion
across the gait cycle and thus not only redistributed workload to more proximal leg muscles, but also
increased the demand for total positive work overall. Thus, the extent to which requirements for mechanical
power generation at the individual joint and limb levels, and in particular compensatory demands at the hip,
are influenced by ankle power output during the push-off phase of walking remains uncertain.
The simplest explanation for reduced ankle power generation due to old age or gait pathology is
that these changes emerge in people after succumbing to functional capacity limitations at the muscle level,
for example via muscle weakness associated with sarcopenia [123]. Accordingly, conventional
interventions including muscle strengthening and power training have garnered significant scientific
attention and been the focus of clinical trials [102]. The results from these studies are not unequivocal, and
muscle strength gains are, by design, almost unanimously reported. However, a relatively recent and
rigorous power training study in older adults, designed to enhance ankle power generation during walking,
conveyed benefits only during maximum speed walking [36]. The cumulative insights from these studies
suggest that improving maximum muscular capacity may fail to alter the instinctive utilization of that
capacity during gait, thereby conveying little functional improvement for normal, habitual speed walking.
Indeed, we and others have revealed evidence that many individuals, even after succumbing to deficits in
walking. The availability of these “propulsive reserves”, now evident in older adults [104] and stroke
survivors [124], challenges our understanding of ankle power output in walking and its role in shaping
walking performance and walking economy. Moreover, rehabilitative approaches that go beyond resistance
training alone may have the potential to more directly elicit favorable biomechanical adaptations during
habitual speed walking.
Real-time biofeedback has a long and successful history as a paradigm to gain fundamental insight
into the biomechanics of locomotion [125] and to facilitate a return to normal locomotor function, for
example in people following stroke [126-128], amputation [129], or total joint replacement [129, 130].
However, knowing the appropriate biomechanical outcome to target in these paradigms is paramount to
their scientific impact and translational success. For example, we have shown that visual biofeedback
targeting propulsive deficits in older adults, through real-time ground reaction force measurements during
treadmill walking, can elicit peak propulsive forces that are equal to or even larger than those of young
adults walking at the same speed [6]. Schenck and Kesar (2018) used a similar biofeedback approach in a
unilateral paradigm designed to enhance push-off intensity in people with post-stroke hemiparesis [78]. We
had presumed that, in human walking, people would respond to propulsive force biofeedback through
increases in ankle moment and thus ankle power generation that mirrored those in propulsive forces.
However, we were more recently surprised to discover that, independent of age, people opt to increase
propulsive forces without augmenting ankle moment or power output. [131]. Those results imply a need to
more fully understand the influence of ankle joint kinetics on the biomechanics in human walking while
also pointing to translational opportunities for real-time biofeedback that more directly targets
improvements in ankle power generation.
Therefore, as an important first step, our purpose was to investigate the effects of real-time peak
ankle power biofeedback on gait kinematics and kinetics during walking in young adults. For this study,
we used targeted visual biofeedback based on real time inverse dynamics to test young adults’ ability to
sought to gain mechanistic insight into the role of ankle power output in modulating patterns of mechanical
power generation across the lower limb joints during walking. We first hypothesized that young adults have
the capacity to volitionally modulate ankle power via biofeedback when walking at their preferred speed.
Second, we hypothesized that increased (decreased) ankle power output during push-off at subjects
preferred speed would decrease (increase) the mechanical workload placed on muscles spanning the hip.
Finally, we hypothesized that ankle power output, accompanied by those offsetting biomechanical changes
at the hip, would alter the distribution of power generation across the leg joints without affecting total
positive joint work.
Methods
Subjects
10 healthy young adults (5 males/5 females, mean ± standard deviation; age: 24.8 ± 5.4 years, mass:
73.2 ± 7.6 kg, height: 1.78 ± 0.09 m) participated in this study. All subjects were free of neurologic
impairments and musculoskeletal injury and walked in their own athletic footwear during the study.
Subjects participated after providing written, informed consent according to the University of North
Carolina Chapel Hill Biomedical Sciences Institutional Review Board.
Visual Biofeedback
This experiment utilized a novel visual biofeedback paradigm based on real-time inverse dynamics
using force measurements from a dual-belt instrumented treadmill (Bertec, Corp., Columbus, OH) and a
14-camera motion capture system (Motion Analysis Corporation, Santa Rosa, CA). Specifically, for trials
involving biofeedback, a custom Matlab (Mathworks, Natick, MA) script continuously estimated the
average bilateral peak ankle power during push-off from each set of four consecutive steps and projected a
visual representation of those values as dots in real-time to a screen positioned in front of the treadmill.
After detecting heel-strike using a 20 N vertical ground reaction force threshold, assuming a massless foot,
moment and angular velocity estimations. While the foot was on the ground, we constructed vector
representations in each frame of the shank (lateral malleoli to the average lateral shank cluster position) and
the foot (lateral malleoli to fifth metatarsal-phalangeal joint). Also in each frame, we estimated a
3-dimensional position vector (𝑟𝑟𝐴𝐴) between the instantaneous lateral malleoli marker position and the center
of pressure location. The script then estimated the instantaneous ankle moment (MART) by taking the cross
product of the 3-dimensional moment arm and the 3 axis GRF vectors per Eqn 1:
[MART,x MART,y MART,z] = [𝑟𝑟𝐴𝐴𝐴𝐴 𝑟𝑟𝐴𝐴𝐴𝐴 𝑟𝑟𝐴𝐴𝐴𝐴] × [𝐹𝐹𝐴𝐴 𝐹𝐹𝐴𝐴 𝐹𝐹𝐴𝐴]
Here, x, y, and z correspond to the mediolateral, anterior-posterior, and vertical directions in the
global coordinate system. Using the same segmental definitions, we estimated the sagittal plane ankle
angular velocity (𝜔𝜔𝐴𝐴𝑅𝑅𝑅𝑅) across the entire stance phase directly from vectors formed from the shank cluster,
lateral malleoli, and fifth metatarsal-phalangeal joint. Finally, we estimated real-time ankle power (PART)
during stance per Eqn 2:
PART = MART,x · 𝜔𝜔𝐴𝐴𝑅𝑅𝑅𝑅
Peak PART was extracted bilaterally from each step, and a 4-step moving average was projected as
a dot on a screen in the front of the treadmill, thereby serving as step-by-step biofeedback. We then
encouraged subjects to match their step-by-step PART to target values displayed as horizontal lines,
prescribed according to the experiment outlined below. For all trials involving visual biofeedback, we
normalized the scaling of each subject’s feedback data on the projected display to evenly distributed all
target values over the ordinate range.
Experimental Protocol
A photo cell timing system assessed subjects’ preferred overground walking speed as the average
of 3 times taken to traverse the middle 2 m of a 10 m walkway (Bower Timing Systems, Draper, UT, USA).
their preferred speed (i.e., 1.27±0.14 m/s). First, subjects walked normally for 90 s while our Matlab
routines monitored their instantaneous ankle power. We immediately used those data to estimate each
subjects’ habitual PART for use in subsequent visual biofeedback trials. Prior to biofeedback trials, each
subject completed a 3 minute exploration period without targets to accommodate to and practice using PART
biofeedback. We also explained the concept of ankle power to each subject, including its timing and brief
descriptions of ankle moment and angular velocity. Then, during 90 s trials, subjects modified their
instantaneous ankle power to match target values representing ±10% and ±20% of habitual in fully
randomized order.
Measurement and Analysis
A 14-camera motion capture system (Motion Analysis Corporation, Santa Rosa, CA) operating at
100 Hz recorded pelvis and lower extremity kinematics via 17 anatomical markers and an additional 14
tracking markers affixed using rigid clusters. Analog ground reaction force data were recorded at 1000 Hz.
A standing calibration trial also included medial knee and ankle joint anatomical markers.
Marker trajectories and GRF data were filtered using 4th order low-pass Butterworth filters with
cutoff frequencies of 6 Hz and 100 Hz, respectively. We then used the static standing calibration and
functional hip joint centers from a leg circumduction task (Piazza et al., 2001) to scale a seven segment, 18
degree-of-freedom model of the pelvis and right and left legs (Arnold et al., 2010). We used the filtered
marker and GRF data to estimate hip, knee, and ankle joint angles, moments, and powers (e.g., ankle power:
𝑃𝑃𝐴𝐴) using an inverse dynamics routine described in detail previously [12]. Also at the joint level, positive
hip, knee, and ankle joint work were calculated as the positive area under the respective joint power curve.
In addition, to gain insight into how individual joint mechanics propagated to altered center of mass (CoM)
mechanics, we used the individual limbs method [82] and measured GRF data to estimate positive and
negative mechanical work performed on the CoM by the leading and trailing legs during double support
changes in power absorption at other joints [116], motivating our inclusion of this limb-level analysis.
Specifically, we derived the CoM power curves as the dot product of CoM velocity and the sum of the
individual limbs GRF using previously published procedures [82] and integrated those curves with respect
to time. For each subject, we selected for analysis the 20 consecutive strides from each 90 s trial averaging
nearest to each associated target value (i.e. ±10% and ±20%).
Statistical Analysis
Shapiro-Wilks tests confirmed normal distributions for each outcome measure (i.e., PART, 𝑃𝑃𝐴𝐴, hip,
knee, and ankle joint angles, moments, and powers, CoM work). We used paired t-tests to assess differences
between PART and 𝑃𝑃𝐴𝐴. Those tests also assessed the symmetry of subjects’ response to biofeedback by
comparing the change in peak ankle power from normal walking to each biofeedback target between their
right and left legs. We then tested for main effects of 𝑃𝑃𝐴𝐴𝑅𝑅𝑅𝑅biofeedback on all outcome measures using
one-way repeated measures analyses of variance (ANOVA) and an alpha level of 0.05. When a significant main
effect was found, planned post hoc pairwise comparisons were focused between normal walking and
walking with the four modulated ankle power targets. To provide context, we report effect sizes for all
ANOVA results (i.e., partial eta squared [𝜂𝜂𝑃𝑃2]).
Results
Ankle power and biofeedback efficacy
Our real-time surrogate for peak ankle power systematically overestimated full inverse dynamics
estimates by only 5% across all conditions (p<0.001) (Fig. 13). Nevertheless, a significant main effect
revealed that subjects successfully modulated peak ankle power (PART and 𝑃𝑃𝐴𝐴) in response to biofeedback
as intended (p<0.001, 𝜂𝜂𝑃𝑃2>0.810), a response that did not differ between their right and left legs (p≥0.0127).
(p=0.003) in response to +10% and +20% targets, respectively, and decreased 𝑃𝑃𝐴𝐴 by 13±12% (p=0.001)
and 28±16% (p<0.001) in response to -10% and -20% targets, respectively.
Ankle and hip joint kinetics and kinematics
Increasing (decreasing) peak ankle power during push-off decreased (increased) peak hip joint
power output on the ipsilateral limb during terminal stance and early swing (main effect, p=0.038,
𝜂𝜂𝑃𝑃2=0.240) and on the contralateral limb during early to midstance (main effect, p<0.001, 𝜂𝜂𝑃𝑃2=0.450) (Fig.
14). For example, on the ipsilateral limb, a target 20% increase in peak ankle power decreased peak hip
flexor power generation from 1.54±0.42 W/kg to 1.16±0.52 W/kg (i.e., -25%, p=0.032). Simultaneously,
this same condition also tended to decrease contralateral limb hip extensor power generation from
0.91±0.40 W/kg to 0.66±0.30 W/kg (i.e., -28%, p=0.072). We also found a main effect of modulating peak
ankle power on peak ankle moment (p<0.001, 𝜂𝜂𝑃𝑃2=0.521), though pairwise comparisons revealed that this
was driven only by targeting reductions in ankle power (p≤0.010; Fig. 14). Indeed, target increases in peak
ankle power were more associated with increased peak ankle angular velocity (main effect, p<0.001,
𝜂𝜂𝑃𝑃2=0.659), for example increasing from 368±88 º/s to 441±81 º/s for +10% target values (p=0.003).
Increasing peak ankle power also significantly increased peak ankle extension, while decreasing ankle
power significantly decreased both peak ankle and peak hip extension (main effects; ankle: p<0.001,
𝜂𝜂𝑃𝑃2=0.772; hip: p=0.045, 𝜂𝜂𝑃𝑃2=0.231) (Fig. 14). Lastly, we found a main effect of condition on step length,
with changes mirroring those in ankle power output across the range of target values (p=0.012, 𝜂𝜂𝑃𝑃2=0.294).
Joint work, center of mass work, and propulsive forces
Modulating peak ankle power output altered the distribution of positive mechanical work
performed about the individual leg joints and also systematically affected total (hip+knee+ankle) positive
joint work (Fig. 15A). First, compared to normal walking, a target 20% increase (decrease) in peak ankle