ACCEPTED VERSION
LA Crocombe, DS Brennan and GD Slade
Does lower lifetime fluoridation exposure explain why people outside capital cities
have poor clinical oral health?
Australian Dental Journal, 2016; 61(1):93-101
© 2015 Australian Dental Association
This is the peer reviewed version of the following article: LA Crocombe, DS Brennan and GD Slade
Does lower lifetime fluoridation exposure explain why people outside capital cities have poor clinical oral health?
Australian Dental Journal, 2016; 61(1):93-101 which has been published in final form at http://dx.doi.org/10.1111/adj.12315
This article may be used for non-commercial purposes in accordance with Wiley Terms and Conditions for Self-Archiving."
http://hdl.handle.net/2440/95720
PERMISSIONS
http://olabout.wiley.com/WileyCDA/Section/id-828039.html
Publishing in a subscription based journal Accepted (peer-reviewed) Version
The accepted version of an article is the version that incorporates all amendments made during the peer review process, but prior to the final published version (the Version of Record, which includes; copy and stylistic edits, online and print formatting, citation and other linking, deposit in abstracting and indexing services, and the addition of bibliographic and other material.
Self-archiving of the accepted version is subject to an embargo period of 12-24 months. The embargo period is 12 months for scientific, technical, and medical (STM) journals and 24 months for social science and humanities (SSH) journals following publication of the final article.
• the author's personal website
• the author's company/institutional repository or archive
• not for profit subject-based repositories such as PubMed Central
Articles may be deposited into repositories on acceptance, but access to the article is subject to the embargo period.
The version posted must include the following notice on the first page:
"This is the peer reviewed version of the following article: [FULL CITE], which has been published in final form at [Link to final article using the DOI]. This article may be used for non-commercial purposes in accordance with Wiley Terms and Conditions for Self-Archiving."
The version posted may not be updated or replaced with the final published version (the Version of Record). Authors may transmit, print and share copies of the accepted version with colleagues, provided that there is no systematic distribution, e.g. a posting on a listserve, network or automated delivery. There is no obligation upon authors to remove preprints posted to not for profit preprint servers prior to submission.
Accepted
Article
This article has been accepted for publication and undergone full peer review but has not been through the copyediting, typesetting, pagination and proofreading process, which may lead to differences between this version and the Version of Record. Please cite this article as Article Type: Original Article
Does lower lifetime fluoridation exposure explain why people outside
capital cities have poor clinical oral health?
Crocombe, LA1, 2*
Brennan, DS1
Slade GD3
1. Australian Research Centre for Population Oral Health, School of Dentistry,
The University of Adelaide, Adelaide, Australia
2. Centre for Rural Health, School of Health Sciences, The University of Tasmania, Hobart,
Tasmania, Australia
3. Department of Dental Ecology, UNC School of Dentistry, The University of North
Carolina, Chapel Hill, North Carolina, United States of America
* Corresponding author, [email protected]
Running title: Fluoridation exposure and rural clinical oral health
ABSTRACT
Background: Australians outside state capital cities have greater caries experience than their
counterparts in capital cities. We hypothesized that differing water fluoridation exposures
Accepted
Article
Methods: Data were the 2004-06 Australian National Survey of Adult Oral Health.
Examiners measured participant decayed, missing and filled teeth and DMFT Index and
lifetime fluoridation exposure was quantified. Multivariable linear regression models
estimated differences in caries experience between capital city residents and others, with and
without adjustment for fluoridation exposure.
Results: There was greater mean lifetime fluoridation exposure in state capital cities (59.1%,
95% confidence interval=56.9,61.4) than outside capital cities (42.3, confidence
interval=36.9,47.6). People located outside capital city areas had differing socio-demographic
characteristics and dental visiting patterns, and a higher mean DMFT (Capital cities=12.9,
Non-capital cities=14.3, p=0.02), than people from capital cities. After adjustment for
socio-demographic characteristics and dental visits, DMFT of people living in capital cities was
less than non-capital city residents (Regression coefficient=0.8, p=0.01). The disparity was
no longer statistically significant (Regression coefficient=0.6, p=0.09) after additional
adjustment for fluoridation exposure.
INTRODUCTION
Adults living outside Australian state capital cities have poorer oral health than their
counterparts living in capital cities1. Non–capital-city residents are more likely to suffer
complete tooth loss, to have an inadequate dentition (fewer than 21 teeth), and to wear
dentures than capital-city residents, and they have more teeth affected by caries2. Avoiding
difficult-to-eat foods is more common in people who reside outside capital cities than in
Accepted
Article
Proposed reasons for geographic variation in caries experience include lower socio-economic
status of rural Australians4, less availability of dental care outside of major cities5, and
provision of fewer preventive services and more dentures in rural areas6, 7. However, analysis
of the 2004-06 Australian National Survey of Adult Oral Health8 found that dental caries
experience and the number of decayed and missing teeth were greater in non-capital city than
capital city areas and that this was maintained after controlling for sociodemographic
characteristics, preventive dental behaviours, and access to dental care. This indicates that
there must be another factor, or factors, which explain why people residing outside capital
cities have poorer clinical oral health than people living within capital city areas.
Slade et al.9 found that the caries-preventive effects of water fluoridation were at least as
great in adults born before the widespread implementation of fluoridation as after widespread
implementation of fluoridation. More recently, Crocombe et al.10 found that higher lifetime
fluoridation exposure was associated with lower dental caries experience in younger adults in
rural areas of Australia, largely reflected in a lower number of filled teeth.
Knowing whether differing levels of water fluoridation has a major association with capital
and non-capital-city clinical oral health would give policy makers, administrators and dental
practitioners further insight into oral health inequality. This study was designed to determine
whether the greater dental caries experience of adults living outside Australian capital cities
compared to adults in the capital cities was associated with lower exposure to fluoridated
Accepted
Article
MATERIALS & METHODS
Data from the National Survey of Adult Oral Health 2004–0611 (NSAOH) were used to
compare the clinical oral health of Australian capital city and non–capital city residents.
NSAOH used a clustered stratified random sampling design to select a representative sample
of persons aged 15 years or more. Survey participants were interviewed by telephone and
those who had one or more natural teeth were asked to attend a nearby dental clinic where
standardised oral epidemiological examinations were conducted by one of 30 dentist–
examiners trained in the survey methods. At the completion of the clinical examination,
participants were given a pamphlet explaining that a questionnaire would be mailed to their
homes. The 16-page questionnaire asked, among other things, about oral health behaviour.
The Survey was reviewed and approved by The University of Adelaide’s Human Research
Ethics Committee. Full details of sampling, examination protocol and survey participation
have been described in previous reports12.
Australian postcodes were used to create two groups based on the Australian Bureau of
Statistics postcode geographic classification: state capital city (‘metropolitan’ stratum) and
remainder of state (‘ex–metropolitan’ stratum). The Australian Capital Territory was defined
as a single metropolitan stratum. In the Northern Territory, ex–metropolitan postcodes were
limited to the regional centres of Alice Springs, Katherine, Tennant Creek and Nhulunbuy.
The number of decayed, missing and filled permanent teeth (DMFT Index) was used to
reflect a person’s lifetime experience of dental caries. The number of decayed permanent
teeth reflected the burden of untreated disease and the number of missing and filled
Accepted
Article
Putative confounders were selected on the basis of having been shown in previous studies to
be associated with clinical oral health: age13, sex14, country of birth13, socioeconomic status15,
16
, brushing with fluoride toothpaste17, using sugar-free gum18, smoking19, diabetes20, and
access to dental care21. Although the current evidence is unable to answer the question of
whether regular interdental cleaning provides a benefit above and beyond brushing with
fluoride toothpaste22, inter dental cleaning was included as a putative confounder because it is
recommended by dental professionals to maintain good oral health23.
Age was split into seven groups of 15-<25, 25-<35, 35-<45, 45-<55, 55-<65, 65-<75 and 75+
years. A continuous age variable was not selected because the association of DMFT with age
displayed a different pattern for those aged 45 years and older. Seven age groups, rather than
a lower number of age groups, were selected to decrease the possibility of residual
confounding. Country of birth was dichotomised into Australia or overseas.
Socioeconomic status was measured by education and level of income. The highest level of
education was trichotomised into Degree/Teacher/Nursing, Trade/Diploma/Certificate, and
no Post-Secondary school education. Total household income was divided into low: less than
$30,000, high: equal to or over $60,000, and middle: between these amounts.
Oral hygiene behaviours were the number of times brushed (Twice+/day, less than twice per
day), used mouthrinse last week (Yes/no), used sugar-free gum last week (Yes/no) and
regular interdental cleaning (At least daily, less than daily, not regularly). The tooth brushing
Accepted
Article
Two periodontal risk factors were included in the analysis because they may explain
differences in numbers of missing teeth. These were the presence of diabetes (Yes/no) and
smoking (Current/past/never smoked).
In Australia, socio-economically disadvantaged adults are eligible for public funded dental
care, but the rationing of resources has led to disadvantaged adults being more likely to
receive treatment for acute dental problems21 than preventive/routine care. The number of
locally-based dentists per head of population was included as an access to dental care variable
because even though people may have the financial means and the incentive to access regular
and preventive dental care, they may not be able to access dental care if there are not enough
local dentists to provide that care. Difficulty paying a $100 dental bill or avoiding or delaying
dental treatment because of cost is a barrier to receipt of dental care25.
Access to dental care was measured using questions that assessed whether the participants
were eligible for public dental care, the number of full-time equivalent (FTE) locally-based
dentists (50+ per 100,00 people/under 50), whether they had a lot of difficulty in paying a
$100 dental bill, the average time between dental visits (12 months or less, over 12 months),
the usual reason for dental visits (Check-up/problem), and whether they had avoided or
delayed dental treatment because of cost.
The lifetime fluoridation exposure was calculated using a fluoridation database maintained by
the Australian Research Centre for Population Oral Health that recorded fluoride
concentration of public water supplies, classified geographically by postcode26. It registered
Accepted
Article
locations to water supplies in every year, coding fluoride concentrations as: (a) < 0.3 ppm F =
0; (b) 0.3 - < 0.7 ppm F = 0.5; and (c) ≥ 0.7 ppm F = 1.0 and assumed 0.5 ppm F for localities
in New Zealand, Canada, or the United States and 0 ppm F for other foreign localities. The
number of years at each concentration was multiplied by the concentration. The products
were summed and divided by the person’s age to yield the person’s proportion of lifetime
exposed to the equivalent of 1 ppm F in drinking water.
Data were weighted by age, sex and regional location to generate all statistics, thereby
producing population estimates for the target population of dentate Australians aged 15 years
or more. Categorical variables were summarised as percentages, while ordinal and continuous
variables were summarised as means. A two-step analysis was undertaken: comparing the
dependent variables by regional location, socio-demographic variables, preventive dental
behaviours and access to dental care, and then including the lifetime fluoridation exposure
variable. In each step, bivariate analysis was undertaken to identify and describe associations
between the outcome variables and main explanatory variables and to find potential
confounders. Variables that were statistically associated with both the explanatory (regional
location) and at least one of the outcome variables were considered to be confounders. A
multivariable analysis using linear regression analysis was then undertaken with the dental
caries clinical measures as dependent variables. The regression coefficients generated from
the regression models indicated the change in dental caries experience related to each
explanatory variable. For continuous explanatory variables the regression coefficient
indicated the expected change in dental caries experience for a one-unit change in the
explanatory variable, such as percentage of exposure to water fluoridation. For indicator
Accepted
Article
relative to the reference category. Positive or negative regression coefficients indicate
whether the expected change is higher or lower. SUDAAN (Research Triangle Institute,
Research Triangle Park, NC) was used to adjust for complex analytical design, to weight for
sampling probability and non-response.
RESULTS
Of the 14,123 persons interviewed, 5,505 (43.7%) were examined and 4,170 completed the
questionnaire. Of those, lifetime fluoridation exposure was calculated for 3,770 people (Table
1). More people resided in capital city areas (2,514, 66.7%) than outside capital city areas
(1,256, 33.3%). . Approximately half of the sample (52.8%) was less than 45 years of age,
female (51.5%), or earned less than $60,000, while 36.5% had no secondary education and
approximately one-fifth (20.5%) were born outside Australia. Over half (58.2%) the
participants brushed their teeth more than twice a day, and over half (57.2%) had used a
mouth rinse in the previous week. Most participants (28.0%) had not used gum in the
previous week and only one fifth (20.5%) cleaned interdentally on a daily basis. Four percent
of the respondents were diabetics and over half (58.0%) had never smoked. Over a quarter
(27.1%) were eligible for public dental care, less than half (45.6%) had more than 50
full-time equivalent dentists per 100,000 population in their local area, 15.4% reported having a
lot of trouble paying a $100 dental bill, over half (55.0%) had an average time of 12 months
or less between dental visits, and over half (59.8%) usually visited a dentist for a check-up
rather than a problem. Close to one-third (31.6%) of respondents reported avoiding or
delaying dental treatment due to cost. The mean DMFT was 13.4, mean number of decayed
teeth was 0.5, mean number of missing teeth was 4.5, and the mean number of filled teeth
Accepted
Article
Part 1 analysis: Socio-demographic variables, preventive dental behaviours, periodontal
disease risk factors, and access to dental care variables.
People located outside state capital city areas had lower household incomes, were lesser
qualified, were less likely to have been born outside Australia, less likely to brush twice or
more per day, more likely to be eligible for public dental care, had a lower number of local
dentists, visited a dentist less regularly, and were more likely to attend a dentist for a problem
rather than a check-up, than people from capital cities (Table 1). People located outside state
capital city areas had a higher caries experience (DMFT), and more decayed and missing
teeth, but not more filled teeth, than people located within capital city areas.
Other than country of birth, all the putative confounders were significantly associated with at least
one of the dental caries indicators (Table 2). Other than with the mean number of decayed teeth,
the dental caries indicators were strongly associated with age. People on higher incomes had a lower
mean DMFT Index, reflected in a lower mean number of decayed and missing teeth, than people on
lower incomes. Males had more decayed, but fewer filled teeth, than females. People with a trade,
diploma or certificate had a higher mean number of decayed, missing or filled teeth than people
with degrees or without a post-secondary qualification. People who brushed twice or more a day
had a higher DMFT Index, a lower mean number of decayed teeth and a higher mean number of
filled teeth. Mouth rinsing in the previous week was associated with a lower DMFT Index and a lower
mean number of filled teeth. Chewing of gum was significantly associated with dental caries
experience. Regular interdental cleaning was associated with a higher DMFT Index and mean
number of missing and filled teeth. Diabetics had a higher DMFT and a higher mean number of
Accepted
Article
number of decayed and missing teeth, than past or current smokers. Eligibility for public dental care
was associated with poorer dental caries experience, other than with the mean number of filled
teeth. A higher number of local dentists was associated with more dental caries and missing teeth.
Having a lot of difficulty paying a $100 dental bill was associated with a higher DMFT Index and
mean number of decayed teeth, but a lower mean number of filled teeth. People who visited the
dentist more regularly had a higher DMFT Index with a lower mean number of decayed teeth, but a
higher mean number of filled teeth. Usually visiting a dentist for a check-up was associated with
better results in all the dental caries indicators than usually attending a dentist for a problem. People
who avoided or delayed dental treatment due to cost had a higher mean number of decayed, but
lower mean number of missing teeth than those who did not avoid or delay dental treatment due to
cost. Household income, highest qualification, country of birth, times brushed per day in the
last week, eligibility for public dental care, number of full-time equivalent local dentists,
average time between dental visits, and usual reason for dental visiting were significantly
associated with both regional location and at least one of the outcome variables of DMFT,
decayed, missing or filled teeth. Though age was not significantly associated with regional
location, it was decided to include age in the multivariable analysis because DMFT was
strongly associated with age. Although the number of filled teeth was not significantly
associated with regional location it was included in the multivariable analysis for
completeness.
Following adjustments incurred through the multivariable modelling that included
socio-demographic parameters, a preventive dental behaviour, and access to dental care in the
regression model, people who lived outside state capital city areas still had a higher DMFT
Index, largely reflected in a higher mean number of missing teeth than people living in capital
Accepted
Article
exception in the decayed teeth model. Higher income was associated with the mean number
of missing teeth, and the highest income level had a lower mean DMFT Index. The level of
qualification was also associated with the dental caries experience. More frequent
toothbrushing was associated with fewer decayed teeth. More local dentists was associated
with fewer decayed teeth and the usual reason for visiting was associated with lower mean
DMFT, mean number of decayed and missing teeth.
Part 2 analysis: Lifetime fluoridation exposure
In bivariate analysis, there was a significantly greater mean lifetime fluoridation exposure in
state capital city (59.1%, 95% confidence interval=56.9,61.4) than outside capital city areas
(42.3%, 36.9,47.6). The mean percentage lifetime fluoridation exposure was significantly
associated with age: (15-<25: 68.6%, 25-<35: 68.8%, 35-<45: 56.8%, 45-<55: 47.7%,
55-<65: 41.1%, 65-<75: 36.2%, 75+ years: 30.5%, p<0.01)
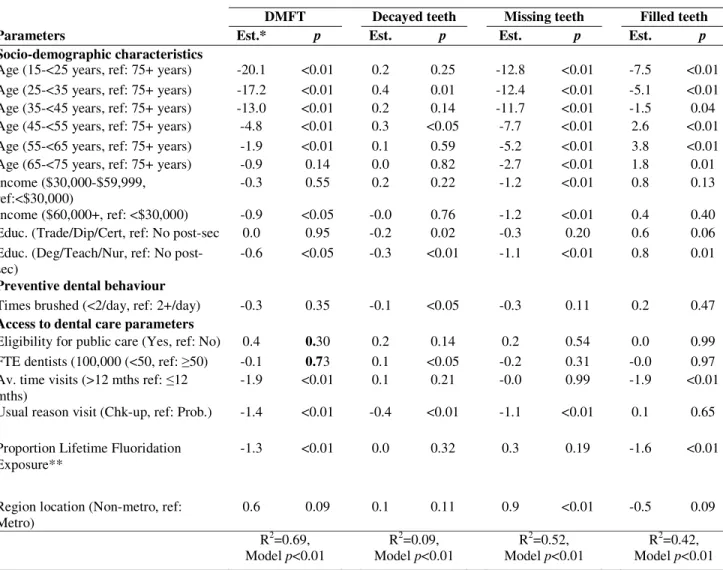
Following further multivariable modelling inclusive of lifetime fluoridation exposure, there
was no longer a significant difference in the DMFT Index between the two regions, though
there continued to be a significant difference in the mean number of missing teeth (Table 4).
The DMFT estimate of -20.1 given in row 1 in the DMFT column indicated the negative
change in dental caries experience in people aged 15-<25 years compared to the reference
group, i.e. people aged 75+ years and the p<0.05 indicated the relationship was statistically
significant. The DMFT estimate of -1.3 given in Proportion Lifetime Fluoridation Exposure
row indicated the change in dental caries experience for a one-unit change in the percentage
Accepted
Article
the regression models, nor were there any changes in statistical significance of any other
variable between the two regression models.
DISCUSSION
The major finding was that with lifetime fluoridation exposure included in the regression
model, there was no longer a significant difference in dental caries experience between
people residing inside and outside Australian state capital cities. This study indicates that
increasing lifetime fluoridation exposure for people living outside Australian capital cities
would play a large role in removing the clinical oral health gap between people inside and
outside capital cities. Fluoridation of drinking water remains the most effective and socially
equitable means of achieving community-wide exposure to the caries prevention effects of
fluoride27. Developed countries such as Australia should do more to provide access to
fluoridated to water to all communities, including rural communities.
People living in non-metropolitan areas had a higher mean DMFT Index, largely reflected in
a higher mean number of missing teeth than people living in metropolitan areas. People in
rural areas commonly describe health as an absence of disease28, and their money is spent on
disease management rather than on primary care and health promotion29. This may explain
why the difference in the mean number of missing teeth between capital and non-capital city
areas persisted after controlling for socio-demographic parameters, preventive dental
Accepted
Article
The limitations of the study should be noted. The use of a dichotomisation to define regional
location may not be sensitive enough to capture differing levels of rural and remoteness. This
study excluded people without a land-based phone from the study, and that will exclude some
people from the study, for example, Aboriginals and Torres Strait islanders. Another criticism
could be made of the dichotomising the number of dentists per 100,000 population at close to
the mean number of fifty. However, the models were re-run using the number of dentists per
100,000 population as a continuous variable and it did not significantly affect the results.
Missing teeth pose a threat to internal validity through misclassification of caries experience.
However, dental caries is the main cause of tooth extraction in all ages30 and periodontal
disease did not vary between capital and non-capital city areas2. This study also found no
significant variation between the regions for the periodontal risk factors for missing teeth of
diabetes and smoking. A further criticism could be that the assumption of 0.5 ppm lifetime
fluoridation exposure for the time people were outside of Australia may have resulted in a
degree of misclassification. As a sensitivity analysis, the regression analysis was redone with
only the Australian-born participants. The regression based on Australian-born participants
indicated that there was not a significant difference in dental caries experience between
capital city and non-capital city residents when lifetime fluoridation experience was in the
regression (DMFT Est=0.36, p=0.36) or not (DMFT Est=0.74, p=0.06). However, the
regression co-efficient was lower when lifetime fluoridation experience was in the regression
indicating that lifetime fluoridation experience was a factor in the differing lifetime dental
caries exposure between adults living inside and outside Australian capital city areas. The
Accepted
Article
An important consideration is whether the association is causal. As noted by Slade et al.9,
cross-sectional designs cannot establish a temporal ordering between exposure and disease
and therefore cannot contribute to causal interpretation. However, cross-sectional studies are
informative about temporality under two conditions: a) when studies compare lifetime
exposure versus lifetime non-exposure; and b) when disease is quantified as lifetime,
cumulative incidence. This study satisfies both these conditions, suggesting a causal
relationship.
A major strength of this study was that NSAOH is only the second nationwide oral health
survey held in Australia, had a large sample size, and the degree of non-participation bias was
small12. The R2 figures for DMFT (0.69), missing teeth (0.52) and filled teeth (0.41) models
were higher than usually found in dental studies indicating that the data was close to the fitted
regression line and the model explains much of the variability of the response data around its
mean.
The results were consistent with previous research. That people from non–capital-city areas
were more likely to have lower household incomes, lower educational qualification has been
found by others31, as has the relationship of age and country of birth13, sex14, socioeconomic
status15, 16 with the dental caries experience.
Further research needs to be undertaken to see whether the results change with differing
levels of rural and remoteness. Future qualitative research should also be undertaken to assess
Accepted
Article
CONCLUSIONS
Dental caries experience and the number of decayed and missing teeth was greater in
non-capital city than in state non-capital city areas. This was maintained for DMFT and number of
missing teeth, but not for decayed teeth, after controlling for sociodemographic
characteristics, a preventive dental behaviour, access to dental care, but not maintained for
DMFT when also controlling for lifetime fluoridation exposure. Policies aimed at extending
water fluoridation in rural areas. could play a role in removing the clinical oral health gap
between people inside and outside Australian state capital cities.
REFERENCES
1. Australian Institute of Health and Welfare (2009). Geographic variation in oral health and use of dental services in the Australian population 2004–06. AIHW Dental Statistics and Research Unit Research Report No. 41. AIHW Cat. no. DEN 188. Adelaide: AIHW, 2009.
2. Thomson K, Do L (2007). Oral health status. In: Slade GD, Spencer AJ, Roberts-Thomson KF, eds. Australia’s dental generations. The National Survey of Adult Oral Health 2004–06. Canberra, Australia's Institute of Health and Welfare, 2007; Ch5:81-142.
3. Slade GD, Sanders AE. Trends in oral health1987-2006. In: Slade GD, Spencer AJ,
Roberts-Thomson KF, eds. Australia’s dental generations. The National Survey of Adult Oral Health 2004–06. Canberra, Australian Institute for Health and Welfare, 2007;Ch8:196-235.
4. Australian Bureau of Statistics (2013). 6523.0 - Household Income and Income Distribution, Australia, 2011-12, 2013.
http://www.abs.gov.au/ausstats/[email protected]/Latestproducts/6523.0Main%20Features22011-12?opendocument&tabname=Summary&prodno=6523.0&issue=2011-12&num=&view=. Accessed 8 February, 2014.
5. Teusner DN, Chrisopolous S, Brennan DS (2007). Geographic distribution of the Australian dental labour force 2003. Canberra: Australian Institute of Health and Welfare, 2007.
6. Brennan DS, Spencer AJ, Slade GD (1996). Provision of public dental services in urban, rural and remote locations. Community Dent Health, 1996, 13:157-62.
Accepted
Article
capital city and non-capital locations in Australian private general practice. Aust J Rural Health 1998, 6:12-7.
8. Crocombe LA, Stewart JF, Brennan DS, Slade GD, Spencer AJ (2012). Is poor access to dental care why people outside capital cities have poor oral health? Australian Dental Journal 2012; 57: 1–9.
9. Slade GD, Sanders AE, Do L, Roberts-Thomson KF, Spencer AJ (2013). Effects of Fluoridated Drinking Water on Dental Caries in Australian Adults. Journal of Dental Research. http://jdr.sagepub.com/content/early/2013/03/01/0022034513481190
10. Crocombe LA, Brennan DS, Slade GD, Stewart JF, Spencer AJ (2014). The effect of lifetime fluoridation exposure on dental caries experience of younger rural adults. Australian Dental Journal. December 2014, DOI: 10.1111/adj.12243.
11. Slade, GD, Spencer AJ, Roberts-Thomson KD (2007). Australia's dental generations: the National Survey of Adult Oral Health 2004-06. Canberra, Australian Institute of Health and Welfare, 2007.
12. Mejia GC, Slade GD, Spencer AJ. Participation in the survey (2007). In: Slade GD, Spencer AJ, Roberts-Thomson KF, eds. Australia’s dental generations. The National Survey of Adult Oral Health 2004–06. Canberra: Australian Institute of Health and Welfare,
2007;Ch3:37–53.
13. Steele J, Sanders A, Slade GD, Allen PF, Lahti N, Nuttall N (2004). How do age and tooth loss affect oral health impacts and quality of life? A study comparing two national samples. Community Dentistry and Oral Epidemiology 2004;32:107-114.
14. Inglehart M, Silverton S, Sinkford JC (2002). Oral Health-Related Quality of Life: Does Gender Matter? Oral Health-Related Quality of Life. Inglehart and B. RA. Carol Stream, Ill, Quintessence Publishing Co In. 2002.
15. Sanders AE, Spencer AJ (2004). Social inequality in the perceived oral health among adults in Australia. Australian and New Zealand Journal of Public Health 2004;28(2):151-8.
16. Sanders AE, Slade GD, Turrell G, Spencer AJ, Marcenes W (2006). The shape of the socioeconomic-oral health gradient: implications for theoretical explanations. Community Dent Oral Epidemiol; 2006, 34(4):310-19.
17. Davies RM, Davies GM, Ellwood RP. Prevention (2003). Part 4: Toothbrushing: What advice should be given to patients? British Dental Journal 2003;195:135-141.
18. Deshpande A, Jadad A. The impact of polyol-containing chewing gums on dental caries – a systematic review of original randomized controlled trials and observational studies.
Journal of the American Dental Association, 2008;139(12):1602-1614.
Accepted
Article
20. Löe, H (1993). Periodontal disease. The sixth complication of diabetes mellitus. Diabetes Care 1993;16:329-334.
21. Roberts-Thomson K, Brennan DS, Spencer AJ (1995). Social inequality in the use and comprehensiveness of dental services. Australian Journal of Public Health 1995;19(1): 80-5.
22. Hujoel PP, Cunha-Cruz J, Banting DW, Loesche WJ (2006). Dental flossing and
interproximal caries: A systematic review. Journal of Dental Research 2006; 85(4): 298-305.
23. Australian Dental Association (2014). FAQs. Australian Dental Association. www.ada.org.au. Accessed 11 September November 2014.
24. Attin T, Hornecker E (2005). Tooth brushing and oral health: how frequently and when should tooth brushing be done. Oral Health and Preventive Dentistry 2005;3(3):135-140.
25. Spencer AJ, Harford J (2007). Dental care. In: Slade GD, Spencer AJ, Roberts-Thomson KF, eds. Australia’s dental generations. The National Survey of Adult Oral Health 2004–06. Canberra, Australia's Institute of Health and Welfare, 2007;Ch6:143-172.
26. Mahoney G, Slade GD, Kitchener S (2008), Barnett A. Lifetime fluoridation exposure and dental caries experience in a military population. Community Dent Oral Epidemiol 2008; 36:485-492..
27. National Health and Medical Research Council (2007). NHMRC Public Statement: the Efficacy and Safety of Fluoridation. Canberra: National Health and Medical Research Council; 2007.
28. Humphreys J, Jones M, Jones JA, Mara PR (2002). Workforce retention in rural and remote Australia: determining the factors that influence length of practice. Medical Journal of Australia;176:472-476.
29. Coster G, Gribben B (1999). Primary care models for delivering population-based health outcome. Wellington, New Zealand: National Health Committee, 1999.
30. Burt BA, Eklund SA (2005). Dentistry, dental practice, and the community. 6th ed. St. Louis, Mo.: Elsevier Saunders. 2005.
Accepted
Article
TABLES
Table 1: Relationship between socio-demographic characteristics, preventive dental behaviours, periodontal disease risk factors, access to dental care and regional location
Descriptive analysis Bivariate analysis
Total sample
n=3,770
Capital city n=2,514
Non-Capital city n=1,256
Parameters Col % 95%CI Col % Col % p
Socio-demographic characteristics
Age 15-<25 years 15.1 12.6,17.6 15.5 14.3 0.36
25-<35 years 17.1 14.6,19.5 18.2 14.8
35-<45 years 20.6 18.8,22.4 20.1 21.6
45-<55 years 19.5 17.7,21.3 19.0 20.5
55-<65 years 14.5 13.1,15.8 13.9 15.6
65-<75 years 7.6 6.7,8.5 7.3 8.2
75+ years 5.6 4.6,6.7 6.0 4.9
Sex Female 51.5 49.0,54.0 52.4 49.6 0.31
Male 48.5 45.9,51.0 47.6 50.3
Household <$30,000 23.1 21.1,25.0 20.0 29.3 <0.01
Income $30-<$60,000 30.5 28.2,32.9 29.3 33.1
$60,000+ 46.4 43.5,49.3 50.6 37.7
Highest Deg/Teach/Nurs 35.2 32.5,37.9 40.5 24.4
Qualification Trade/Dip./Cert. 28.2 25.8,30.7 26.3 32.2 <0.01
No Post Sec. Ed. 36.5 33.8,39.2 33.2 43.4
Country of Australia 79.5 77.5,81.5 76.1 86.4 <0.01
birth Not Australia 20.5 18.5,22.5 23.9 13.6
Preventive dental behaviours (%)
Times brushed Twice + per day 58.2 55.8,60.7 59.2 56.3 0.02
last week <2 per day 41.8 39.3,44.2 40.8 43.7
Used rinse in Did rinse 57.2 54.8,59.6 58.1 55.3 0.39
last week Did not rinse 42.8 40.4,45.2 41.9 44.7
Used gum last Did 28.0 25.7,30.3 29.0 25.9 0.87
week Did not 72.0 69.7,74.3 71.0 74.1
Regular At least daily 20.5 18.6,22.5 21.1 19.3 0.21
interdental Less than daily 39.4 37.0,41.8 41.9 38.2
cleaning Not regularly 40.0 37.5,42.6 38.8 42.4
Periodontal disease risk factors (%)
Diabetes Yes 4.0 3.1,4.9 3.6 4.8 0.21
No 96.0 95.1,96.9 96.4 95.2
Smoking Current Smoker 13.9 12.2,15.6 13.2 15.1 0.30
Past Smoker 28.1 26.6,30.8 28.0 28.4
Never Smoked 58.0 55.7,60.3 58.8 56.5
Access to dental care (%)
Eligibility for Eligible 27.1 24.9,29.2 25.1 30.9 0.02
public care Not eligible 72.9 70.1,75.0 74.9 69.1
FTE dentists 50+/100,000 45.6 43.1,48.2 66.6 3.6 <0.01
per head >50/100,000 54.4 51.8,56.9 33.4 96.4
Diff. pay $100 A lot 15.4 13.7,17.0 14.7 16.7 0.94
dental bill None - a little 84.6 83.0,86.3 85.3 83.2
Av. time 12 mth or less 55.0 52.4,57.7 58.5 48.2 <0.01
between visit > 12 months 45.0 42.3,47.6 41.5 51.8
Usual reason Check-up 59.8 57.2,62.4 64.1 51.3 <0.01
dental visit Problem 40.2 37.6,42.8 35.9 48.7
Avoided/delay Yes 31.6 29.4,33.9 30.7 33.4 0.27
due to cost No 68.4 66.1,70.6 69.2 66.6
Dental caries indicators (mean)
DMFT 13.4 12.8,13.9 12.9 14.3 0.02
Decayed teeth 0.5 0.4,0.5 0.4 0.6 <0.01
Missing teeth 4.5 4.2,4.7 4.1 5.3 <0.01
Accepted
Article
Table 2: Relationship between socio-demographic characteristics, periodontal risk factors, preventive dental behaviours, access to dental care and DMFT (<45 excludes non-pathology), decayed, missing (<45 excludes non-pathology) and filled teeth
Dental caries indicators
DMFT Decayed teeth Missing teeth Filled teeth
Putative confounders mean p mean p mean p Mean p
Socio-demographic characteristics
Age 15-<25 years 3.0 <0.01 0.5 0.09 0.6 <0.01 1.9 <0.01
25-<35 years 5.3 0.5 0.6 4.1
35-<45 years 10.3 0.5 1.7 8.1
45-<55 years 18.5 0.5 5.5 12.4
55-<65 years 21.8 0.4 8.4 13.0
65-<75 years 23.3 0.4 11.4 11.5
75+ years 24.5 0.4 13.5 10.7
Sex Male 12.9 0.10 0.5 0.02 4.4 0.63 8.0 0.01
Female 13.8 0.4 4.5 8.9
Household <$30,000 18.3 <0.01 0.6 <0.01 8.7 <0.01 9.0 0.05
Income $30-<$60,000 14.0 0.6 4.3 9.0
$60,000+ 11.4 0.3 2.8 8.3
Highest Deg/Teach/Nurs 12.4 0.31 0.2 <0.01 3.1 <0.01 9.0 <0.01
Qualification Trade/Dip./Cert. 15.3 0.5 5.3 9.4
No Post Sec. Ed. 12.5 0.6 4.9 6.9
Country of Australia 12.9 0.99 0.4 0.30 4.2 0.73 8.2 0.66
birth Not Australia 15.3 0.6 5.5 9.2
Preventive dental behaviours
Times brushed Twice + per day 14.1 <0.01 0.4 0.05 4.6 0.07 9.2 <0.01
<2 per day 12.3 0.6 4.3 7.4
Used rinse in Did rinse 12.7 0.03 0.5 0.06 4.2 0.49 8.0 <0.01
last week Did not rinse 14.2 0.4 4.8 9.0
Used gum last Did 10.1 <0.01 0.6 <0.01 2.8 <0.01 6.7 <0.01
week Did not 14.6 0.4 5.1 9.1
Regular At least daily 15.5 <0.01 0.4 0.03 5.8 <0.01 10.3 <0.01
interdental Less than daily 12.6 0.3 3.7 8.6
cleaning Not regularly 12.3 0.6 4.4 7.3
Periodontal disease risk factors
Diabetes Yes 18.3 <0.01 0.6 0.14 8.5 <0.01 9.2 0.19
No 13.2 0.5 4.3 8.4
Smoking Current Smoker 12.7 <0.01 1.1 <0.01 4.4 <0.01 7.3 0.81
Past Smoker 16.0 0.4 6.0 9.7
Never Smoked 12.2 0.4 3.8 8.1
Access to dental care
Eligibility for Eligible 17.0 <0.01 0.7 <0.01 7.7 <0.01 8.6 0.41
public care Not eligible 12.0 0.4 3.3 8.4
FTE dentists 50+/100,000 12.9 0.12 0.3 <0.01 4.1 <0.01 8.5 0.38
per head >50/100,000 13.8 0.6 4.7 8.4
Diff. pay $100 A lot 12.2 <0.01 0.8 0.01 4.7 0.46 6.7 <0.01
dental bill None - a little 13.5 0.5 4.5 8.5
Av. time 12 mth or less 14.6 <0.01 0.3 <0.01 4.5 0.62 9.8 <0.01
between visit > 12 months 11.9 0.6 4.4 6.8
Usual reason Check-up 13.0 0.03 0.3 <0.01 3.9 <0.01 8.8 <0.01
dental visit Problem 14.0 0.8 5.4 7.9
Avoided/delay Yes 12.8 0.08 0.7 <0.01 4.1 0.03 8.0 0.06
Accepted
Article
Table 3: Multivariable models for dental caries indicators with socio-demographic characteristics, preventive dental behaviour, access to dental care parameters and regional location
Dental caries indicators
DMFT Decayed teeth Missing teeth Filled teeth
Parameters Est. *
p Est
.
p Est. p Est
.
p
Socio-demographic characteristics
Age (15-<25 years, ref: 75+ years) -20.6
<0.0 1
0.2 0.20 -12.7 <0.0 1
-8.1
<0.0 1 Age (25-<35 years, ref: 75+ years)
-17.6
<0.0 1
0.4 0.01 -12.3 <0.0
1
-5.7
<0.0 1 Age (35-<45 years, ref: 75+ years)
-13.3
<0.0 1
0.2 0.12 -11.6 <0.0 1
-1.9
<0.0 1 Age (45-<55 years, ref: 75+ years) -5.0 <0.0
1
0.3 0.04 -7.7 <0.0
1
2.4 <0.0
1 Age (55-<65 years, ref: 75+ years) -2.1 <0.0
1
0.1 0.58 -5.1 <0.0 1
3.0 <0.0 1
Age (65-<75 years, ref: 75+ years) -1.0 0.10 0.0 0.81 -2.7 <0.0
1
1.7 0.02
Income ($30,000-$59,999, ref:<$30,000)
-0.2 0.44 0.2 0.22 -1.2 <0.0 1
0.8 0.11
Income ($60,000+, ref: <$30,000) -0.9 0.04
-0.0
0.76 -1.2 <0.0
1
0.4 0.46
Educ. (Trade/Dip/Cert, ref: No post-sec)
0.0 0.98 -0.2
0.02 -0.3 0.20 0.6 0.07
Educ. (Deg/Teach/Nur, ref: No post-sec)
-0.6 0.04
-0.3
<0.0 1
-1.1 <0.0 1
0.8 0.01
Preventive dental behaviour
Times brushed (2+/day, ref: (<2/day) -0.2 0.48 -0.1
<0.0 5
-0.3 0.10 0.3 0.31
Access to dental care
Eligibility for public care (Yes, ref: No)
0.4 0.32 0.2 0.13 0.2 0.53
-0.0
0.98
FTE dentists (100,000 (<50, ref: ≥50) 0.2 0.59 0.1 0.04 0.2 0.33 -0.1
0.79
Av. time visits (>12 mths ref: ≤12 mths)
-1.9 <0.0 1
0.1 0.20 0.0 0.99
-2.0
<0.0 1 Usual reason visit (Chk-up, ref: Prob.) -1.4 <0.0
1
-0.4
<0.0 1
-1.1 <0.0 1
-0.1
0.61
Region location (Non-metro, ref: Metro)
0.8 0.01 0.1 0.10 0.8 <0.0
1
-0.1
0.64
R2=0.69, Model p<0.01
R2=0.09, Model p<0.01
R2=0.52, Model p<0.01
R2=0.41, Model p<0.01
Accepted
Article
Table 4 Multivariable models for dental caries indicators with socio-demographic characteristics, access to dental care parameters, regional location, plus lifetime fluoride exposure
Dental caries indicators
DMFT Decayed teeth Missing teeth Filled teeth
Parameters Est.* p Est. p Est. p Est. p
Socio-demographic characteristics
Age (15-<25 years, ref: 75+ years) -20.1 <0.01 0.2 0.25 -12.8 <0.01 -7.5 <0.01
Age (25-<35 years, ref: 75+ years) -17.2 <0.01 0.4 0.01 -12.4 <0.01 -5.1 <0.01
Age (35-<45 years, ref: 75+ years) -13.0 <0.01 0.2 0.14 -11.7 <0.01 -1.5 0.04 Age (45-<55 years, ref: 75+ years) -4.8 <0.01 0.3 <0.05 -7.7 <0.01 2.6 <0.01
Age (55-<65 years, ref: 75+ years) -1.9 <0.01 0.1 0.59 -5.2 <0.01 3.8 <0.01
Age (65-<75 years, ref: 75+ years) -0.9 0.14 0.0 0.82 -2.7 <0.01 1.8 0.01
Income ($30,000-$59,999, ref:<$30,000)
-0.3 0.55 0.2 0.22 -1.2 <0.01 0.8 0.13
Income ($60,000+, ref: <$30,000) -0.9 <0.05 -0.0 0.76 -1.2 <0.01 0.4 0.40
Educ. (Trade/Dip/Cert, ref: No post-sec 0.0 0.95 -0.2 0.02 -0.3 0.20 0.6 0.06
Educ. (Deg/Teach/Nur, ref: No post-sec)
-0.6 <0.05 -0.3 <0.01 -1.1 <0.01 0.8 0.01
Preventive dental behaviour
Times brushed (<2/day, ref: 2+/day) -0.3 0.35 -0.1 <0.05 -0.3 0.11 0.2 0.47
Access to dental care parameters
Eligibility for public care (Yes, ref: No) 0.4 0.30 0.2 0.14 0.2 0.54 0.0 0.99
FTE dentists (100,000 (<50, ref: ≥50) -0.1 0.73 0.1 <0.05 -0.2 0.31 -0.0 0.97
Av. time visits (>12 mths ref: ≤12 mths)
-1.9 <0.01 0.1 0.21 -0.0 0.99 -1.9 <0.01
Usual reason visit (Chk-up, ref: Prob.) -1.4 <0.01 -0.4 <0.01 -1.1 <0.01 0.1 0.65
Proportion Lifetime Fluoridation Exposure**
-1.3 <0.01 0.0 0.32 0.3 0.19 -1.6 <0.01
Region location (Non-metro, ref: Metro)
0.6 0.09 0.1 0.11 0.9 <0.01 -0.5 0.09
R2=0.69, Model p<0.01
R2=0.09, Model p<0.01
R2=0.52, Model p<0.01
R2=0.42, Model p<0.01
* The estimate is the regression coefficient, the size of which gives the magnitude of the effect that each independent variable is having on the dependent variable, and the sign on the coefficient gives the direction of the effect.