1
INTEGRATING ALTERNATIVE FUELS IN THE NORTH CAROLINA TRANSPORTATION SECTOR
Marie Patane Curtis
A thesis submitted to the faculty at the University of North Carolina at Chapel Hill in partial fulfillment of the requirements for the degree of Master of Science in the Department of Environmental Science and Engineering in the Gillings School of Global Public Health and the
degree of Master of City and Regional Planning in the College of Arts and Science.
Chapel Hill 2014
Approved by:
Richard Andrews
iii ABSTRACT
Marie Patane Curtis: Integrating Alternative Fuels in the North Carolina Transportation Sector (Under the direction of Richard Andrews and Nikhil Kaza)
iv
ACKNOWLEDGEMENTS
There are several people who have provided their time and effort to support this project. Lacey Jane Wolfe, Brennan Bouma, and the rest of the Energy and Environment team at the Triangle J Council of Governments lent their invaluable expertise to all of my inquiries. Pete Andrews, my academic adviser, never failed to provide constructive feedback on all of my work. Nikhil Kaza, my research adviser, gave me the freedom and opportunity to pursue energy
v
TABLE OF CONTENTS
LIST OF TABLES ... ix
LIST OF FIGURES ... xiii
Chapter 1: Introduction ... 1
Chapter 2: Literature Review ... 4
Conventional Electricity and Natural Gas Sources ... 4
Renewable Electricity Inventory ... 4
Renewable Natural Gas Inventory ... 6
Energy Security ... 8
Greenhouse Gas Emissions ... 8
Air Pollutants ... 9
Emission Calculation Tools ... 10
Chapter 3: Methods ... 12
Conventional Electricity and Natural Gas ... 12
Renewable Electricity ... 13
Renewable Natural Gas ... 13
Petroleum Use, Greenhouse Gas Emissions, and Air Pollutants ... 14
vi
Chapter 4: AFLEET Scenarios and Results ... 17
Baseline: Gasoline and Diesel ... 17
Compressed Natural Gas in Heavy-Duty Vehicles ... 18
Electricity in Light-Duty Vehicles ... 25
Light-duty PHEVs and Heavy-duty CNG Vehicles ... 35
Chapter 5: Recommendations ... 36
Increase Energy Security ... 37
Mitigate Climate Change ... 38
Improve Air Quality ... 39
Land Use ... 40
AFLEET Model Limitations ... 41
Renewable Energy Calculation Improvements ... 42
Conclusion ... 43
Glossary ... 44
Appendix A: Conventional Energy Sources ... 52
Conventional Natural Gas ... 52
Conventional Electricity ... 54
Appendix B: Renewable Sources ... 59
System Losses ... 61
vii
Renewable Electricity ... 69
Hydroelectric Power ... 82
Appendix C: AFLEET Calculations ... 84
Baseline: Gasoline and diesel ... 84
Compressed Natural Gas in Heavy-Duty Vehicles ... 92
Electricity in Light-Duty Vehicles ... 96
Light-Duty PHEVs and Heavy-Duty CNG Vehicles ... 103
Appendix D: Input Calculations ... 110
Statewide Impact ... 110
Appendix E: Alternative Fuel Energy Capacity ... 122
viii
LIST OF TABLES
Table 3.1 Annual Transportation Energy of Renewable Electricity ...13
Table 3.2 Annual Transportation Energy of Renewable Natural Gas ...14
Table 3.3 Vehicle classes and fuel types included in the scope of work ...15
Table 3.4 AFLEET Model Inputs ...15
Table 4.4 Annual Transportation Energy of Renewable Natural Gas ...18
Table 4.5 Annual Transportation Energy of Renewable Electricity ...25
Table 4.8 Balanced Transition Cases and the Performance over the Baseline from 2015-2030 ...35
Table 5.1 Possible Scenarios and the Performance over the Baseline, 2015-2030 ...37
Table B.1 Potential Annual Renewable Energy Capacity in North Carolina ...59
Table B.2 Annual Transportation Energy of Renewable Natural Gas ...62
Table B.3 Annual Transportation Energy from RNG by County ...63
Table B.4 Annual Transportation Energy of CAFOs ...66
Table B.5 Energy Conversion Constants ...67
Table B.6 Annual Transportation Energy from Renewable Electricity in North Carolina ...70
ix
Table B.8 Areas of Exclusion for Medium to Large-Scale Solar
Applications ...75 Table B.9 Available Areas for Commercial Offshore Wind Production ...79 Table B.10 Heat Energy Content of Biomass Residues ...82 Table C.1 Typical AFLEET Outputs for Light-Duty Gasoline Passenger
Vehicles by Age ...85 Table C.2 Typical AFLEET Outputs for Light-Duty Diesel Passenger
Vehicles by Age ...86 Table C.3 Typical AFLEET Outputs for Light-Duty Gasoline
Commercial Trucks by Age ...87 Table C.4 Typical AFLEET Outputs for Light-Duty Diesel Commercial
Trucks by Age ...88 Table C.5 Typical AFLEET Outputs for Heavy-Duty Diesel Transit
Buses by Age ...89 Table C.6 Typical AFLEET Outputs for Heavy-Duty Gasoline Short
Ton Trucks by Age ...90 Table C.7 Typical AFLEET Output for Heavy-Duty Diesel Short Ton
Trucks by Age ...91 Table C.8 Statewide Impact of Gasoline and Diesel ...92 Table C.9 Transportation Energy Allocated to Transit Buses and Short
x
Table C.12 AFLEET Outputs for CNG Short Haul Trucks ...95
Table C.13 Statewide Impact of Conventional and Shale Natural Gas ...95
Table C.14 Statewide Impact of Renewable Natural Gas...96
Table C.15 Electricity Generation Mix in North Carolina ...97
Table C.16 PHEV Fuel Economy ...98
Table C.17 AFLEET Outputs for PHEV Commercial Trucks and PHEV Passenger Cars ...99
Table C.18 PHEV Quantities – 25 Percent Adoption Level ...100
Table C.19 Conventional Electricity Statewide Impact – 25 Percent Adoption Level ...100
Table C.20 Renewable Electricity Statewide Impact – 25 Percent Adoption Level ...101
Table C.21 PHEV Quantities – 50 Percent Adoption Level ...101
Table C.22 Conventional Electricity Statewide Impact – 50 Percent Adoption Level ...102
Table C.23 Renewable Electricity Statewide Impact – 50 Percent Adoption Level ...102
Table C.24 Low PHEV Adoption Level and HD CNG Vehicle Quantities ...104
Table C.25 Conventional Electricity Statewide Impact: Low PHEV Adoption and HD CNG Vehicles ...105
xi
Table C.27 Moderate PHEV Adoption and HD CNG Vehicle Quantities ...107
Table C.28 Conventional Electricity Statewide Impact: Moderate PHEV Adoption and HD CNG Vehicles ...108
Table C.29 Renewable Electricity Statewide Impact: Moderate PHEV Adoption and HD CNG Vehicles ...109
Table D.1 AFLEET Default Annual Vehicle Miles Travelled ...110
Table D.2 Average Percentage of Vehicle Classes from 2000-2011...114
Table D.3 Vehicle Registrations (2000-2011) and Projections (2012-2030) by Vehicle Type ...115
Table D.4 Light-Duty Passenger Car Quantities by Fuel Type ...117
Table D.5 Light-Duty Commercial Truck Quantities by Fuel Type ...118
Table D.6 Heavy-Duty Vehicle Quantities by Fuel Type ...119
Table D.7 Example of Vehicle Age Distributions for 2015 ...121
xii
LIST OF FIGURES
Figure 2.1 A Comparison of GHG Calculation Models ... 9
Figure 4.1 Baseline: Petroleum Consumption in North Carolina ... 18
Figure 4.2 Annual Petroleum Consumption of NG and Gasoline/Diesel HD Vehicles ... 20
Figure 4-3 Change of AFLEET Outputs from 2015-2030 Relative to the Baseline Scenario ... 20
Figure 4-4 Gasoline and Diesel vs. Natural Gas GHG Emissions in Heavy-Duty Vehicles ... 21
Figure 4-5 Air Pollutant Emissions – Natural Gas vs. Gasoline and Diesel ... 23
Figure 4.6 AFLEET Heavy-Duty CO Vehicle Emission Factors ... 24
Figure 4.7 AFLEET Heavy-Duty VOC Vehicle Emission ... 24
Figure 4.8 Petroleum Consumption – Low PHEV Adoption ... 27
Figure 4.9 Comparing the AFLEET Outputs of Low PHEV Adoption to the Baseline ... 27
Figure 4.10 Light-Duty GHG Emissions – Low PHEV Adoption ... 28
Figure 4.11 Air Pollutant Emissions – Low PHEV Adoption ... 30
Figure 4.12 Petroleum Consumption – Moderate PHEV Adoption ... 31
Figure 4.13 GHG Emissions – Moderate PHEV Adoption ... 32
xiii
Figure 4.15 Air Pollutant Emissions – Moderate PHEV Adoption ... 34
Figure A.1 Natural Gas Transmission Pipeline Network ... 54
Figure A.2 Natural Gas Local Distribution Company Service Areas ... 55
Figure A.3 North Carolina Electricity Providers ... 56
Figure B.1 Location of Renewable Energy in North Carolina by County ... 60
Figure B.2 Renewable Energy System Diagram ... 61
Figure B.3 Annual Renewable Natural Gas in North Carolina by County ... 63
Figure B.4 Solar Radiation Potential in North Carolina ... 73
Figure B.5 Areas of Exclusion for Medium to Large-Scale Solar Applications – Non-forest ... 74
Figure B.6 Areas of Exclusion for Medium to Large-Scale Solar Applications – Forest ... 74
Figure B.7 Available Areas for Medium to Large-scale Solar Energy Systems ... 76
Figure B.8 Land-based Wind Speeds in North Carolina ... 77
Figure B.9 Protected Mountain Ridges in North Carolina ... 78
Figure B.10 Areas of Exclusion for Wind Power Generation ... 79
Figure B.11 Viable State and Federal Offshore Wind Resources in North Carolina ... 80
Figure B.12 Biomass Energy Resources ... 81
xiv
Figure C.1 PHEV Adoption Levels ... 97 Figure D.1 Diagram of Vehicle Quantity and Statewide Impact
Calculations ... 111
1
CHAPTER 1: INTRODUCTION
The political debate surrounding global warming and anthropogenic climate change is highly contentious. However, there is little debate as to the merits of utilizing local assets to maximize limited state resources. This study will demonstrate that displacing imported gasoline and diesel fuel in North Carolina with locally-sourced renewable electricity (RE) and renewable natural gas (RNG)1 can result in an annual reduction in petroleum use by 20-40 percent and an annual reduction of transportation greenhouse gas (GHG) emissions by 10-36 percent by 2030. The magnitude of the reduction depends on the degree of petroleum displacement. Potential benefits of such displacement could include local climate change mitigation, increased energy security, and improved air quality.
The transportation sector accounted for 28 percent of the GHG emissions released in North Carolina in 2011 (EPA 2013d). In addition to vehicles, potential RNG sources such as landfills, concentrated animal farm operations, and wastewater treatment plants in North
Carolina can emit large quantities of methane, a potent GHG. GHG emissions absorb heat in the atmosphere which can raise the overall temperature of the Earth. The effect of GHGs on global warming depends on the concentration of gas in the atmosphere, the duration of time the gas remains in the atmosphere, and how well it absorbs heat2. Global temperature changes can
1 This study is limited to electricity and natural gas to examine the impact of conventional and renewable sources.
Consequently, other alternatives such as propane, hydrogen, biodiesel, and ethanol are not considered.
2 Methane is efficient at trapping radiation. Over a 100-year period it has approximately 21 times the impact of CO 2
2
manifest as regional climate changes and extreme weather events. Since 2003, Federal Emergency Management Agency (FEMA) has declared 13 major weather-related disasters in North Carolina and five emergency declarations for hurricanes Katrina (2005), Ophelia (2005), Earl (2010), and Irene (2011) (FEMA 2014). Although global warming is an international phenomenon, minimizing GHG emissions at the state level may contribute to mitigating the cause of extreme weather in North Carolina.
Weather-related disruptions in imported energy supply can severely impact daily operations. North Carolina is one of the most energy-insecure states in the U.S., as it relies heavily on energy imports from other states and foreign sources. In 2011, it produced only 22 percent of the total energy that it consumed. Of that total energy, the transportation sector consumed 27.5 percent in 2012 (EIA 2013). Instability in the Middle East, a major source of petroleum, can cause fuel prices to increase substantially. Conventional and shale natural gas, which is refined in the Gulf Coast and delivered to North Carolina via the interstate pipeline, has a similar effect. Power outages in North Carolina have resulted in a loss of electricity to fuel pumps in fuel storage facilities, interstate pipelines, and local retail gas stations. In general, 27 percent of power disruptions are due to weather-related events (Eaton 2013). During the 2005 and 2008 hurricane season, North Carolina was impacted by severe fuel shortages and price gouging (Lippert et al. 2009; Burnsed 2008). Transitioning to intrastate renewable transportation fuels can reduce the risk of energy disruptions due to political instability in foreign nations or delivery delays due to pump failures in the interstate pipelines.
3
Vehicles release air pollutants such as carbon monoxide (CO), mono-nitrogen oxides (NOX), particulate matter (PM)3, and volatile organic compounds (VOC) during operation. These pollutants can cause detrimental health effects in humans. Inhaling CO can reduce oxygen delivery to organs. In high concentrations it can even cause death. PM10 and PM2.5 can cause both lung and heart issues. In high temperatures, VOCs react with NOX to create ozone. Inhaling NOX and ground-level ozone can lead to respiratory problems. “Parts of the South that currently have about 60 days per year with temperatures over 90°F are projected to experience 150 or more days a year above 90°F by the end of this century”(Karl et al. 2009). As temperatures and air pollutants continue to rise, detrimental health effects are expected to increase. Treating these medical conditions can be costly. For example, in 2011, there were more than 10,100 hospital admissions for asthma in North Carolina, costing at least $13,600 per stay (White House 2014).
The source and type of transportation fuel has a significant impact on the environment, security, and health of a state. This study aims to brief policy makers and government officials with a comparison of the consequences of these transportation fuel options so that they may make informed decisions regarding the deployment of long term energy and transportation infrastructure in North Carolina.
3 PM that is less than 2.5 micrometers is referred to as PM
2.5. PM that is greater than 2.5 and less than 10
4
CHAPTER 2: LITERATURE REVIEW
Conventional Electricity and Natural Gas Sources
Conventional electricity and natural gas resources are imported into North Carolina. These quantities are well-documented by the Department of Energy (DOE). The Energy
Information Administration (EIA), an agency of the DOE, releases data that is updated annually and available to the public (EIA 2014b; EIA 2012). Additionally, the North Carolina Utilities Commission (NCUC) publishes annual reports of electricity consumption and generation for each electrical utility operating in the state (NCUC 2013b).
Renewable Electricity Inventory
5
North Carolina has significant solar energy resources and solar technology adoption is increasing within the state. According to the OpenPV Project, North Carolina ranks 14 for installed PV system capacity (NREL 2014). NCUC has published several reports detailing availability of solar generation available for consumption. However, these estimates are based on deployed technology, not on maximized solar energy resources. Similar to biomass, NREL published a map of solar resources by county for North Carolina. However, this map does not take existing infrastructure (i.e. highways, railroads, urban centers, military bases, etc.), natural obstacles (i.e. forests, water features, etc.), and protected areas (i.e. conservation areas, regulated areas, etc.) into account. There is very little work on the solar power potential based on land use and insolation data. McLaren (2011) provides an assessment of the full potential of solar power in North Carolina, but does not provide calculation details.
In recent years large-scale wind installations have been proposed in both onshore and offshore applications. However, there are no large-scale wind generation systems operating in North Carolina. Regional, state, and county wind speed maps are available and can be used to determine the energy capacity and feasibility of wind power in North Carolina (NREL 2013; NOAA 2014; Appalachian State University 2014). However, siting issues and local regulations can prevent deployment. Instead, the capacity of offshore wind as detailed in the report,
Assessment of Offshore Wind Energy Resources for the United States, is considered as the only viable source of wind energy in North Carolina (Schwartz et al. 2010).
6
(2011) identifies sites along the North Carolina coast that may theoretically produce 66 MW from tidal streams. However, technology for commercial-sized tidal energy generation is still under development and considered financially prohibitive. The EIA publishes recent
hydroelectric power production data which are used in this analysis.
Renewable Natural Gas Inventory
RNG includes methane capture from landfills, concentrated animal farm operations (CAFOs), and wastewater treatment plants (WWTPs). Methane capture to produce RNG for transportation is not an active application in North Carolina. However, this technology is applied in California and Georgia (Cardwell 2013; Harlow 2012).
The Landfill Methane Outreach Program (LMOP) is a voluntary network that provides access to landfill and industry data (EPA 2013b). Academic literature focuses on scientific field measurements to determine the rate of methane production (Bogner et al. 1995; Spokas et al. 2006). Peer et al. (1993) compares methods for estimating global methane emissions4. Themelis and Ulloa (2007) use revised methane emission rates to estimate the total methane potential in the United States5. Cooley et al. (2013) provides the annual heat energy (MMbtu/year) and the costs of landfill methane collection systems in North Carolina, the calculation details are not included6. This study will provide an estimate of transportation energy by county based on the potential and candidate landfills identified by the LMOP.
WWTPs and concentrated animal feeding operations (CAFOs) can utilize anaerobic digestion to produce methane to convert to natural gas. The academic literature for WWTPs
4
This study concludes that models (especially those that used U.S. data as inputs) overestimate global landfill methane emissions and recommends calibrating the models with data from landfills located in other countries.
7
focuses on the effectiveness of various technologies used to produce methane (Cakir and Stenstrom 2005; Ting and Lee 2007; Keller and Hartley 2003). El-Fadel and Massoud (2001) discuss the methods used to estimate methane emissions from WWTPs. Industry reports regarding system costs in the U.S. are scarce because there are few facilities that deploy this technology. Wong (2011) compares the economic feasibility of WWTP to energy systems of varying capacities in Massachusetts. In some cases, total system costs are provided, but a breakdown of the costs of the system components is not provided. Similarly, Mes et al. (2003)7 provides the total investment of six operational WWTPs in Europe. This analysis estimates the energy potential of WWTPs in North Carolina based on the permitted design capacity of operational facilities.
Based on their energy calculations, Darmawan Prasodjo et al. (2013) conclude that deploying methane capture systems in only 127 of the swine farms out of the 2,700 permitted CAFOs currently in operation would meet the North Carolina Renewable Energy and Energy Efficiency Portfolio Standards mandate. It also compares the economic feasibility of deploying a decentralized system for electricity generation versus a centralized fuel-delivery system that injects CNG into the existing interstate pipeline. Detrimental emissions and water quality impacts due to CAFOs in North Carolina have been discussed by Blunden et al. (2005), Schiffman et al. (2001), and Sharpe et al. (2002). Managing animal waste by deploying a methane capture system would improve water quality and air emissions. However, these effects of methane production are not within the scope of this study.
Industry reporting on the deployment of anaerobic digestion technology in North Carolina is sparse because there are only six operational systems in the state. AgSTAR’s
8
reporting database estimates that there are only 202 anaerobic digesters operating on commercial farms in the U.S. (EPA 2013c). On June 2013, Cavanaugh & Associates presented a case study at the AgSTAR National Conference of Loyd Ray Farms as the first swine waste-to-energy system in North Carolina to submit renewable energy credits (RECs) to the NCUC, the first transfer of RECs from a swine farm to Duke Energy, and the first innovative swine waste treatment system to utilize a digester (Simmons 2013). Generally, there is no estimate for the total energy potential of animal waste produced in North Carolina CAFOs by county. This report will provide that estimate based on the facilities permitted in 2013.
Energy Security
In recent years extreme weather has severely disrupted the power supply in disaster-prone areas. Without electricity, the pumps at pipeline transfer stations no longer function and transportation fuel cannot be distributed to retailers. Similarly, the pumps at retail fueling stations can no longer distribute fuel to paying customers without electricity. In 2009, National Association of State Energy Officials (NASEO) funded the creation of state and local energy assurance and
emergency preparedness plans. These plans emphasize a diversification of transportation fuels to mitigate any interruption of the petroleum supply chain. Twenty-nine of the 39 state energy plans reviewed by NASEO have goals to develop alternative transportation fuels (NASEO 2013).
Greenhouse Gas Emissions
9
(Sommeiller and Price 2014). The EPA State Inventory Tool (SIT) provides emission
calculations for methane and N2O only8. However, the SIT does indicate a decrease in emissions similar to the results of the AFLEET model. This study will provide an additional point of comparison to the 2007 projections.
Figure 2.1 A Comparison of GHG Calculation Models (CCS 2007; ANL 2013; EPA 2014)
* GHG values include pump-to-wheels N2O and CH4 emissions only.
Air Pollutants
The connection between transportation fuel and air pollutants is widely accepted by the scientific community, government agencies, industry, and academia. All vehicles sold within the U.S. must undergo emissions testing to demonstrate compliance with federal standards. Attempts to compare emissions of gasoline, diesel, and CNG vehicles are also extensively studied in academic literature. Schauer et al. (2002) quantifies air pollutants in tailpipe emissions from light-duty passenger cars and trucks. Miguel et al. (1998) compares the air pollutant emissions of
8 The inputs used in the AFLEET model were used to calculate the GHG emissions of the EPA’s SIT model (mobile
combustion module).
1990 2000 2005 2010 2020 2030 CCS 2007 36.56 49.1 55.2 61.4 74.4 AFLEET 2014 48.71 49.33 45.38 44.38 40.91 SIT 2013 * 2.11 2.73 1.91 0.97 0.75 0.7
0 10 20 30 40 50 60 70 80
GHG (M
M
TCO
2
10
light-duty gasoline vehicles and light- and heavy-duty diesel vehicles. Ayala, A. et al. (2002) compares the air pollutant emissions of diesel and CNG transit buses over varying driving cycles. Wang and Huang (2001) compare the emissions of various natural gas-based fuels in different vehicle technologies. Furthermore, there are many mathematical models that are used to calculate petroleum consumption, greenhouse gas emissions, and air pollutants for various fuel types and vehicle technologies.
Emission Calculation Tools
There are several tools that compare the economic and environmental costs and benefits of the various alternative fuels for light-, medium- and heavy-duty (HD) fleet vehicles. Weigel et al. (2010) compares various inventory and life-cycle analysis fleet calculators and concludes that “no single calculator contains all information needed by transit agencies to develop a truly comprehensive, life cycle-based accounting of the emissions produced by vehicle fleet operations and for a wide range of vehicle and fuel technology options.” The MIT Emissions Prediction and Policy Analysis Version 5 (EPPA5) examines the interdependencies of vehicle miles travelled, vehicle fuel efficiency, fuel price, energy, and GHG emissions as inputs in an economic feasibility model (Karplus et al. 2013).
The DOE has released several calculation tools based on specific needs of the fleet manager. The Petroleum Reduction Planning (PREP) Tool creates a plan to reduce fleet
11
used to generate the petroleum use and GHG emissions in a well-to-wheels life-cycle analysis for various alternative fuels of medium-, HD, and off-road vehicles, but it does not incorporate light-duty vehicles (LD) into the analysis.
The Mobile Combustion module of the Environmental Protection Agency (EPA) State Inventory Tool (SIT) projects GHG emissions up to 2030 based on historical data. However, the Mobile Combustion module does not incorporate electric vehicle technologies. Also, it cannot be modified to model different scenarios based on the proposed adoption rates of CNG and EV vehicles from 2015-2030. The EPA has also released the Multi-scale mOtor Vehicle and equipment Emission System (MOVES). However, MOVES does not allow the user to integrate renewable options of compressed natural gas and electricity.
The Alternative Fuel Life-Cycle Environmental and Economic Transportation (AFLEET) tool is used for this analysis because it is the most flexible tool available that allows user-defined inputs. It calculates the petroleum use, air pollutants, and GHG emissions for LD and HD
12
CHAPTER 3: METHODS
The current transportation fuel mix in North Carolina is dominated by gasoline and diesel in light-duty (LD) and heavy-duty (HD) vehicles (FHWA 2011). Electricity is studied as an alternative fuel for LD vehicles. Plug-in hybrid electric vehicles (PHEVs) consume both gasoline and electricity and are a reasonable transitional LD alternative fuel vehicle. Compressed natural gas (CNG) is studied as an alternative for HD vehicles. HD vehicles such as transit buses and single unit short haul trucks are most likely to function primarily within North Carolina and are included in the scope of work.
Conventional Electricity and Natural Gas
13 Renewable Electricity
In this study, electricity will be used to fuel PHEVs. Renewable electricity (RE) includes solar9, offshore wind, biomass, and hydropower. An inventory of RE can be found in Appendix B and is summarized in Table 3.1. Per the RE inventory, the RE capacity can support the projected quantities of light-duty vehicles from 2015-2030. The projected vehicle quantities can be found in Appendix D.
Table 3.1 Annual Transportation Energy of Renewable Electricity
Renewable Electricity * Energy (MMbtu) Electricity Fuel (GGE) Solar 6,500,000,000 21,000,000,000
Biomass 14,000,000 5,200,000
Offshore Wind 520,000,000 46,000
Hydropower 29,000 19,000
Total 7,000,000,000 21,000,000,000 * System losses are not included
Renewable Natural Gas
Renewable natural gas (RNG) production consists of methane capture in landfills and anaerobic digestion systems used in wastewater treatment plants and concentrated animal farm operations. RNG can be further processed to produce compressed natural gas (CNG). It is important to note that although natural gas can be used generate electricity, electricity as a transportation fuel derived from RNG does not fall within the scope of this study. The results of the RNG inventory in Appendix B are summarized in Table 3.2. The annual RNG capacity can offset all of the short haul gasoline trucks registered each year from 2015-2030. The remaining RNG can be used to offset nearly 65 percent of the remaining HD vehicles that consume diesel.
9 This method is similar to those used by the Renewable Project Database in California and the Renewable Energy
14
A complete transition to NG can occur as early as 2028. The projected vehicle quantities can be found in Appendix D.
Table 3.2 Annual Transportation Energy of Renewable Natural Gas
Renewable Natural Gas * Energy (MMbtu) CNG Fuel (GGE)
Landfill 15,000,000 132,000,000
Wastewater Treatment Plant (WWTP) 4,300 1,600
Concentrated Animal Farm Operation (CAFO) 6,500,000 32,000,000
Total 22,000,000 164,000,000
* System losses are not included
Petroleum Use, Greenhouse Gas Emissions, and Air Pollutants
The Department of Energy (DOE) Alternative Fuel Life-Cycle Environmental and
Economic Transportation (AFLEET) tool can compare the environmental and economic costs
and benefits of advanced vehicles and alternative transportation fuels. For this study, the
AFLEET tool will only be used to compare the environmental tradeoffs. The AFLEET tool
calculates the annual petroleum use, greenhouse gases (GHGs), and air pollutants emitted by vehicles. Data gathered by federal agencies and other sources were incorporated into the model and includes regional sources of fossil fuels, electricity consumption and production, waste management, and vehicle specifications.
Vehicle types are specified by the vehicle class (LD passenger car, LD commercial truck, transit bus, and HD single unit short haul truck) and fuel type (gasoline, diesel, CNG, and
15
Table 3.3 Vehicle classes and fuel types included in the scope of work
Fuel Type Gaso lin e Diesel C NG E lectr icity Veh icle C las
s Light-Duty Passenger Car X X X
Light-Duty Commercial Truck X X X
Heavy-Duty Transit Bus X X
Heavy-Duty Single Unit Short Haul Truck X X X
Table 3.4 AFLEET Model Inputs
Description Conventional Energy Renewable Energy
1 Primary Vehicle Location North Carolina
2 CNG Feedstock Source North American Natural Gas (66% conventional, 34% shale)
Landfill gas (LFG): methane collection. LFG AFLEET values serve as proxies to wastewater treatment plant and concentrated animal farm operation values 3 Source of Electricity for
Plug-in Hybrid Electric Vehicles (PHEVs) and All-Electric Vehicles (EVs)
Southeast Electric Reliability Council (SERC) Reliability Corporation AFLEET default regional values
Residual oil - 0.2% Natural gas - 40% Coal - 10%
Nuclear power - 27.5% Biomass - 10% Other - 12.3% See Appendix C 4 Class: Light-duty Passenger Car
Light Commercial Truck
Class: Heavy-duty Transit Bus
Single Unit Short-Haul Truck
5 Fuel Type Gasoline, diesel, CNG, electricity CNG, electricity
6 Model Year/Age 0-30 years old EPA SIT
0-30 years old * EPA SIT 7 Annual Vehicle Mileage Default values provided by AFLEET
8 Fuel Use (gal or GGE) = Annual VMT (miles)* Fuel Efficiency (gal or GGE/miles) U.S. Energy InformationAdministration Energy Outlook 2014
Fueleconomy.gov
16 Calculating the Statewide Impact
The statewide impact is calculated by multiplying the AFLEET outputs by the total number of vehicles of a specific type (see Table 3.3) that are registered in North Carolina in a specific year. See Appendix D for vehicle quantities and calculation details. The following equations are used to calculate the statewide impact:
17
CHAPTER 4: AFLEET SCENARIOS AND RESULTS
The Department of Energy Alternative Fuel Life-Cycle Environmental and Economic Transportation (AFLEET) tool is used to determine the effect that a transition to electricity and
compressed natural gas (CNG) will have on petroleum consumption, greenhouse gas (GHG)
emissions, and air pollutant emissions in North Carolina.
Four scenarios are examined. The baseline assumes a continued use of gasoline and diesel in light-duty (LD) and heavy-duty (HD) vehicles per historical trends. The second scenario maximizes the use of CNG in HD vehicles and compares the results of conventional and shale natural gas to RNG. HD vehicles that consume gasoline and diesel may be easily converted to use CNG. The third scenario compares the use of electricity from conventional and renewable sources in plug-in hybrid electric light-duty vehicles (PHEVs). Twenty-five and 50 percent PHEV adoption levels by 2030 are also separately considered in this scenario. The last scenario models the adoption of both HD CNG vehicles and LD PHEVs.
Baseline: Gasoline and Diesel
18
Figure 4.1 Baseline: Petroleum Consumption in North Carolina
Compressed Natural Gas in Heavy-Duty Vehicles
CNG is used as an alternative to gasoline and diesel fuel in HD vehicles. The sources and distribution of conventional and shale natural gas (NG) can be found in Appendix A. An
inventory of RNG can be found in Appendix B and is summarized in Table 4.4.
Table 4.4 Annual Transportation Energy of Renewable Natural Gas
Renewable Natural Gas * Energy (MMbtu) CNG Fuel (GGE)
Landfill 15,000,000 130,000,000
Wastewater Treatment Plant (WWTP) 4,300 1,600
Concentrated Animal Farm Operation (CAFO) 6,500,000 32,000,000
Total 22,000,000 160,000,000
*System losses are not included
The following assumptions are incorporated into the AFLEET model and statewide impact calculation:
1. Light-duty vehicle growth increases per the Baseline. LDGV
LDGT HDDV
- 10 20 30 40 50 60 70 80 90 100
2000 2005 2010 2015 2020 2025 2030
Pet
ro
le
u
m
(
M
ill
io
n
b
ar
re
ls)
LDGV LDGT HDGV LDDV LDDT HDDV
19
2. Gasoline and diesel vehicle inputs are the only light-duty vehicles included in the AFLEET model.
3. 27.5% of natural gas resources will be utilized as transportation fuel.
4. Non-RNG resources are derived from North America and consist of 66 percent conventional and 24 percent shale natural gas.
5. Landfill constants used in the AFLEET calculations are also used as proxy values for concentrated animal farm operations and wastewater treatment plants.
6. RNG resources are utilized at full capacity.
7. For the sake of comparison, conventional and shale NG quantities are equal to RNG quantities.
The potential annual RNG capacity can offset all registered short haul gasoline trucks starting in 2015. The balance of RNG can offset nearly 65 percent of the remaining HD vehicles consuming diesel (i.e. transit buses and single unit short haul trucks). A complete transition of HD vehicles to NG can occur as early as 202810. Conventional and shale NG and RNG perform better than gasoline and diesel in petroleum consumption, with a 17 percent annual reduction in 2015 that increases to 28 percent by 2030 (see Figure 4.2). Over 15 years, there is a 21 percent
total reduction in petroleum use (see Figure 4.3). RNG performs only marginally better than conventional and shale NG in petroleum use (by 0.11 percent).
10
20
Figure 4.2 Annual Petroleum Consumption of NG and Gasoline/Diesel HD Vehicles
55 60 65 70 75 80 85 90
2015 2020 2025 2030
Pet ro le u m (M ill io n s B ar re ls)
Baseline CNG RNG
Figure 4-3 Change of AFLEET Outputs from 2015-2030 Relative to the Baseline Scenario
Petroleum -21% Petroleum -21% GHG -9% GHG -19% CO 34% CO 34% NOx -9% NOx -9% PM10 -0.3% PM10 -0.3% PM2.5 -0.2% PM2.5 -0.2% VOC 30% VOC 30% -30% -20% -10% 0% 10% 20% 30% 40% 50% % Ch an ge R e lativ e to B asel in e Case
Conventional NG vs. Gas/Diesel RNG vs. Gas/Diesel 17%
21
Figure 4.4 Gasoline and Diesel vs. Natural Gas GHG Emissions in Heavy-Duty Vehicles
HDDV - 2 4 6 8 10 12 14 16
2015 2020 2025 2030
GHG (M ill io n S h o rt to n s)
4.4a Gasoline & Diesel
HD Conv. NG HDDV 0 2 4 6 8 10 12 14 16
2015 2020 2025 2030 4.4b Conventional NG
HD RNG HDDV 0 2 4 6 8 10 12 14 16
2015 2020 2025 2030 4.4c Renewable NG
33 35 37 39 41 43 45 47 49 51 53
2015 2020 2025 2030
GHG (M ill io n s sh o rt to n
s) 4.4d GHG Emissions 2015-2030
Conventional NG Renewable NG Gas & Diesel 7%
15%
12%
25%
22
Diesel is the primary source of GHG emissions for HD vehicles (see Figure 4.4a) due to the sheer quantity of diesel vehicles in operation. As diesel and gasoline fuel are replaced with conventional and shale NG (see Figure 4.4b) or RNG (see Figure 4.4c), GHG emissions decrease over time. Relative to the baseline, RNG results in a 15 percent decrease of annual GHG
emissions in 2015, which increases to 25 percent by 2030. In contrast, conventional and shale NG result in only a 5 percent decrease in that same period (see Figure 4.4d).
23
Relative to the baseline, CO and VOC emissions increase as CNG consumption rise (see Figure 4.5a and Figure 4.5c). AFLEET vehicle emission factors for HD short-haul gasoline (SH-G) vehicles are much higher than those for CNG vehicles (see Figure 4.6a and Figure 4.6b). In this study, transit buses do not use gasoline and only 8.6 percent of single unit short haul trucks utilize gasoline. In contrast, 99 percent of transit buses and 90 percent of single unit SH trucks consume diesel11. Replacing diesel vehicles with CNG vehicles that have higher CO and VOC emission factors will result in higher CO and VOC emissions over time.
11 Heavy-duty vehicles that use other fuels such as liquid petroleum gas, propane, or ethanol are not included in this calculation. Figure 4.5 Air Pollutant Emissions – Natural Gas vs. Gasoline and Diesel
22 122 222 322 422 522 622 722
2015 2020 2025 2030
CO (M ill io n lb
s) Figure 4-5a
40 45 50 55 60
2015 2020 2025 2030
N Ox (M ill io n s lb
s) Figure 4-5b
20 25 30 35 40 45 50
2015 2020 2025 2030
VOC ( M ill io n s lb
s) Figure 4-5c
24
Figure 4.6 AFLEET Heavy-Duty CO Vehicle Emission Factors
Figure 4.7 AFLEET Heavy-Duty VOC Vehicle Emission Factors
0 10 20 30 40 50 60
1999 2004 2009 2014
SH-D SH-G BUS-D BUS-CNG
0 0.5 1 1.5 2 2.5
1999 2004 2009 2014
25 Electricity in Light-Duty Vehicles
Electricity and gasoline are used to fuel plug-in hybrid electric vehicles (PHEV). Sources and distributors of conventional electricity (CE) can be found in Appendix A. An inventory of renewable electricity (RE) can be found in Appendix B and is summarized in Table 4.5.
Table 4.5 Annual Transportation Energy of Renewable Electricity
Renewable Electricity * Energy (MMbtu) Electricity Fuel (GGE)
Medium to Large-scale Solar 6,500,000,000 21,000,000,000
Biomass 14,000,000 5,200,000
Offshore Wind 520,000,000 46,000
Hydropower 29,000 19,000
Total 7,000,000,000 21,000,000,000 * System losses are not included
The following assumptions are incorporated into the AFLEET model and statewide impact calculation:
1. Heavy-duty vehicle growth increases per the Baseline. 2. 27.5% of the electricity will be used for transportation.
3. The electricity mixes that are used to fuel PHEVs are shown in Appendix C, Table C.15. 4. PHEV passenger cars were registered in North Carolina starting 2010.
5. PHEV commercial trucks will enter the marketplace in 2015.
6. The PHEV adoption rates that are examined are shown in Figure 4.7.
26
level by 2030 is the moderate case. The quantities of PHEV passenger cars and PHEV commercial trucks used in the calculations can be found in Appendix D.
Low Adoption – 25% PHEV Adoption by 2030
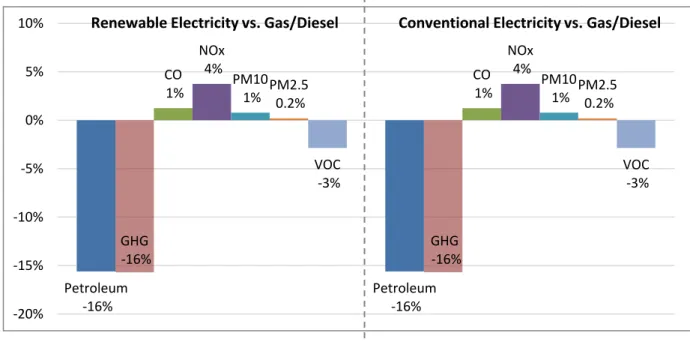
In the low adoption scenario, the results for RE and CE are indistinguishable and interchangeable12 (see Figure 4.8b and Figure 4.9). Theoretically, any difference in petroleum use or GHG emissions would most likely be due to the transportation of CE fuels to power plants. Furthermore, RE, which includes biomass generation, is only 22.3 percent of the total electricity generation mix. The remaining balance consists of residual oil, conventional and shale
NG, coal, and nuclear power (see Table C.15 in Appendix C). Relative to the baseline, this scenario results in 9 percent decrease in petroleum use in 2015 and a 23 percent decrease by 2030 (see Figure 4.8a). Utilizing electricity as a transportation fuel results in a total 16 percent reduction in petroleum consumption over 15 years. Relative to the baseline, this scenario results in a 9 percent decrease in GHGs in 2015 and a 23 percent decrease by 2030 (see Figure 4.10). Utilizing electricity as a transportation fuel results in a total 16 percent reduction in GHG emissions over 15 years.
12
27
Figure 4.8 Petroleum Consumption – Low PHEV Adoption
50 55 60 65 70 75 80 85 90
2015 2020 2025 2030
Pet ro le u m (M ill io n B ar re
ls) 4-8a: G/D vs. Electricity 9% 23% 50 55 60 65 70 75 80 85
2015 2020 2025 2030
Pet ro le u m (M ill io n B ar re
ls) 4-8b: Conventional vs. Renewable Electricity
Conventional Electricity Renewable Electricity
Figure 4.9 Comparing the AFLEET Outputs of Low PHEV Adoption to the Baseline
Petroleum -16% Petroleum -16% GHG -16% GHG -16% CO 1% CO 1% NOx 4% NOx 4% PM10 1% PM10 1% PM2.5 0.2% PM2.5 0.2% VOC -3% VOC -3% -20% -15% -10% -5% 0% 5%
28
Figure 4.10 Light-Duty GHG Emissions – Low PHEV Adoption
At the charging station, RE and CE are indistinguishable. PHEVs will emit the same quantity of air pollutants regardless of electricity source. Air pollutants emitted by PHEVs are due to gasoline consumption. As expected, PHEVs emit less air pollutants than gasoline and diesel vehicles before 2023. However, by 2023, CO, NOX, PM2.5, PM10, and VOCs emitted annually for gasoline, diesel, and PHEVs approach parity (see Figure 4.11) and may even emit more than gasoline and diesel vehicles. Three explanations may account for these results: (1) Older gasoline and diesel vehicles are decreasing as PHEVs13 increase. Therefore, less gasoline and diesel fuel is consumed overall and less air pollutants are emitted; (2) The fuel efficiency in gasoline and diesel vehicles has improved such that gasoline and diesel consumption is reduced significantly for newer vehicles in use as older vehicles retire; (3) Emission control equipment in
13 In 2023, PHEVs are only 13 percent of the total number of gasoline and diesel vehicles 0
10 20 30 40 50 60
2015 2020 2025 2030
GHG (M
ill
io
n
s
sh
o
rt
to
n
s)
29
gasoline and diesel vehicles has also improved such that less pollutants are emitted during operation14.
14
30 Figure 4.11 Air Pollutant Emissions – Low PHEV Adoption
0 100 200 300 400 500 600
2015 2020 2025 2030
CO (M ill io n s lb s) 0 10 20 30 40 50 60
2015 2020 2025 2030
N Ox (M ill io n s lb s) 0 5 10 15 20 25 30
2015 2020 2025 2030
VOC ( M ill io n lb s) 0 1000 2000 3000 4000 5000 6000 7000 8000
2015 2020 2025 2030
PM 10 (Th o u san d s l b s) 0 500 1000 1500 2000 2500 3000 3500
2015 2020 2025 2030
31 Moderate Adoption – 50% PHEV Adoption by 2030
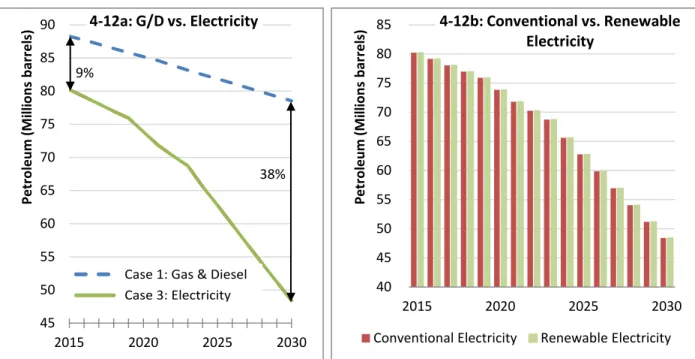
In the moderate adoption scenario, RE and CE are virtually indistinguishable and interchangeable in regards to petroleum consumption15 (see Figure 4.14 and Figure 4.12b). Relative to the baseline, this scenario results in a 9 percent decrease in petroleum use in 2015 and a 38 percent decrease by 2030 (see Figure 4.12a). Utilizing electricity as a transportation fuel results in a total 20 percent reduction in petroleum consumption over 15 years.
Figure 4.12 Petroleum Consumption – Moderate PHEV Adoption
Unlike the low adoption scenario, RE in the 50 percent scenario performs only
marginally better than CE, emitting 0.0003 percent less GHGs in 2015. However, this increases to 0.02 percent by 2030. Although this difference is insignificant, it is worth noting that as PHEV adoption levels increase, RE will continue to outperform CE16. Relative to the baseline, the
15 Actual calculations result in RE performing only marginally better than CE, consuming 0.0000024 percent less
petroleum in 2015. This increased to 0.00017 percent by 2030. However, this difference is insignificant.
16 If a 95 percent PHEV adoption level is achieved by 2030, RE outperforms CE, consuming 17 percent less
petroleum in 2015 relative to the baseline. In contrast, CE results in only a 10 percent reduction. However, by 2030, RE and CE perform similarly, reducing petroleum consumption by 66 percent relative to the baseline. From
2015-45 50 55 60 65 70 75 80 85 90
2015 2020 2025 2030
Pet ro le u m (M ill io n s b ar re ls)
4-12a: G/D vs. Electricity
9% 38% 40 45 50 55 60 65 70 75 80 85
2015 2020 2025 2030
Pet ro le u m (M ill io n s b ar re ls)
4-12b: Conventional vs. Renewable Electricity
32
moderate adoption scenario results in a 9 percent decrease in GHGs in 2015 and a 23 percent decrease by 2030 (see Figure 4.13). Utilizing electricity as a transportation fuel results in a total 16 percent reduction in GHG emissions over 15 years.
Figure 4.13 GHG Emissions – Moderate PHEV Adoption
2030, RE results in a total reduction of petroleum use and GHG emissions by 39 percent each. Over that same period, CE results in a 35 percent reduction in petroleum use and GHG emissions.
24 29 34 39 44 49 54
2015 2020 2025 2030
GHG (M
ill
io
n
s
lb
s)
33
Similar to the low adoption scenario, the CO, PM2.5, and PM10 levels for gasoline and diesel approach parity with electricity levels by 2023. However, unlike the low adoption
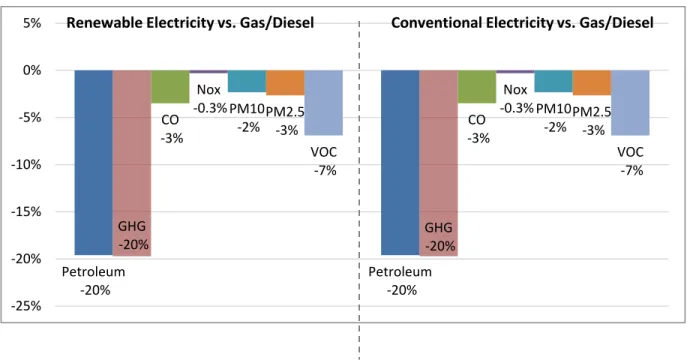
scenario, by 2026-2028, the CO, NOX, PM2.5, and PM10 levels for electricity begin to fall below the gasoline and diesel levels (see Figures 4.15a to Figure 4.15e). In this case, increased PHEVs are driving air pollutant reductions. PHEV adoption levels increase to 15 percent by 2023. However, by 2026, at a 30 percent adoption level, PHEVs begin to sharply outperform the Baseline. Additionally, VOC levels for electricity consistently stay below the baseline.
Figure 4.14 Comparing the AFLEET Outputs of Moderate PHEV Adoption to the Baseline
Petroleum -20%
Petroleum -20% GHG
-20%
GHG -20% CO
-3%
CO -3% Nox
-0.3%
Nox -0.3% PM10
-2%
PM10 -2% PM2.5
-3%
PM2.5 -3% VOC
-7%
VOC -7%
-25% -20% -15% -10% -5% 0%
34 Figure 4.15 Air Pollutant Emissions – Moderate PHEV Adoption
0 100 200 300 400 500 600
2015 2020 2025 2030
CO (M ill io n s lb
s) Figure 4-14a
0 10 20 30 40 50 60
2015 2020 2025 2030
N Ox (M ill io n s lb
s) Figure 4-14b
0 5 10 15 20 25 30
2015 2020 2025 2030
VOC (M ill io n s lb
s) Figure 4-14c
0 1000 2000 3000 4000 5000 6000 7000
2015 2020 2025 2030
PM 10 (Th o u san d s lb
s) Figure 4-14d
0 1000 2000 3000 4000 5000 6000 7000
2015 2020 2025 2030
PM 2.5 (Th o u san d s lb
s) Figure 4-14e
35 Light-duty PHEVs and Heavy-duty CNG Vehicles
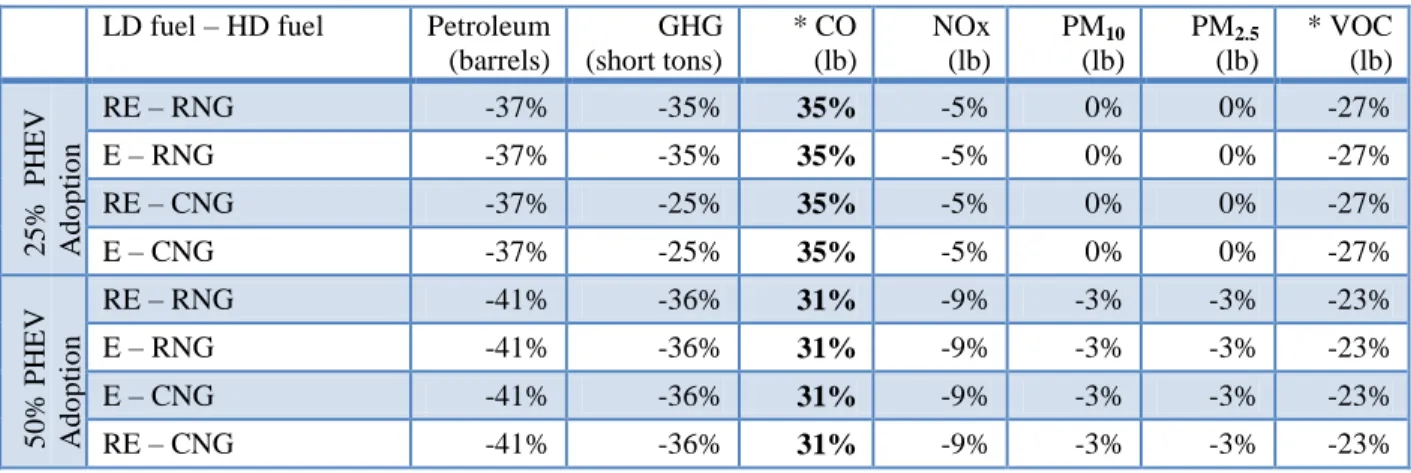
In reality, both LD and HD vehicles are replaced with their alternative fuel equivalents. This scenario models CNG in HD vehicles and the replacement of LD vehicles with PHEVs at 25 and 50 percent adoption levels by 2030 (see Table 4.8). The fuel source (i.e. conventional versus renewable) impacts the petroleum consumption and GHG emissions only. In contrast, the PHEV adoption levels impact petroleum use, GHG emissions, and air pollutant outputs. As PHEV adoption levels increase, the reduction in NOX, PM2.5, and PM10 also increases. All levels of PHEV adoption resulted in increases in CO and VOC, but the high adoption level results in the smallest increase.
At the low PHEV adoption level, petroleum use is unaffected by the use of RNG or conventional and shale NG. However, RNG does result in GHG emission levels that are 10 percent below conventional and shale NG. Unlike the low adoption level, both petroleum and GHG emissions are indifferent to the source of NG in the moderate adoption level scenario. Petroleum and GHG emissions are reduced by 41 and 36 percent, respectively relative to the baseline.
Table 4.8 Balanced Transition Scenarios and the Performance over the Baseline from 2015-2030
LD fuel – HD fuel Petroleum (barrels) GHG (short tons) * CO (lb) NOx (lb) PM10 (lb) PM2.5 (lb) * VOC (lb) 2 5 % PHEV Ad o p tio n
RE – RNG -37% -35% 35% -5% 0% 0% -27%
E – RNG -37% -35% 35% -5% 0% 0% -27%
RE – CNG -37% -25% 35% -5% 0% 0% -27%
E – CNG -37% -25% 35% -5% 0% 0% -27%
5 0 % PHE V Ad o p tio n
RE – RNG -41% -36% 31% -9% -3% -3% -23%
E – RNG -41% -36% 31% -9% -3% -3% -23%
E – CNG -41% -36% 31% -9% -3% -3% -23%
36
CHAPTER 5: RECOMMENDATIONS
There is an existing network of organizations including the Land-of-Sky Clean Vehicles Coalition, Triangle Clean Cities, Centralina Clean Fuels Coalition, and the North Carolina Clean Energy Technology Center that are currently promoting alternative fuels to stakeholders within the state. Local community colleges provide outreach events and alternative fuel vehicle maintenance training to local municipalities, utilities, private firms, and community members. State leaders can coordinate future efforts with these organizations to reduce redundancy and maximize available resources.
37
Table 5.1 Possible Scenarios and the Performance over the Baseline, 2015-2030
LD fuel – HD fuel Petroleum (barrels)
GHG (short tons)
CO (lb)
NOx (lb)
PM10 (lb)
PM2.5 (lb)
VOC (lb)
G/D – G/D 0% 0% 0% 0% 0% 0% 0%
G/D – CNG -21% -9% 34% -9% 0% 0% 30%
G/D – RNG -21% -19% 34% -9% 0% 0% 30%
2
5
% PHE
V
Ad
o
p
tio
n RE – G/D -16% -16% 1% 4% 1% 0% -3%
E – G/D -16% -16% 1% 4% 1% 0% -3%
RE – RNG -37% -35% 35% -5% 0% 0% 27%
E – RNG -37% -35% 35% -5% 0% 0% 27%
RE – CNG -37% -25% 35% -5% 0% 0% 27%
E – CNG -37% -25% 35% -5% 0% 0% 27%
All of the following recommendations require a minimum 25 percent PHEV adoption level by 2030. Expanding PHEV infrastructure would facilitate adoption. Fast-tracking permits for residential charging would reduce the installation cost and construction time. The National Electric Code requires the installation of exterior outlets in commercial properties. An effort to identify and engage willing commercial properties to allow for free destination charging17 and publishing this data would also increase potential charging locations. Local building codes could be modified to require the installation of electric vehicle charging capacity per living unit in newly constructed residential buildings.
Increase Energy Security
A decline in statewide petroleum consumption would increase energy security by reducing dependence on foreign oil and the flow of oil and natural gas via interstate pipelines. The last AFLEET scenario models a 25 percent PHEV adoption level by 2030 and the use of CNG in HD vehicles. Any of the options within this scenario would result in a 37 percent
decrease in petroleum use. The AFLEET results indicate that the differences between RE and CE
38
for petroleum consumption are insignificant. Likewise, the source of CNG will not impact petroleum consumption. Although RNG could be produced in North Carolina, a distribution pipeline network does not exist at present and the RNG would thus still need to be delivered via tanker truck.
Until a distribution network is built to retail locations or CNG production and processing sites (i.e. landfills, WWTPs, and CAFOs) become fuel distribution centers, it is unlikely that greater decreases in petroleum consumption can be achieved. Furthermore, due to stringent storage and safety requirements, the ownership and operation of CNG fueling stations will most likely remain with certified organizations, rather than the average individual.
Mitigate Climate Change
Focusing on decreasing GHG emissions may contribute to mitigating the effects of climate change. Integrating RNG vehicles and achieving a 25 percent PHEV adoption rate by 2030 would result in a 35 percent decrease in GHG emissions. However, RNG infrastructure is virtually nonexistent in North Carolina. Until this infrastructure can be built, utilizing
conventional and shale natural gas is an option, but would only result in a 25 percent decrease in GHG emissions.
Natural gas resources1819 in Western North Carolina are derived primarily from landfills and wastewater treatment facilities. However, methane collection systems require significant capital investment. Furthermore, projected population shifts from rural into urban areas will
18 Natural gas for electricity as a transportation fuel was not included in this study.
19 If natural gas is used for electricity, only approximately 42 percent of the input energy will be outputted as
39
affect the available human waste used in the production process. Deploying costly equipment to areas with projected population decreases by 2030 should be avoided.
Concentrated animal feeding operations (CAFOs) are located primarily in central and east North Carolina. There are two options to deploy methane collection systems on CAFOs: A centralized or decentralized system. The infrastructure for a centralized pipeline distribution network does not exist and will require extensive environmental studies and economic investment. It is unlikely that deployment would occur by 2030. A decentralized system for individual farms, evaluated on a case-by-case basis, may be deployed with greater logistical ease and speed, but the costs would fall on the individual farmer. Forming unique public/private partnerships, such as in the case of Loyd Ray Farms, may mitigate capital and maintenance costs.
Improve Air Quality
Reducing air pollutants (CO, NOX, PM2.5, PM10, and VOCs) would improve air quality. The AFLEET results indicate that a PHEV adoption level of 25 percent or greater and the continued use of gasoline and diesel in HD vehicles would result in the least increases in CO, NOX, PM2.5, and PM10 at 1, 4, 1, and 0 percent, respectively. VOCs would decrease by 3 percent. With 16 percent reductions in both petroleum use and GHG emissions, this option also provides the best overall strategy to increase energy security, mitigate climate change, and improve air quality.
40
operating in the state, thus speeding the transition. Furthermore, diesel infrastructure is well-established in North Carolina.
Manufacturers are largely responsible for providing a diverse selection of vehicles in the market place. As environmental regulations become increasingly stringent, manufacturers are investing in AFVs and advanced technologies20. The AFLEET results in Chapter 4 indicate that elevated levels of CO and VOCs are due to HD CNG vehicles. Lobbying for stricter emission control policies would require manufacturers to improve emission control technologies or fuel efficiency in these vehicles. PHEVs showed higher levels of some air pollutants. Mandating the installation of comparable emission control technologies to those installed in gasoline vehicles would reduce these emissions.
Land Use
Mid-sized21 to large-scale22 solar installations is approximately 90 percent of the total renewable energy capacity in North Carolina. However, population migration and increased urbanization may limit the available land for medium to large-scale solar projects23 (OSBM 2013). Statewide and regional land use planning should be expanded to include energy planning. Areas can also be set aside or acquired and zoned specifically for solar production.
Central North Carolina has ample renewable energy resources to support the integration of alternative transportation fuels. However, Eastern North Carolina lacks these resources.
20 Caterpillar Inc. spent $8 billion in R&D. This also includes an investment in EV and natural gas technology to
comply with Tier 4 Standards (Anderson 2013; Oberhelman 2014).
21
Mid-sized solar is defined as 1 MW – 4.9 MW (Johnson and Page 2014).
22 Large- or utility-scale solar is defined as greater than 5 MW (Mendelsohn et al. 2012).
23 Terando et al. (2014) predict that urbanization in the South is expected to increase by 101-192 percent in the next
41
Leaders in Eastern North Carolina may want to consider easing local regulations24 and appeal to the Bureau of Ocean Energy Management to reconsider their initial decision and expand the areas available for offshore wind production. Biomass resources are also abundant in this region. Increasing biomass electricity production could supplement offshore wind generation.
Western North Carolina has the least local energy resources and is the most dependent on imported feedstocks. Easing the restrictions of the Mountain Ridge Protection Act of 1983 to increase wind production in the Appalachian Mountains, the only onshore area in North Carolina with viable wind energy resources, should be considered. Similar to Eastern North Carolina, increasing biomass energy production may bridge the gap in renewable energy production. Wood feedstocks can be transported from Central or Eastern North Carolina.
AFLEET Model Limitations
The AFLEET model is limited by the quality of input data. The calculations for air pollution emissions are represented by 2012 certification data only and will not provide accurate results for older vehicles. To increase accuracy, equipment testing certification data would need to be entered into the calculation model. However, certification data for these vehicles may not exist.
The landfill gas option as a source for compressed natural gas (CNG) assumes that the CNG is transported via tanker truck for 50 miles to the refueling site. Mitigating this effect by reducing the miles travelled or assuming direct injection into the interstate natural gas pipeline is not an available input. Other sources of renewable compressed natural (RNG) gas such as
24 The Town of Kitty Hawk “approved a resolution to inform the North Carolina Bureau of Energy Management that
42
wastewater treatment plants (WWTPs) and concentrated animal feeding operations (CAFOs) are not provided as CNG source options.
The electricity mix proportions remain static for all years under consideration. Increasing the share of annual renewable electricity sources must be modeled separately. Similarly, the petroleum use and the GHG calculation factors for electricity production facilities also remain constant. RNG derived from landfills, WWTPs, and CAFOs can be used to generate electricity. However, RNG as an electricity feedstock is not an input option.
Renewable Energy Calculation Improvements
The RNG potential is based on the permitted capacity of each facility25. However, these facilities may not necessarily operate at full capacity from 2015-2030. Some landfills included in the scope may be full and producing methane per the calculations, but most of them are still accepting waste. CAFOs may want to operate at full capacity, but externalities (disease, operations, weather, etc.) may result in low methane collection levels. This study does not account for new landfills, WWTPs, or CAFOs that may become operational from 2015-2030 per the North Carolina Office of State Budget and Management (OSBM) population migration projections. Although expansions of existing CAFO lagoon facilities are not typically issued, this could change in the future.
The OSBM projects a population shift from rural to urban areas in North Carolina. Instead of calculating the energy potential based on facility capacity, a calculation based on wastewater and solid waste per capita per county might increase the accuracy of the results. Innovative funding strategies and improvements in technology might make micro-hydropower in
25 Permitted capacity may be less than or equal to design capacity. For example, a facility may be permitted for 80
43
the Piedmont river systems and coastal tidal areas feasible in the future. The area calculation for medium to large-scale solar farms might be further refined based on the minimum area
requirements for operational solar farm installations.
Conclusion
44 GLOSSARY
The definitions in this section were adapted from various sources (EERE 2013; EIA 2013a; USDA 2012; IRS 2011; Halderman and Martin 2011)
Advanced Technology Vehicles: A vehicle that combines new engine, power, or drive train
systems to significantly improve fuel economy. This includes hybrid power systems and fuel cells, as well as some specialized electric vehicles.
Alternative Fuel Vehicles: A dedicated, flexible fuel or dual-fuel vehicle designed to operate on
at least one alternative fuel.
Alternative Fuel: The Energy Policy Act of 1992 defines an alternative fuel as biodiesel (B100),
natural gas and liquid fuels domestically produced from natural gas, propane (liquefied petroleum gas), electricity, hydrogen, blends of 85% or more of methanol, denatured ethanol, and other alcohols with gasoline or other fuels, methanol, denatured ethanol, and other alcohols, coal-derived, domestically produced liquid fuels, fuels (other than alcohol) derived from
biological materials, P-Series fuels.
Alternative fuels: Per the Internal Revenue Service (IRS), alternative fuels that qualify for
45
Anaerobic digester: A vessel and associated heating and gas collection systems designed
specifically to contain biomass undergoing digestion and its associated microbially produced biogas.
Anaerobic digestion: A biological process in which microbes break down organic material in an
oxygen-free environment while producing biogas as a by-product.
Biodiesel: A fuel typically made from soybean, canola, or other vegetable oils; animal fats; and
recycled grease. It can serve as a substitute for petroleum-derived diesel or distillate fuel.
Biogas: The raw and un-cleaned gas produced by a digester, consisting of mainly methane
(50-60%), carbon dioxide (~40%), water vapor, and hydrogen sulfide.
Biomass: Organic, non-fossil material of biological origin constituting a renewable energy
source.
Biomass waste: Organic non-fossil material of biological origin that is a byproduct or a
discarded product. Biomass waste includes municipal solid waste from biogenic sources, landfill gas, sludge waste, agricultural crop byproducts, straw, and other biomass solids, liquids, and gases; but excludes wood and wood-derived fuels, biofuels feedstock, biodiesel, and fuel ethanol.
British Thermal Unit (Btu): The English System standard measure of heat energy. It takes one
Btu to raise the temperature of one pound of water by one degree Fahrenheit at sea level.
Carbon dioxide (CO2): A colorless, odorless, non-flammable gas found in biogas.
Co-generation: The process of producing both electricity and heat simultaneously, often referred
46
Combined Heat and Power (CHP): The sequential or simultaneous generation of two different
forms of useful energy – mechanical and thermal – from a single primary energy source in a single, integrated system. CHP systems usually consist of a prime mover, a generator, a heat recovery system, and electrical interconnections configured into an integrated whole.
Complete mix digester: An anaerobic vessel that is utilizes one or more mixing techniques.
Crop residues include crop stalks, leaves, and cobs, referred to as corn stover and wheat straw.
Corn stover has an energy content of 5,290 Btu/lb (wet) and 7,560 Btu/lb (dry). Wheat straw has an energy content of 5,470 Btu/lb (wet) and 6,840 Btu/lb (dry).
Distributed generation: A distributed generation system involves small amounts of generation
located on a utility’s distribution system for the purpose of meeting local (substation level) peak loads.
Electric Grid: The electric utility companies’ transmission and distribution system that links
power plants to customers through high power transmission line service; high voltage primary service for industrial applications; medium voltage primary service for commercial and industrial applications; and secondary service for commercial and residential customers.
Electrical Generation Capacity: The maximum technical full-load sustained output of an
electricity generating facility; actual output is usually lower. Capacity is measured in watts, kilowatts, or megawatts.
Electricity: Electric current used as a power source. Electricity can be produced from a variety