GENDER CONGRUENCY AND GENDER TRAJECTORY: PREDICTING TRANSGENDER DISCRIMINATION IN FOUR CONTEXTS
Jamie Lee O’Connor
A thesis submitted to the faculty at the University of North Carolina at Chapel Hill in partial fulfillment of the requirements for the degree of Master of Arts in the Department of Sociology.
Chapel Hill 2014
iii
ABSTRACT
Jamie O’Connor: Gender Congruency and Gender Trajectory: Predicting Transgender Discrimination in Four Contexts
(Under the Direction of Neal Caren)
The vast majority of studies on discrimination are confined to a single context. The transgender community is burgeoning in visibility and there is a dearth of large scale quantitative studies regarding this group. This study examines which facets related to being transgender best predict discrimination in four contexts: public accommodations, housing, the workplace, and school. Drawing from logistic regression of 4,175 cases from the National Transgender Discrimination Survey with independent variables that cluster around aesthetic gender congruency (whether a person’s appearance conforms with his/her identified gender) and gender trajectory (the direction of male to female or female to male), gender congruency best predicted discrimination in public accommodations, schools, and the workplace whereas gender trajectory, specifically going from male to female, best predicted housing discrimination. Gender congruency is more likely to take precedence over gender trajectory in
iv
ACKNOWLEDGEMENTS
v
TABLE OF CONTENTS
INTRODUCTION ... 1
LITERATURE REVIEW ... 4
Studies of Discrimination ... 4
Appearance Discrimination ... 7
Sex, Gender, and Gendered Behaviors ... 12
Other Proposed Predictors of Discrimination ... 19
Discrimination in Housing, Public Accommodations, School, and the Workplace .. 20
METHODOLOGY ... 22
Data ... 22
Measurement of Variables and Descriptive Statistics ... 23
Dependent Variables ... 23
Independent Variables ... 26
Control Variables ... 29
Analytic Techniques ... 32
vi
Crosstabs ... 34
Independent Variables ... 34
Control Variables ... 35
Logistic Regressions ... 37
Public Accommodations ... 37
School ... 38
Workplace ... 39
Housing ... 40
Summary ... 41
CONCLUSION ... 43
GLOSSARY OF TERMS ... 46
TABLES ... 47
GRAPHS ... 59
1
Introduction
Emerging from tabloid daytime talk shows of the 1980s and 1990s (Gamson 1999) to Vice President Joe Biden claiming that transgender discrimination is the “civil rights issue of our time” (Bendery 2012), the transgender community has come a long way from the fringes to now being the center of controversy in contentious politics. For example, the highly publicized “papers to pee” bill in Arizona would make any person going into a bathroom designated opposite to their assigned sex at birth a criminal act (Gardiner 2013). A California bill protecting transgender youth also has received similar social conservative backlash with the call for a referendum in the spirit of Proposition 8 (Skelton 2013).
2
Most studies of discrimination (e.g., race, gender, sexual orientation) are confined to a single context, such as the workplace (e.g., Pager, Western and Bonikowski 2009, Tilcsik 2011). Despite the wealth of information gained by focusing on the perspectives of the discriminated, the attitudes toward the marginalized from the discriminators, and in-depth case studies, few discrimination studies examine factors related to membership in the subjugated group (e.g., Gerhardstein and Anderson 2010, Verna et al. 2010). Furthermore, the vast majority of studies which try to take a more universal approach to discrimination collect data using more generalist questions which capture frequency, such as “Over the last year, how often have you been treated with less courtesy than others” (Cooper et al. 2012) and “How many times have people misunderstood your intentions and motives because you are Black?” (Barnes and Lightsey Jr. 2005). This study of transgender discrimination seeks to fill those gaps.
The study aims to answer whether gender trajectory (moving from male to female or vice versa, “assignment”) or gender congruency (visual conformity with self-identified gender, “embodiment”) take primacy in predicting discrimination in four specific settings: public accommodations (bathrooms, hospitals, airports, etc), housing, the workplace, and schools. Does gender trajectory or gender
3
4
Literature Review
Studies of Discrimination
Speculation on how individual factors affect discriminatory practice is greatly informed by social psychological theories and studies. In the realm of gender, the assumption of gender dimorphism is ubiquitous to the point that it is literally built into our structures in the form of legally designated gender-segregated spaces such as bathrooms and locker rooms (Cavanagh 2013). These assumptions are built upon normative conceptions of sexuality and gender, which are exclusionary and dependent on cisgender privilege (Cavanagh 2013). Cisgender privilege is often predicated on the supposed
authenticity (and thus superiority) of cisgender people’s gender performances. Goffman (1959) delineated the differences between “real” performances, which are ostensibly natural looking, and “inauthentic” performances, those that are seen as scripted. Because the known presence of transgender people challenge the assumed naturalness (and thus reality) of the gender binary, this creates a social crisis, facing actors to rethink “real” and “inauthentic.” When in social crisis, Goffman (1959) writes, people engage in “staging talk,” which can include team collusion: “communication which is carefully conveyed in such a way to cause no threat to the illusion that is being fostered for the audience.” In the transgender case, the illusion would be the naturalness and impermeability of the gender binary. Goffman (1959) also writes about the proclivities of actors to discriminate. Treatment of the absent derisive talk about other people is more unifying than complimentary talk.
Discriminatory interactions are far more dynamic than what the majority puts upon the
5
Work program, Hylton (2006), building upon Blumer’s definition of symbolic interactionism: “individuals bring to each social encounter a multitude of meanings that they derived from their histories of
interaction in society,” found that these women, through a lifetime of interacting within a society that condemns nonheterosexuality, assign specific meanings to certain social cues. These cues dictate which of the strategies minorities will use to mitigate or pre-empt discrimination such as truthful evasion, masking (small lies that mirror the truth), limiting contact with hostile forces, being visible to network with allies and prevent assumptions, and overachieving in other arenas to become less vulnerable to possible discrimination (Hylton 2006).
As a minority group grows in stature, societal pressure toward the majority group not to overtly discriminate against the minority also grows. (Jordan, Lovett, and Sweeton 2012) Individuals in the majority group may feel pressure not to accidentally come across as insensitive in interactions with minority groups. Often, the more someone interacts with someone from a specific group, the less nervous the person becomes while around that group (Jordan, Lovett, and Sweeton 2012). Walch et al.’s study on comparing lectures on transgender people with panels featuring transgender people illustrates this point as they found that interpersonal contact did a much better job in decreasing transphobia (2012).
Such negotiation is reflective of the concept of relational identities, as identities are understood not as inner essences or labels of one’s position but as claims for recognition which are contested, identities are constructed through relations of sameness and difference with others (Richardson 2010). As these symbolic boundaries are negotiated by social actors, categorizing objects, people, and
6
Bonikowski (2009), in their influential audit study on racial discrimination in a low-wage labor market, found that salient personalizing information from direct interactions can overcome stereotypes. However, when difficult to observe or ambiguously relevant characteristics are in play, employers will often use stereotypes. For example, employers in that study talked about how black men lacked “soft skills,” relating the stereotype a “ghetto” masculine black male to an inability to make others feel at ease.
Discrimination is a behavior that may be motivated by prejudice, stereotypes, and racism. However, these three alone cannot constitute discrimination (Pager and Shepherd 2008). To further illustrate this point, in a 2005 study, Pager and Quillian found discrepancies between the data found in an experimental audit study of entry level jobs and a telephone survey of the same employers featuring vignettes. Although in the survey, employers offered a greater willingness to hire ex-offenders and blacks, the results of the audit study demonstrated a large difference in callbacks in those categories with non-offenders and whites being heavily favored.
That study demonstrated the strengths and weaknesses of attitudinal surveys and audit studies. Attitudinal surveys can give insights on why an employer may discriminate, but even those which have an experimental design may not be sufficient in drawing conclusions about the actual level of hiring discrimination (Pager and Quillian 2005). However, an audit study may be more effective in measuring the effect of discrimination, but does not answer the social psychological reasons behind the
discriminatory practices. Conversely, from the perspective of marginalized groups, they often
7
may otherwise indicate. The number will indicate correlations and social psychological theories provide that explain these correlations.
Appearance Discrimination
Recent studies on comparative discrimination find that perceived appearance discrimination (based on height, weight, and physical attractiveness) is one of the most ubiquitous forms of
discrimination. Kuran and McCaffrey (2004) and Cavico, Muffler, and Mujtaba (2010) asked questions about whether a respondent felt discriminated against (and at what magnitude) in three different realms: economic status, ethnicity, and appearance. Although ethnicity and appearance is hard to untangle, both studies prefaced appearance questions by mentioning height and weight prior to asking about general appearance. Both studies found appearance discrimination to be more rampant than race-based discrimination. Furthermore, for those who stated that a specific factor of discrimination affects them “a great deal,” physical appearance trumps both economic status and ethnicity when it comes to perceived discrimination (Cavico, Muffler, and Mujtaba 2010). Kessler, Mickelson, and
Williams (1999), in their survey recording open ended answers to discriminatory experiences, found that various aspects of physical appearance was one of the most common reported, coming in third to race/ethnicity and gender.
The benefits of being attractive are also ubiquitous. In their dual studies featuring psychology and business students measuring job qualifications along with a photograph of the applicant, Johnson et al. (2010) found that physical attractiveness was universally favored in all types of jobs with one
exception, where attractive women were rated lower for masculine sex-typed jobs in which appearance is considered unimportant. In their study of court cases and laws regarding protection against
8
Arguably, keeping up appearance aside from aesthetics is a greater burden for many subjugated groups as they navigate through structures and institutions constructed by the powerful. Gould (1999), writing about racial discrimination, states that major institutions are built by the privileged and
structurally support the privileged; the subjugated group is generally less proficient at navigating the structure as compared to the dominant group. Gould, as well as Bielby (2000), found that stereotypes of groups influence hiring, especially in cases where the hiring protocol is less structured and more
arbitrary. Bobo and Fox (2003), looking into the social psychology of racism, find that the minority group has to be more vigilant on impression management in order to deflect stereotypes and create an aura of competency. Some stigmatized identities are not as apparent. In his conceptual framework about experienced discrimination by lesbians, gays, and bisexuals, Meyer (2003) found that concealing sexual orientation, if possible, may protect somewhat from heterosexual bias.
For transgender people, concealing their transgender status has a dual purpose of not only protecting the transgender individual from transphobic bias, but also the psychological benefit of having one’s gender identity publicly affirmed. Lombardi (2009), in her self-administered questionnaire sample of 90 transgender people, found a significant boost of self-esteem among those whose gender identity was publically affirmed. Conversely, Walch et al. (2012) observed that transgender people feel a major pressure to pass as cisgender (living as the assigned sex at birth) and become invisible to avoid stigma and discrimination. Schrock, Holden, and Reid (2004), in their participant observation study of a
transgender support group, similarly found a major focus in the group on passing as cisgender in public. Furthermore, Carroll and Gilroy (2002) find that there is pressure from counselors for transgender people to self-identify and present as closely to one side of the gender binary (male-female).
9
these (gender) enactments runs so deeply into the organization of society as to deny any slighting view of them. Gender expressions are by way of being a mere show; but a considerable amount of the substance of society is enrolled in the staging of it.” Cultural beliefs about the sanctity of gender binarism naturalize a sex/gender/sexuality system in which heterosexuality (as defined by gender assigned at birth) is positioned as the only natural and desired form. In cases of visible gender ambiguity, an interactional breakdown may ensue (Westbrook and Schilt 2014). In a theatre reenactment of her book “Queering Bathrooms: Gender, Sexuality, and the Hygenic Imagination,” Cavanagh (2013) found that some of the lesbian, gay, and bisexual cisgender people in the audience were unsettled by the transgender characters: “Still others could not relax and enjoy the show until their confusions about the gender identities of the characters were alleviated.” Cavanagh also claims that “transsexuality (physical changes) promises to make the transsexual unremarkable, but autobiography reinforces the
remarkability” (2003). Case in point, an FTM reported that since his body began to align with his
masculine presentation, he presented a less controversial gender spectacle and lessened the amount of “gender trouble” (Connell 2010.) Dewaele et al. found that LGB youth used visibility management as a coping strategy for discrimination: using specific mannerisms, gender-non conformist behaviors, and other indirect cues to make themselves visible or invisible (2013). However for gender non-congruent transgender people (or genderqueer people), their mere appearance is a representation of their remarkability and no amount of visibility management can hide it.
10
Pressures to fulfill obligations to obtain and maintain transgender related medical care can force transgender people into awkward and possibly dangerous situations. Dewaele et al. found that LGB youth used visibility management as a coping strategy for discrimination: using specific mannerisms, gender-non conformist behaviors, and other indirect cues to make themselves visible or invisible (2013). For those who are not gender congruent in appearance, they have no choice in the matter on visibility as a transgender person. Carroll and Gilroy (2002) found that there is much controversy in the current WPATH (World Professional Association for Transgender Health) standards of care for transgender people to undergo the “real life test,” living as the “opposite” assigned sex at birth for over a year before the counselor signs off on any surgery. The argument against the mandatory year wait is that it makes visibly transgender people more vulnerable to hate crimes and social ostracism. Clements-Nolle, Marx, and Katz (2008) found in their study of 515 transgender youth that visible gender non-conformity is linked to elevated rates of attempted suicide. In their studies of transgender women of color, Wilson et al. (2009) and Sugano, Nemoto, and Operario (2005) found that those who do not appear cisgender are more likely to face economic hardship and engage in risky behavior.
Transgender-related medical treatment, such as cross-sex hormones and various surgeries, can confer the ability for a transgender person to get their gender identity affirmed in public. However, access to treatments as well as their efficacy varies. Edwards-Leeper and Spack (2012), two physicians who treat transgender youth, lamented about a major socioeconomic divide in their patients, who are overwhelmingly middle and upper middle class. Grossman and D’Augelli (2007), in their study of young transgender women of color, also found poor access to physical health services as a significant
contributor of the group’s vulnerability.
11
undergraduates featuring vignettes of transgender people, including a picture. Some faces were gender congruent (the MTF looking more typically feminine, FTM more masculine) and others were not (MTF with masculine face, FTM with feminine face). Via eigenvalues, the transsexual was evaluated on three factors: general evaluations, mental health evaluation, and an evaluation of attractiveness and likability. Although they found that physical attractiveness is important in general, across the board the students gave more favorable evaluations in all categories to those with gender congruent faces. However, comparing MTFs with FTMs, the evaluations for FTMs were generally more positive, furthering the idea that there are more acceptable bodies, and in this case, facial types for males as opposed to females.
Although these studies connect a general concept of appearing cisgender and related discrimination, none explicitly link levels of aesthetic gender congruency with reported instances of discrimination. This study will not only fill this gap, but also will analyze specific factors linked to whether a transgender person looks physically congruent with his or her identified gender, such as the age at which medical transition began, visible medical treatments (hormones, top surgery, and facial surgery), and genital surgeries. I theorize that these medical interventions will account for a significant portion of the magnitude of the general gender congruency measure. In the model focusing on appearance, I offer these hypotheses.
Hypothesis 1a: Respondents who are not visibly identifiable as transgender will be less likely to
report discriminatory experiences in all contexts.
Hypothesis 1b: Respondents who have medically transitioned earlier in life will be less likely to
report discriminatory experiences in all contexts.
Hypothesis 1c: Respondents who have undergone more visible medical treatments (e.g.
12 Sex, Gender, and Gendered Behaviors
There is much overlap between sex, gender, and gendered behaviors in the realm of appearance discrimination. However, the differentiation in these realms between those who are transmasculine (assigned female at birth but are transitioning in a male trajectory) and transfeminine (assigned male at birth but are transitioning in a female trajectory) are vast to the point where gender trajectory needs its own analysis and model.
The masculinist bias is pervasive in American society. In an experimental survey of people in business school, Trentham and Larwood (1998) found that men, those who are usually in powerful positions in firms, tend to have stronger gender preferences in general, especially in favor of other men. In addition, men and women alike have fear from above as motivation to accept discriminatory
practices, whether boss or client. This reflects the Rational Bias Theory: “rationally choosing to discriminate as a consequence of particular attributional and instrumental conditions” (Trentham and Larwood 1998). Heterosexual men in general will often discriminate against those who threaten to weaken male hegemony (such as gay men and transgender women) through demonstrating the fragility of ascribed masculinity among males. However, many heterosexual males have sentiments which run counter to gendered expectations on behavior and feel pressure to hide those feelings and behaviors to avoid sanction from their peers (Richardson 2010; Choplin 2011). Cisgender heterosexual men also feel anxiety about gendered expectations, lest they lose their privileged position in the gender hierarchy. (Richardson 2010; Choplin 2011)
13
one woman used the word “fag” in reference to a client she had a difficult time working with, knocking his demeanor down in order to bring her status back up. Tilcsik (2011), in an audit study of job
applications including a mention of having a leadership position in a LGBT organization versus a leadership position at the “Progressive and Socialist Alliance,” chosen since the politics were less mainstream and to control for liberal bias in favor of gays, found that jobs which typically have more traditional ideas of masculinity were less likely to offer callbacks to openly gay applicants. Furthermore, a callback gap still remained for jobs which didn’t have strong heterosexual male values, suggesting an internalization of the values of the dominant group. On the flipside, however, Tilcsik found that although there is a wage penalty for gay men, there is a wage premium for lesbians, indicating an association between lesbianism and masculinity and the exaltation of masculinity. Black et al. (2004) has similar findings but has a specialization argument: lesbians obtain more education as they are less likely to have children than heterosexual women and to make up for having a two female household income. Klawitter and Flatt (1998) buttress this statement with their findings that although individual lesbians make more money than individual heterosexual women, lesbians still lag behind all men on an individual basis and lesbian couples have the smallest income of any sort of couple (comparing heterosexual couples and gay male couples). Perhaps this is more indicative of the primacy of male status being followed by perceived masculinity/femininity.
The primacy of masculinity is certainly not exclusively American and starts well beyond
14
Stotzer (2008), in her examination of 49 transgender related hate crimes in Los Angeles County, found that men were almost universally the perpetrators and that MTFs were almost universally the victims.
There are a few studies which find no difference in violence and suicide attempts between MTFs and FTMs (Clements-Nolle, Marx, and Katz 2008; Lombardi et al. 2008) and, in one case, undergraduate male psychology students were more willing to work with MTFs than FTMs (Carroll et al. 2012). In constrast, the vast majority of transgender discrimination is aimed toward the transfeminine (Grossman and D’Augelli 2007). Stotzer (2008) found that among her sample of 49 transgender related hate crimes, all the victims were MTF except one. Why do MTFs get the brunt of transgender discrimination? First of all, gender imperatives are harsher for those culturally read as boys and men than girls and women. (Carroll et al. 2012) Thus, an MTF who may be physically read as male will receive stronger reprisals for expressing her female gender identity than an FTM who may be physically read as female would for expressing his male gender identity. Second, a gendered logic in supremacy would indicate that a gender normative transgender man would be moving up in the gender order whereas transgender women move down (Connell 2010).
15
attractiveness to worth, not only of herself but projecting the same objectification upon other women (Puvia and Vaes 2013). Considering that transgender people, especially visibly transgender people, are more susceptible to gender accountability in order to have their gender identity validated, transgender women are more likely to internalize and act upon self-objectification. Wilson et al. (2009) found in a previous sample of MTFs that 50% were financially compromised to the point that they engaged in sex work. Furthermore, transgender women have the burden of being framed as “evil deceivers” (Bettcher 2007), those who try to lure heterosexual men into “homosexual” acts. Schilt and Westbrook (2009), in their study of newspaper reports of murdered transgender women, noticed that there was little respect for the transgender woman identity, often framing her as a “transvestite” or a “male dresses as a woman” who deceived a heterosexual man who went on a violent rage in reaction, despite that many of these men purposely seek out pre-operative transgender women. The most telling quote comes from a police officer about a murder of a transgender woman: “Some of these transvestites look sexier than women; I can see how someone could be surprised.” However, transgender women who have been murdered who were post-operative were not framed as deceivers.
Schilt and Westbrook (2009) argue that the way transgender people are discriminated against is gendered. The existence of transgender women are a threat to heteronormativity and the male
heteronormative response is usually violence, to reassert a sense of masculinity which has perceived to be compromised by being “tricked into homosexuality” and thus femininity. The existence of
16
Furthermore, due to the belief that women are inherently vulnerable and men are dangerous, women’s spaces are central to the debate over transgender rights. Westbrook and Schilt (2014) find that people in gender integrated spaces are less likely to scrutinize each other’s gender identities and that gender segregated spaces are more prone to gender policing based on biological markers. Specifically, biological validation of gender is more likely to be accepted if the individual is penis free. Those who possess a penis, according to heteronomative logic, desire female bodies and are willing to use force to get access to that body. Thus, transgender women with genital surgery are no longer seen as a threat and transgender men without genital surgery never were a threat.
17
entrepreneurial teams, gender stereotypes of leaders pervasively constrain women’s access to power positions. A telling example of this phenomenon featured an-all male business partnership where one of the partners transitioned to female. She was told in a meeting “How can you expect to run a company when all you’re going to be thinking about is nail polish?” (Schilt and Connell 2007)
Schilt speculates that physical gender congruency may have played a large role in this outcome, but also she mentions the case of a transgender woman who looked congruently female, but was fired from her job when her employer found out about her past. Although Lombardi et al. (2008) found no difference in the rate of violence toward FTMs (female-to-male) and MTFs (male-to-female), the vast majority of studies find that MTFs get the brunt of discrimination and have a more difficult time passing as cisgender. Lombardi (2009), in her own questionnaire study, found that the FTM respondents reported being affirmed as a male in public more often than MTF respondents reported being affirmed as a female in public. Factor and Rothblum (2008), in their sample of 168 transgender adults, found that although MTF respondents identified themselves as the other sex earlier than FTMs, they transition an average of 7 years later than FTMs. They also found that the cultural idealization of masculinity
18
This is illustrative of the differential effects of estrogen and testosterone on the human body. Schilt (2010), in her in-depth study of transgender men in the workplace, found that transgender men were publically confirmed as their preferred gender far more often than transgender women. Schilt credited this not only to the wider range of acceptable body types for males, but also that testosterone confers more visible changes to the body than estrogen. This is a boon for transgender men and a burden for transgender women, who on average transition later in life and thus typically have masculine secondary sexual characteristics which are harder to soften without surgery. Furthermore, Schilt found that the masculine appearance of transgender men often overrode identification documents which label them as female. Furthermore, satisfied with being affirmed as male in public as well as the usually unsatisfactory results of surgeries to create a penis, few trans men have had “bottom surgery” or plan on obtaining the surgery.
Although sex, gender, and gendered behaviors encompasses both individual factors of discrimination (gender congruency) and interactional discrimination (attitudes of gender rigidity), it is clear from the vast majority of the literature that transgender women are far more victimized than transgender men on both accounts. What this literature is missing are the parts which create this whole. Are there cultural beliefs about an inherent abominable nature of an assigned male abandoning such an exalted role (and the relative understanding of an assigned female striving to be a better person via masculinity)? Is it a function of visual gender congruency, which is more easily conferred to transgender men? I offer this hypothesis:
Hypothesis 2: Those assigned male at birth (MTF, male genderqueers) will be more likely to
19 Other Proposed Predictors of Discrimination
Previous studies have demonstrated that transgender people receive discrimination on the basis of two other factors specific to being transgender. Gehi and Arkles (2007), in their literature review on the intersections of race and class in transgender discrimination, found that a discrepancy in gender presentation from the gender on official identification documents makes it difficult for transgender people to work, travel, and make purchases. Lombardi (2008) found that being “out” about transgender status to more people is correlated with increased discrimination.
Many of the studies done on working class transgender youth, transgender youth of color, and transgender youth involved in sex work predominantly featured a sample of young transgender women who were black or Hispanic. (Grossman and D’Augelli 2007; Sugano, Nemoto, and Operario 2005; Wilson et al. 2009). Gehi and Arkles (2007), Lombardi (2008), and Stotzer (2008) all found that transgender women of color receive more discrimination than transgender whites and Asians. Black transgender women are also far more likely to be the victims of a violent crime. Furthermore, Schilt (2009) and Dozier (2005), find that the beneficial returns transgender men get from being seen as male in public is attenuated for transgender men of color as well as Asians.
Conley (1999) found that socioeconomic status have a much greater impact in predicting discrimination outcomes than skin color or ethnicity. Furthermore, Baker-Kimmons and McFarland (2011), through an examination of masculinity in popular rap lyrics, find that black and Hispanic
20
Rothblum (2008) find that transgender people in general have higher educational attainment than the non-transgender population. However, their sample was heavily white.
In a survey study of heterosexism, Swank, Fahs, and Frost (2013) found that there is more discrimination against homosexuals in areas that are rural, poor, and have a high concentration of people of collor. Furthermore, they found less discrimination in regions with a smaller presence of evangelical Christians. Tilcsik (2011) also found that there were geographic differences in the levels of discrimination against gay men which reflect regional differences in attitudes and anti-discrimination laws. Given that there is a strong correlation between homophobia and transphobia (Costa and Davies 2012), one would be expect these findings to hold toward transgender discrimination.
Discrimination in Housing, Public Accommodations, Schools, and the Workplace
Besides the workplace, there is little research on discrimination against transgender and LGB people in housing and schools. Cobb (2009) found that gay discrimination in public accommodations as well as housing demonstrate that discrimination is contingent upon qualities of the landlord or business owner, primarily adherence to a conservative brand of religion, rather than qualities of the gay
21
2010; Gutierrez 2008; Buddel 2011). Because hiring managers and others who have the power to make executive decisions (such as a landlord) often rely on stereotypes when other pertinent information is hard to grasp, this finding could well apply toward housing.
The current findings on transgender people, GLB people, and other minority groups demonstrate mixed results in whether gender trajectory or gender congruency take primacy in the transgender case; there is ample evidence for both arguments in all four contexts. I would argue that places in which the decision about “who belongs” is more dispersed (public places such as schools and public accommodations), gender congruency, being a visible representative of breaking the taken for granted gender binary, would be the prime predictor. In places where there are few people making decisions about who belongs, such as housing (landlords) and the workplace (management), I argue that gender trajectory would be the prime predictor, considering that many of these positions are held by men with interests in upholding heterosexual male privilege.
Hypothesis 3a: Effects of Visual gender congruency will best predict reported discrimination in public accommodations and schools.
22
Methodology
Data
The National Transgender Discrimination Survey (NTDS) was a project conducted jointly by the National Gay and Lesbian Task Force (NGLTF) and the National Center for Transgender Equality (NCTE) in late 2007 and early 2008. (Grant et al. 2011) Both organizations reached out to more than 800
transgender community-based organizations in the United States and 150 active transgender
community listservs. The vast majority of the respondents completed the 70-question survey online. In addition, both organizations distributed 2,000 paper surveys to organizations serving harder to reach transgender people, including those while live rural areas and the homeless. The effort resulted from 500 surveys with a total of 6,456 valid responses from the 50 states, the District of Columbia, Puerto Rico, Guam, and the U.S. Virgin Islands. The population is not a random sample; at this point, achieving a random sample of a small and still much stigmatized population is impossible.
The NTDS took an inclusive approach to the category “transgender,”: transsexuals, genderqueer people, cross-dressers, the androgynous, and other gender non-conformists. For the purposes of this study, I focused on four populations of people who have adopted a core gender identity contrary to their sexual assignment at birth: binary-identified transgender people (those assigned male at birth who identify as woman/female and those assigned female at birth who identity as man/male) and
23 Measurement of Variables and Descriptive Statistics
Dependent Variables
The dependent variable is “reported perceived discrimination” in four contexts: public
accommodations (e.g. retail stores, airports, and bathrooms), housing, the workplace, and school. Each variable is a binary variable with “1” indicating that the respondent reported experiencing discrimination in at least one of the contexts presented in the survey, and a “0” for the respondent responding “never experiencing discrimination” in the context.
The four contexts were chosen as they emerged to be the key independent clusters in which the survey goes further in-depth with specific instances inside the contexts. There were other clusters in the survey such as engagement with the police and homelessness. However, these areas were captured within the subtexts of the public accommodation and housing discrimination questions, so they are subsumed by those categories, respectively, in this study. Table 1 represents the percentage of the respondents reporting discrimination in each situation. The majority of eligible respondents reported discrimination in public accommodations (67%), the workplace (73%), and school (62%). Housing
discrimination was the least prevalent form of discrimination of the four measured contexts with 43% of eligible respondents reporting discrimination in that sector. Places where respondents are more likely to interact with people more frequently have higher reports of discrimination.
The binary dependent variable measuring reported discrimination in schools is rather
24
The other three binary dependent variables are constructed composite variables. The public accommodation discrimination binary is based on this question: “Based on being transgender/gender non-conforming, please check whether you have experienced any of the following in these public spaces.” The public spaces listed are: retail store, hotel or restaurant, bus/train/taxi, airplane or airport staff/TSA, doctor’s office or hospital, emergency room, rape crisis center, domestic violence
shelter/program, mental health clinic, drug treatment program, ambulance or EMT, government agency/official, police officer, judge or court official, and legal service clinic. The possible answers are: denied equal treatment or service, verbally harassed or disrespected, physically attacked or insulted, not applicable: I have not tried to access this, not applicable: I do not present as transgender here, not applicable: I did not experience these negative outcomes. For each public space, I created categories for yes (denied equal treatment or service, verbally harassed or disrespected, physically attacked or
25
(3%). These three categories had the highest number of “not applicable” responses, all at 60%. The percentage range for not applicable responses was 8%-60%. Here, frequency of subcontext seems to be linked with likelihood of reporting discrimination in that context.
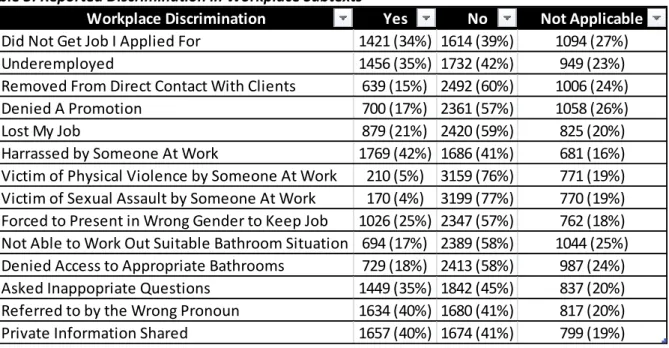
The working discrimination binary is based on this question: “Because of being
transgender/gender non-conforming, which of the following experiences have you had at work? Please mark each row.” The situations are: I did not get a job I applied for because of being transgender or gender non-conforming; I am or have been unemployed, that is working in the field I should not be in or a position for which I am over-qualified; I was removed from direct contact with
clients/customers/patients; I was denied a promotion; I lost my job; I was harassed by someone at work; I was the victim of physical violence by someone at work; I was the victim of sexual assault by someone at work; I was forced to present in the wrong gender to keep my job; I was not able to work out a suitable bathroom situation with my employer; I was denied access to appropriate bathrooms; I was asked inappropriate questions about my transgender or surgical status; I was referred to by the wrong pronoun repeatedly and on purpose; and supervisors or coworkers shared information about me that they should not have. The answers for each are: yes, no, and not applicable. The working discrimination binary has anyone who said yes to one of the contexts counting as reported discrimination in the workplace, and anyone who has all no and/or not applicable answers count as not reporting
26
keep job” at 18% and several others tied at 19%. The percentage range for not applicable responses was 16%-27%. Here, as in public accommodation discrimination, less “severe” forms of discriminations tend to be the most common.
The housing discrimination binary is based on the question: “Because you are
transgender/gender non-conforming, have you experienced any of the following housing situations? Please mark ‘Not Applicable’ if you were never in a position to experience such a housing situation. For example, if you have always owned your home as a transgender/gender non-conforming person, you could have not been evicted.” The answers for each are: yes, no, and not applicable. The housing discrimination binary has anyone who said yes to one of the contexts counting as reporting housing discrimination and anyone who has all no and/or not applicable answers count as not reporting housing discrimination. Table 4 displays the eight subtexts which make up the housing discrimination variable and the number of respondents who answered yes, no, or not applicable for each subtext. In parallel with public accommodation, the three categories with the highest percentage of yes answers included: I moved into a less expensive home/apt. (28%), I had to move back in with family/friends (18%), and I had to find temporary places to sleep (18%). These items also had the lowest “not applicable” percentages, all at 32%. The percentage range for not applicable answers for housing discrimination are consistently higher than workplace discrimination, with the range being 32%-45%. Within the subtexts, there isn’t a great range in the frequency of a possible encounter, but the less “severe” consequences are the most prevalent.
Independent Variables
27
never). Respondents who state that people, the majority of the time, can tell they are transgender are hypothesized to be more likely to report discrimination. Gender congruency is also hypothesized to be a stronger indicator of discrimination for public accommodations and schools. Table 5 represents the responses to the “people can tell I am transgender/non-conforming” visual congruency question. 51% of respondents in the sample are at the highest ends of the congruency scale, “occasionally” and “never.” 23% of respondents are at the lowest end, “always” and “most of the time.”
Three visible medical transgender treatments will be independent dummy variables: hormones, chest surgery (mastectomy for transmasculine, breast augmentation for transfeminine), and facial surgery (to mitigate any facial features which are coded masculine or feminine). Facial surgery is measured by a recoded variable called “facial” which was included in the NTDS. The question it was recoded from was “please tell us how much the following procedures have cost if you have had them, or mark the box that says I have NOT had this procedure.” Hormones and chest surgery variables were created from the following question “Please mark below if you received health care related to being transgender/gender non-conforming.” Those who answered “have had it” are counted for taking hormones and having had chest surgery. Table 6 features the percentages of respondents who have gotten visible transgender related medical treatments. Hormones, used to induce a puberty of the identified gender, is the only treatment used by the majority of respondents at 69%. 26% of respondents have had chest surgery and 11% of respondents have had facial surgery.
The variable “ftmhidden” and “mtfhidden” are dummy variables constructed from the question “Please mark below if you have received health care related to being transgender/gender
female-28
to-male hysterectomy (removal of the uterus and/or ovaries), female-to-male genital surgery (clitoral release/metatoidoplasty/creation of testes), or female-to-male phalloplasty (creation of a penis) counted as having a “hidden” FTM procedure. Table 7 features the percentages of respondents who have undergone genital and reproductive surgeries, which is more common in transfeminine
respondents (MTF and MGQ) with 30% responding that they have had such surgery as opposed to 16% of transmasculine repondents (FTM and FGQ).
The variable “age starting medical transition” was constructed from a subcontext of question 8 in the NTDS: “Age that you first got any kind of transgender-related medical treatment.” Respondents were asked to write in the age in years. The variable was originally a text variable within the dataset. The easily defined numerical values were substituted instead of words and those with an unclear age
statement (e.g., 1999, middle age) were treated as missing. Table 8 represents the age at which those who received transgender-related medical care started treatment. The majority of respondents began treatment at ages 18-24 (29%) and 25-34 (26%). The extremes of the age distribution had the lowest percentage of respondents with 0-17 at 4% an 55+ at 5%. In between are the age ranges of 35-44 (20%) and 45-54 (16%). Table 9 demonstrates the percentiles for age beginning medical transition and the age of the respondents, with 30 being the median age of medical transition and 32 being the median age of respondent. Amongst the percentile measures, the difference between age beginning medical transition and age of respondent does not go above 5 years.
29
score two are given a value of one indicating yes and those who scored one or less received a value of zero indicating no. Similar procedures were done for the other three gender categories. Genderqueer status was determined through the question, “For each term listed, please select to what degree it applies to you.” Those who strongly identified with the term genderqueer were counted as
genderqueer. Table 10 represents the gender makeup of the respondents. Binary-identifed transgender people are the majority as 1854 respondents are MTF and 1036 are FTM. Genderqueer identity is far more prevalent in those assigned female at birth as FGQs outnumber MGQs 732 to 231. A few identified with the gender binary and with the term genderqueer: there are 128 genderqueer-identified MTFs and 194 genderqueer-identified FTMs.
Control Variables
30
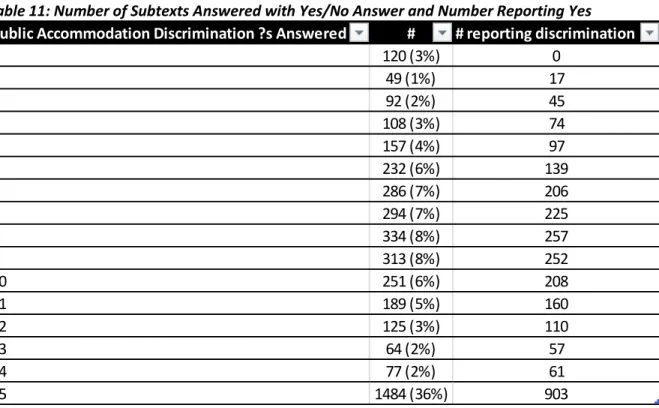
Table 13 displays how many of the housing discrimination subtexts questions were answered. 46% of respondents answered all 8 questions whereas 22% answered none of the questions. 32% of
respondents answered between 1 and 7 questions, the majority of which reported at least one incidence of discrimination.
The control variable of race was created from the question, “What is your race/ethnicity (Mark all that apply),” with the choices white, black, Hispanic, Asian/Pacific Islander, Native American,
Arab/Middle Eastern, and multiracial. Each race will be a dummy variable with white being the reference category. Table 14 is the racial makeup of the respondents. Respondents were allowed to choose more than one race category. 4059 respondents claimed white ancestry whereas 411 are multiracial, 324 are Hispanic, and 298 are black.
The variable of income was created from the question “What is your current gross annual household income?” with options going from less than $10,000 to $10,000 in ten thousand dollar brackets followed by brackets from $100,000 to $250,000 in $50,000 increments. The highest bracket was “more than $250,000.” The variable was modified to account for income in thousands of dollars, in this case, represented by the midpoint in each income bracket. Table 15 features the income bracket distribution of the sample. 30% of the sample makes under $20,000 whereas 11% make over $100,000. The majority of the sample (59%) make between $20,000 and $99,999.
31
of respondents have no college background whereas 48% of respondents have at least a bachelor’s degree.
Both urban/rural and region was determined by zip codes. The makers of the NTDS recoded the variable to determine the respondent’s region and whether they were “urban” or “rural” using the RUCA system. The independent variable of rural/urban is a binary variable with urban being the reference category. Table 18 shows that the vast majority of respondents live in urban areas (91%). Region was constructed featuring: New England, Mid-Atlantic, South, Mid-west, California, and West (including Alaska and Hawaii). The regions will be treated as dummy variables where California will be the reference category. Table 17 represents regional makeup with the Mid-Atlantic and Midwest areas representing 20% of the sample each with New England having the smallest representation at 9%.
The control variable of being out or not about one’s transgender status was constructed from two questions. First, “I tell people that I’m transgender/gender non-conforming (Mark all that apply.)” with the possible selections being never, people who are close friends, casual friends, work colleagues, family, and everyone. The second question is, “How many people know or believe you are
32
out” is the reference category. Table 19 indicates that 65% of the sample are generally out about their transgender status.
The question on IDs and legal documents on the survey was, “Thinking about all your IDs and records, which of the following statements is most true.” The answer options are: all of my IDs and records list the gender I prefer, some of my IDs and records list the gender I prefer, none of my IDs and records list the gender I prefer. I will use this as a dummy variable with the “all of my IDs and records list the gender I prefer” as the reference category. Table 20 shows that 19% of respondents have their preferred gender on all of their legal documents whereas 35% have some listing preferred gender and 46% have no documents listing preferred gender. In many states, genital (or chest surgery) is a requirement to have a birth certificate or Social Security card gender marker changed. Consider how infrequent surgical intervention is in this sample, this could explain why very few have all their documents listing their preferred gender.
Because the effect of transgender status has been demonstrated to vary by race (Dozier 2005; Schilt 2010) there will be interaction dummy variables between MTF status and each individual race (e.g. interaction between black and MTF status). Once again, white will be the reference category.
Analytic Techniques
I will first present the descriptive statistics on all variables used in the study. The descriptive statistics for the independent and the control variables will further elaborate on the compositional makeup of the sample, which is especially important considering the sample is non-random. In addition, the descriptive statistics on the dependent variables will not only tell us how prevalent discrimination toward transgender people is in each greater context, but also will reveal the prevalence of
33
Second, I will analyze bivariate data. The bivariate table will feature each independent and control variable crosstabulated with each of the four dependent variables, illustrating general trends in what facets are most correlated with a greater likelihood to report discrimination in a specific context.
34
Findings
Crosstabs
Independent Variables
Table 21 represents the percentage who reported discrimination in a context based on their level of gender congruency. In line with Hypothesis 1a, public accommodations discrimination decreases with increase in gender congruency and school accommodations follows that trend with the exception of 60% of those who responded that people can never tell they are transgender reporting discrimination opposed to 56% of “occasionally” respondents reporting discrimination.
Table 22 displays the percentage who reported discrimination in a context based on whether or not they have had specific transgender medical care treatments. Contrary to the expectations of Hypothesis 1b, only in schools do respondents with medical intervention fare better than those without medical intervention. In Table 23, the less visible genital and reproductive surgeries mirror this finding as schools are again the only place where those with medical intervention fare better than those without.
Table 24 features the percentage who reported discrimination in a context by age beginning medical transition. Contrary to the expectations of Hypothesis 1c, there is no clear pattern
35
discrimination in public accommodations. Housing discrimination is fairly uniform between 47%-48 for ages 0-54 whereas those transitioning at 55 and older only being discriminated 33% of the time. The only sector where those 55 and older are not the least discriminated against is in the workplace, where 18-24 year olds report a 58% rate of discrimination, which is 8 percentage points lower than the next lowest category, 55 and older.
Table 25 displays percentage reporting discrimination in each context by gender trajectory. The results run counter to Hypothesis 2 for the most part. Only housing is where transfeminine individuals (MTF: 53% MTFGQ: 47% MGQ: 36%) report more discrimination than transmasculine individuals (FTM: 35% FTMGQ: 35% FGQ: 33%). In public accommodations the opposite is true as transmasculine individuals (FTM: 68% FTMGQ: 75% FGQ: 73%) report more discrimination than transfeminine individuals (MTF: 66% MTFGQ: 62% MGQ: 55%). Those who are genderqueer without any binary identification are less likely to experience discrimination (MGQ: 64% FGQ: 69%) than those who identify to a degree as male or female (72-74%). The opposite is true in schools where those who identify in the binary to some degree (MTF: 53% FTM: 64% MTFGQ: 58% FTMGQ: 67%) are less likely to experience discrimination than those who do not (MGQ: 76% FGQ 69%)
Control Variables
36
between those making less than $10,000 and those making between $10,000-19,999. In the next income bracket, discrimination returns to a descending order.
Table 28 features discrimination by whether the respondents official identification documents list their preferred gender. Discrepancies appear to be correlated with reporting discrimination as those with some of their documents listing preferred gender reported the most discrimination in public accommodations (72%), housing (50%), and the workplace (78%). Those with none of their ID
documents listing preferred gender reported the most discrimination in schools (65%).Table 29, which features discrimination in each context by educational attainment, presents two different patterns. For public accommodations and the workplace, the more education the respondent attains, the more likely the respondent will experience discrimination. In contrast, the less education a respondent attains, the more likely the respondent will experience discrimination in the realms of housing and school (with a slight uptick between those with no high school degree and those with a high school degree in schools. However, the descending trend continues again starting with some college).
There are few emergent patterns in Table 30, which features discrimination in each context by region. The Mid-Atlantic region had the lowest rates of discrimination for public accommodation (65%), the workplace (67%), and school (58%). The Mid-Atlantic also had the second lowest rate of
discrimination in housing (41%). Table 31, which is discrimination in each context by rural/urban, also does not feature many discernable patterns. The greatest gulf between the two categories was in the realm of public accommodation, where only three percentage points (Urban: 68% Rural 65%) were the difference.
37
Public accommodation had the biggest difference between the two categories (70% to 62%), followed by workplace (75% to 69%), school (63% to 59%), and housing (44% to 42%).
Logistic Regressions
Public Accommodations
Table 33 presents the results of the logistic regression of public accommodation discrimination. Model 1 is a bivariate logistic regression featuring the gender congruency question “people can tell I’m trans.” Gender congruency appears to have an inverse relationship with discrimination. In Model2, I add other variables which I theorize that contribute to gender congruency. Despite the variables being added, the main gender congruency measure in itself is still significant and meaningful. Model 3 is a bivariate logistic regression featuring the gender trajectory measure. Model 3 predicts less
discrimination for genderqueers assigned male at birth (.596) and more discrimination for genderqueers assigned female at birth (.728). Model 4 includes both gender congruency and gender trajectory
38
counterparts (.686). Multiracial respondents were more likely to experience discrimination (.82) than those who did not respondent as multiracial (.68). Income also was a significant predictor of
discrimination as those with a higher income were less likely to report discrimination (see Graph 1).
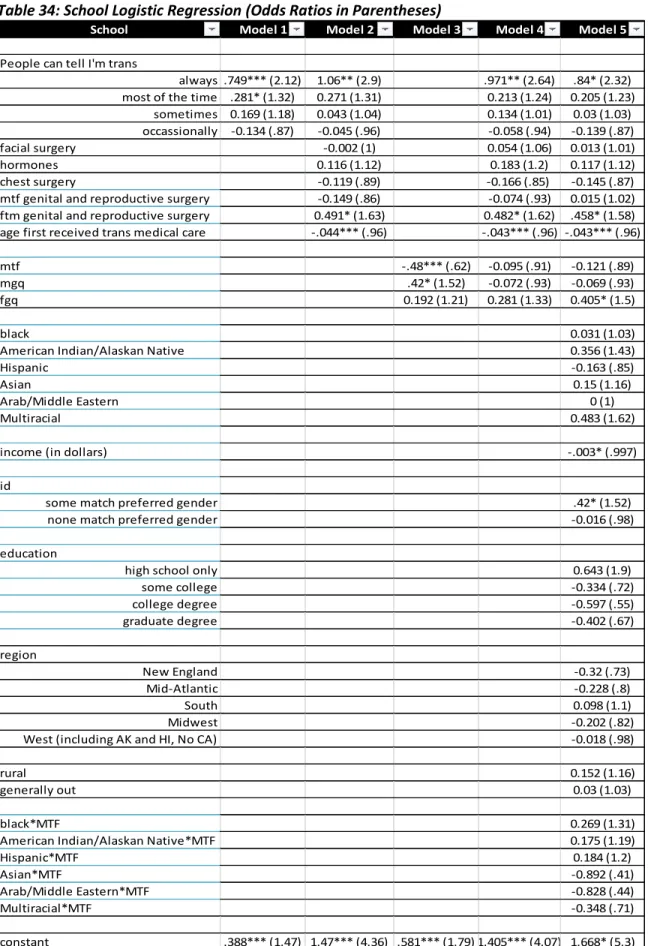
School
39
Hypothesis 2 is not supported as transfeminine gender trajectories were not statistically significant. Conversely, female assigned at birth genderqueers are more likely to experience discrimination at school (.659) compared to all others (573). The only control variables that were significant were income in thousands of dollars (See Graph 3) and legal IDs. Those with some of their identity documents
matching preferred gender (.634) experienced a greater likelihood for discrimination compared to those who had all match (.543) and those who had none match (.54).
Workplace
Table 35 features the logistic regression for workplace discrimination. Model 1 features the bivariate logistic regression with the gender congruency measure as a dummy variable with the highest gender congruency category, “never,” as the reference category. With the exception of the “always” category, gender congruency has a statistically significant inverse relationship with discrimination: as gender congruency goes up, discrimination goes down. Model 2 includes the medical intervention variables, none of which were statistically significant. Model 3 features the bivariate logistic regression with gender trajectory as a dummy variable. MTFs are more likely to experience discrimination per this model. Model 4 includes gender congruency, medical intervention, and gender trajectory variables. Only the gender congruency measure remains statistically significant. Model 5 is the complete model
40
supported as gender trajectory is not statistically significant. The statistically significant control variables were multiracial status (.848; not multiracial: .758), income in thousands of dollars (see graph 4), and ID status (all: .718, some: .766, none: .785).
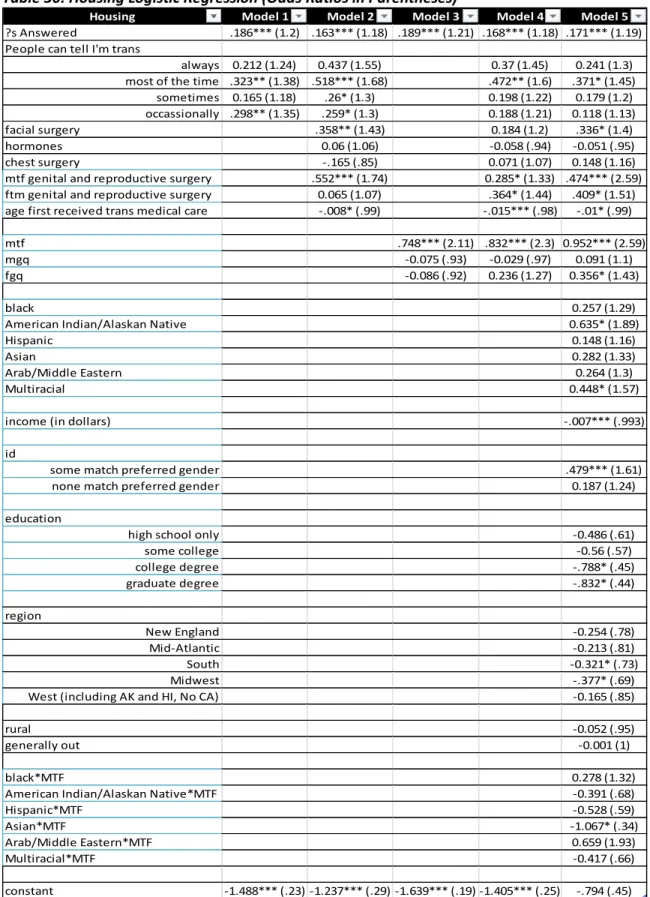
Housing
Table 36 features the logistic regression for housing discrimination. Model 1 features the gender congruency variables. Whereas “most of the time” (.46) and “occassionally” (.454) are statistically significant, “always” (.435) and “sometimes” (.424) are not, thus creating no discernable pattern. Model 2 includes the medical intervention variables. With the addition of these variables, a pattern emerges in gender congruency, demonstrating a greater likelihood of discrimination for those with less gender congruency. Having had facial surgery (.527, no surgery: .445), MTF genital/reproductive surgery (.557, no surgery: .431), and medically transitioning at a younger age are all correlated with a higher likelihood of discrimination. Model 3 features gender trajectory and only MTF likelihood of discrimination is statistically significant (.52) and greater than all others (.354). Model 4 includes gender congruency, medical intervention, and gender trajectory variables. “Sometimes” and “occasionally” in the gender congruency is measure is no longer statistically significant whereas MTF genital/reproductive surgery (.507, no surgery: .443), age first receiving transgender medical care, and MTF status (.537, all others: .351) still remain significant. Model 5 includes all variables. Hypothesis 1a was not supported as the only statistically significant category for gender congruency, “most of the time,” is in the middle of the measure and thus there is no discernable pattern. Hypothesis 1b was not supported: facial surgery, the only statistically significant visible medical intervention measure, was correlated with a greater
41
(.343). Among the statistically significant control variables, American Indian/Alaskan Native (.582, Not AI/AN: .448) and multiracial status (.544, not multiracial: .448) were correlated with a greater likelihood of discrimination whereas Asian MTFs (.379) were less likely to experience discrimination compared to non-MTF Asians (.403) and non-Asian MTFs (.548). Those with greater income (see graph 6) were also less likely to experience discrimination. Those who have gender discrepancies in their IDs (.496) are more likely to experience discrimination compared to those who don’t (all: .394 none: .439). Those with a college degree (.431) and those with a graduate degree (.422) are less likely to experience
discrimination compared to lower educational attainments (.48-.598). Those living in the South (.437) and the Midwest (.425) are less likely to experience discrimination compared to other regions (.451-.505).
Summary
42
Hypothesis 2, “Those assigned male at birth (MTF, male genderqueers) will be more likely to report discrimination than those assigned female at birth (FTM, female genderqueers) in all contexts,” was primarily not supported. The only context in which the hypothesis held up was in housing, where MTFs experienced the greatest chance for discrimination. In public accommodations and schools, female assigned at birth genderqueers were more likely to experience discrimination. In the workplace, the gender trajectory category was not statistically significant.
Hypothesis 3a, “Effects of Visual gender congruency will best predict reported discrimination in public accommodations and schools,” was fully supported, gender congruency was a primary predictor of discrimination for both public accommodations and schools. Hypothesis 3b, “Effects of Gender trajectory, namely that those assigned male at birth (MTF, male genderqueers) will more likely report discrimination than those assigned female at birth (FTM, female genderqueers), will best predict reported discrimination in housing and in the workplace,” was partially supported as gender trajectory, specifically transitioning from male to female, was a primary predictor of housing discrimination whereas gender congruency was a primary predictor of discrimination in the workplace.
43
Conclusion
This study finds variation across the experiences of discrimination of a marginalized group in different contexts. The raw percentages of reported discrimination were markedly different for each of the four contexts. Furthermore, the impact of factors related to the marginalized
(transgender/genderqueer) status as well as control variables fluctuated among the different contexts.
This study also empirically shows the importance of studying appearance discrimination. Level of gender congruency was one of the prime predictors of discrimination in three contexts: public accommodations, schools, and the workplace. Gender trajectory was only a prime predictor in housing discrimination. Furthermore, in comparison to all the variables used in the models, only income was as strong and pervasive of a predictor of discrimination as physical appearance; the former was statistically significant in all contexts and had the same correlation: the more money a respondent makes, the less likely the respondent will report discrimination.
44
The unexpected findings also offer sociological questions for future studies. Why are
transgender people who have undergone hormone treatments, chest surgery, and facial surgery more likely to face discrimination if gender congruency is a major factor? Are those who undergo such surgery more likely to be around the same social or professional circle before and after treatments? Perhaps discriminatory experiences may encourage transgender people to undergo transgender-related medical treatments to avoid further discrimination. Is discrimination toward younger medical transitioners more a function of youthful vulnerability, considering the strong correlation between age of respondent and age at which medical transition begins?
The NTDS is a groundbreaking survey. It is the first large scale survey featuring the transgender community, and it was set up in a way that allows researchers to compare discrimination in several contexts. The NTDS offers a strong prototype for future surveys of marginalized people to ask questions about discrimination in specific contexts and replicate studies such as this one. However, since the survey is the first of its kind, there are many ways that the survey could improve. The survey could use more questions about how often the respondent goes out in public or how many customers she engages with at work to better control for frequency of potential discrimination situations. Within the realm of work, future surveys should ask what specific occupation the respondent is in. Considering how gendered spaces at work and the policing of them are central components of prior studies (Connell 2010; Schilt 2010; Schilt and Connell 2007; Schilt and Westbrook 2009; Westbrook and Schilt 2014), learning about the gendered nature of the workplace would help us further understand the reasons behind the correlations.
45
and Operario 2005). The next iteration should have questions about what sort of support groups each transgender person has looked for or found, whether they have contact with other transgender people, and which people does the respondent spend the most time with (e.g., friends, family, co-workers) ,where they know them from, and what sorts of activities they do. Social support has been centrally linked to transgender discrimination (Grossman and D’Augelli 2007) and more data is needed on this aspect beyond simple outcomes of social relationships (e.g. lost custody of child, lost a close friend due to transition).
Finally, considering the strong correlation between age or respondent and age of medical transition, there is a huge portion of the transgender community missing: those who have transitioned 5 or more years ago. The next iteration of the NTDS should make a greater effort to reach out to
46
Glossary of Terms
Cisgender: Those whose gender identity more or less match with the one assigned at birth (not to be confused with discomfort caused by gendered behavior expectations)
FGQ: Shorthand for a genderqueer person who was assigned female at birth
FTM: Shorthand for female to male transsexual, binary-identified
Genderqueer: a gender identity that is not male or female, this can be androgyny or genderlessness.
Gender binary: Male and female, often employed with assumption that there are no places in between
Gender congruency: How one’s physical and verbal cues match cultural gendered expectations.
Gender trajectory: Direction in which a transgender person is transitioning toward (transmasculine, transfeminine)
Medical transition: The administering of hormone and/or surgical treatment to bring body in alignment with person’s gender identity.
Metatoidoplasty: A technique of creating a penis in a transmasculine person
MGQ: Shorthand for a genderqueer person who was assigned male at birth
MTF: Shorthand for male to female transsexual, binary-identified
Oophorectomy: Surgical removal of ovaries
Orchiectomy: Surgical removal of testicles
Stealth: A transgender person blending into society passing as cisgender.
Transfeminine: Transitioning away from a male assignment at birth. This can include male to female transsexuals and genderqueers.
47
Table 1: Percentages Reporting Discrimination in Four Contexts
Table 2: Reported Discrimination in Public Accommodation Subtexts
Table 3: Reported Discrimination in Workplace Subtexts
Have you ever been discriminated Yes No Total Public accommodations 2811 (67%) 1364 (33%) 4175
Housing 1755 (43%) 2297 (57%) 4052
Workplace 2897 (73%) 1083 (27%) 3980
School 1454 (62%) 891 (38%) 2345
Public Accommodation Discrimination Yes No Not Applicable
Retail Store 1752 (43%) 1983 (49%) 344 (8%)
Hotel/Restaurant 1196 (30%) 2372 (59%) 476 (12%)
Bus/Train/Taxi 852 (21%) 2409 (60%) 752 (19%)
Airplane/TSA 661 (16%) 2409 (59%) 1028 (25%)
Doctor/Hospital 1349 (33%) 2216 (55%) 484 (12%)
Emergency Room 620 (16%) 1966 (49%) 1441 (36%)
Rape Crisis Center 110 (3%) 1503 (37%) 2406 (60%)
Domestic Violence Shelter 138 (3%) 1480 (37%) 2399 (60%)
Mental Health Clinic 493 (12%) 2116 (53%) 1411 (35%)
Drug Treatment Programs 78 (2%) 1510 (38%) 2424 (60%)
Ambulance/EMT 188 (5%) 1687 (42%) 2142 (53%)
Government Agency/Official 960 (24%) 1875 (47%) 1185 (29%)
Police Officer 1026 (25%) 1822 (45%) 1183 (29%)
Judge/Court Official 497 (12%) 2163 (54%) 1359 (34%)
Legal Services Clinic 223 (6%) 1781 (45%) 1991 (50%)
Workplace Discrimination Yes No Not Applicable
Did Not Get Job I Applied For 1421 (34%) 1614 (39%) 1094 (27%)
Underemployed 1456 (35%) 1732 (42%) 949 (23%)
Removed From Direct Contact With Clients 639 (15%) 2492 (60%) 1006 (24%)
Denied A Promotion 700 (17%) 2361 (57%) 1058 (26%)
Lost My Job 879 (21%) 2420 (59%) 825 (20%)
Harrassed by Someone At Work 1769 (42%) 1686 (41%) 681 (16%)
Victim of Physical Violence by Someone At Work 210 (5%) 3159 (76%) 771 (19%) Victim of Sexual Assault by Someone At Work 170 (4%) 3199 (77%) 770 (19%) Forced to Present in Wrong Gender to Keep Job 1026 (25%) 2347 (57%) 762 (18%) Not Able to Work Out Suitable Bathroom Situation 694 (17%) 2389 (58%) 1044 (25%) Denied Access to Appropriate Bathrooms 729 (18%) 2413 (58%) 987 (24%)
Asked Inappopriate Questions 1449 (35%) 1842 (45%) 837 (20%)
Referred to by the Wrong Pronoun 1634 (40%) 1680 (41%) 817 (20%)