In
fl
uence of neighbourhood
socioeconomic position on the transition
to type II diabetes in older Mexican
Americans: the Sacramento Area
Longitudinal Study on Aging
Lorena Garcia,1Anne Lee,2Adina Zeki Al Hazzouri,3John M Neuhaus,2 Sally Moyce,1Allison Aiello,4Tali Elfassy,3Mary N Haan2
To cite:Garcia L, Lee A, Zeki Al Hazzouri A,et al. Influence of neighbourhood
socioeconomic position on the transition to type II diabetes in older Mexican Americans: the Sacramento Area Longitudinal Study on Aging.BMJ Open2016;6: e010905. doi:10.1136/ bmjopen-2015-010905
▸ Prepublication history for this paper is available online. To view these files please visit the journal online (http://dx.doi.org/10.1136/ bmjopen-2015-010905).
Received 18 December 2015 Revised 11 April 2016 Accepted 26 April 2016
For numbered affiliations see end of article.
Correspondence to Dr Lorena Garcia; [email protected]
ABSTRACT
Objective:To examine the influence of
neighbourhood socioeconomic position (NSEP) on development of diabetes over time.
Design:A longitudinal cohort study.
Setting:The data reported were from the Sacramento Area Latino Study on Aging, a longitudinal study of the health of 1789 older Latinos.
Participants:Community-dwelling older Mexican Americans residing in the Sacramento Metropolitan Statistical Area.
Main outcome:Multistate Markov regression were used to model transitions through four possible states over time: 1=normal; 2=pre-diabetic; 3=diabetic; and 4=death without diabetes.
Results:At baseline, nearly 50% were non-diabetic, 17.5% were pre-diabetic and nearly 33% were diabetic. At the end of follow-up, there were a total of 824 people with type 2 diabetes. In a fully adjusted MSM regression model, among non-diabetics, higher NSEP was not associated with a transition to pre-diabetes. Among non-diabetics, higher NSEP was associated with an increased risk of diabetes (HR=1.66, 95% CI 1.14 to 2.42) and decreased risk of death without diabetes (HR: 0.56, 95% CI 0.33 to 0.96). Among pre-diabetics, higher NSEP was significantly associated with a transition to non-diabetic status (HR: 1.22, 95% CI 0.99 to 1.50). Adjusting for BMI, age, education, physical activity, smoking, alcohol consumption, medical insurance and nativity did not affect this relationship.
Conclusions:Our findings show that high NSEP poses higher risk of progression from normal to diabetes compared with a lower risk of death without diabetes. This work presents a possibility that these associations are modified by nativity or culture.
INTRODUCTION
Research into the effects of the community context on individual health outcomes
reveals that neighbourhood socioeconomic position (NSEP) is a risk factor for chronic disease.1–3 Lower NSEP has been associated with increased risk of diabetes1 2 and its related complications, including cardiovascu-lar disease,2 chronic kidney disease4and all-cause mortality.5 Research shows that these conditions disproportionately affect minori-ties, including adults.1 6Neighbourhood and individual cultural factors may influence the progression to type 2 diabetes. Some work has suggested that residence in a majority
Strengths and limitations of this study
▪ Our study adds to the body of literature on older Latinos, neighbourhood socioeconomic position (NSEP) and diabetes status. If in the next four decades Latinos become the largest ethnic minority in the USA, then understanding the roles that NSEP and cultural change play in the prevention of pre-diabetes and diabetes and its health-related costs and complications is vital.
▪ Data are from a longitudinal cohort study of physical and cognitive impairment and cardio-vascular diseases in community-dwelling older Mexican Americans residing in Sacramento Metropolitan Statistical Area.
▪ Three levels of data were used for this data ana-lysis, where individuals were nested within neighbourhoods over time. We had neighbourhood-level and individual-level data. The analysis accounted for sociodemographic and health/behavioural variables.
Hispanic neighbourhood is protective for diabetes, obesity and other health outcomes.7 8 This same work has reported that foreign-born Mexican Americans may experience better health outcomes compared with US born, even when accounting for neighbourhood cultural and sociodemographic characteristics.
The development and progression of adult onset type 2 diabetes is influenced by an accumulation of beha-viours and exposures over a lifetime, including many factors linked to neighbourhoods, such as the availability of recreational opportunities, access to fresh fruits and vegetables, and social support networks.6 9 10 Successful management of diabetes is influenced by access to medical care and behavioural risk factor modification. Despite recommendations from the American Diabetes Association,11 many patients with diabetes are initially managed without medication.12 Individual socio-economic status (SES) and NSEP are associated with access to medical insurance and medical care.13 In add-ition, neighbourhoods with low SEP tend to have lower density of stores selling fresh produce6 as well as less space for recreational activities.9 This may result in higher rates of obesity and, subsequently, higher rates of diabetes.2Therefore, through access to a healthful envir-onment and access to medical care, NSEP is an import-ant component of prevention and management of diabetes.
Our objective was to examine the relationship between NSEP and transitions to diabetes status over time in cohort of Latino older adults, while accounting for indi-vidual social, health and behavioural characteristics. We hypothesised that Latinos living in higher NSEP neigh-bourhoods would be less likely to transition into worse dia-betes states than Latinos in lower NSEP neighbourhoods.
METHODS Study participants
Participants were from the Sacramento Area Latino Study on Aging (SALSA), a longitudinal cohort study of physical and cognitive impairment and cardiovascular diseases in community-dwelling older Mexican Americans residing in Sacramento Metropolitan Statistical Area.14 Recruitment occurred between 1998 and 1999 and included 1789 parti-cipants between the ages of 60 and 101 years at baseline. Every 12–15 months, interviews, biological and clinical data were collected on participants during in-home visits, with a maximum of six follow-ups to 2008. The Institutional Review Boards (IRB) at the University of Michigan, University of North Carolina, the University of California, San Francisco and the University of California, Davis approved the SALSA study and along with the prin-ciples of the Declaration of Helsinki. All participants pro-vided appropriate informed consent annually.
We excluded 12 participants with missing baseline dia-betes status or who lived in a neighbourhood with NSEP score that is an outlier (NSEP score ≤10), yielding a
final sample size of 1777 participants.
Study variables
Three levels of data were used for this data analysis where individuals were nested within neighbourhoods over time.
Individual-level data
Assessment of type 2 diabetes and pre-diabetes status: We defined diabetes as meeting any of the following criteria in semiannual follow-up interviews or annual laboratory examinations: (1) self-report of a physician’s diagnosis of diabetes, (2) fasting blood glucose level of ≥126 mg/dL, (3) usage of diabetes medication (insulin or oral hypo-glycaemic agent) or (4) diabetes listed as a cause of death anywhere on a death certificate, provided the death occurred within the study period.15 Pre-diabetes was ascertained by a fasting blood glucose level between 100 and 125 mg/dL.
Assessment of other clinical and biological data:During the baseline examination, trained interviewers measured study participants’ standing height and weight; body mass index (BMI; kg/m2), was calculated as weight/ height2. Participants reported the number of hours per week they engaged in certain physical activities (eg, doing yard work, heavy housework and walking around neighbourhood). These were combined into a physical activity summary score and used as a continuous variable to facilitate convergence.
Assessment of sociodemographics: At baseline, demo-graphic characteristics of participants were collected based on self-report, including age, health insurance, has a doctor, any alcohol consumption, any smoking, acculturation16 and nativity (born in Mexico/other Latin American country or the USA).
Assessment of individual-level SEP measures: Several individual-level SEP factors were also measured at base-line. Each participant self-reported years of education completed, gross past-month household income and major lifetime occupation. We created a variable that grouped gross past month household income into low (<$1500) and high (≥$1500) categories, and another variable that categorised participant’s occupation as manual, non-manual or other (a category that included housewives, the unemployed).
Neighbourhood-level data
variable included six variables: the percentage of indivi-duals 25 years of age or older, without a high school diploma; the percentage of the population living below the poverty line; the percentage of individuals≥16 years of age who at one time had been in the workforce and who were unemployed; the percentage of households that owned their home, percentage of housing units that were vacant; and the median number of rooms in the household. Higher NSEP scores indicated higher neigh-bourhood socioeconomic status. Further details on the statistical methods resulting in the NSEP score have been published elsewhere.20 We also created the Hispanic Isolation Index (HII) which is defined as the average percentage of the study population that is Hispanic in a neighbourhood.14 We categorised the HII into quartiles.
Statistical analysis
We compared baseline covariates by baseline diabetes status. We used analysis of variance (ANOVA) to compare the means of continuous variables and χ2tests to compare the frequencies of categorical variables.
We used Multistate Markov models21 to model each participant’s transitions between four possible states over time: 1=normal; 2=pre-diabetic; 3=diabetic; and 4=death without diabetes. Multistate Markov models describe the associations of covariates with probabilities of state transi-tions using hazard rates and assume that the hazard rates are independent of which states were previously occupied and the time spent in the current state. Our models permitted the following transitions: from normal to pre-diabetic, normal to diabetic, normal to death without diabetes, pre-diabetic to normal, pre-diabetic to diabetic and pre-diabetic to death without diabetes. We assumed that the diabetic and death without diabetes states were absorbing (final state). We fit a series of Multistate Markov models to the data by the method of maximum likelihood.
Model 1 included just the main predictor of interest, NSEP score (in units of IQR, IQR=7). Model 2 adds adjustment for other individual-level factors, including baseline BMI, baseline age, years of education, physical activity, smoking status, any alcohol consumption, medical insurance and nativity. HRs for each transition along with their 95% CI were estimated for each transi-tion adjusted for covariates.
All analyses were performed using SAS V.9.4 and the msm package in R V.3.1.1.22 All statistical tests were two sided and p<0.05 was considered statistically significant.
RESULTS
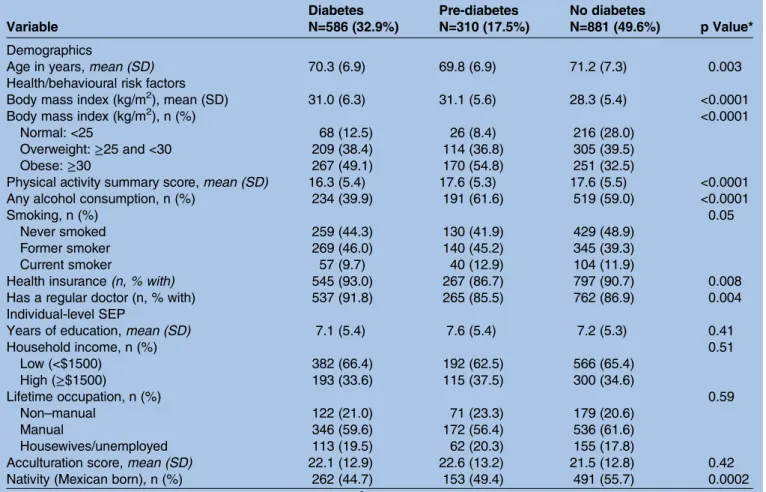
At baseline, while the majority of participants did not have diabetes (49.6%), the prevalence of diabetes (33%) and pre-diabetes (17.5%) was high (table 1). At baseline, there were 586 cases of type 2 diabetes and 310 diabetes cases. Follow-up data on diabetes and pre-diabetes were available through June 2008, with a total
of 205 incident diabetes cases and 824 incident pre-diabetes cases. Diabetes status was significantly associated with older age, higher BMI and lower physical activity. Compared with non-diabetics, those with diabetes were more likely to have health insurance and a regular doctor. Mexican born were less likely to have diabetes than the US born. Diabetics were less likely to drink alcohol. Acculturation, years of education, household income and occupation did not differ by diabetes status.
Association between NSEP and diabetes transitions
Table 2shows the distribution of the number of pants by quartile of the NSEP. The majority of partici-pants (75.8%) fell into the two lowest quartiles. Also shown is the distribution of the number of transitions by NSEP quartile. In total, 40% of the transitions from normal to pre-diabetes, 37% of normal to diabetes tran-sitions, 52.5% of transitions from normal to death, 43% of diabetes to diabetes transitions, 50% of pre-diabetes to death and nearly 36% of pre-pre-diabetes to normal all occurred in the lowest NSEP quartile. Mexican-born nativity was significantly higher in the lowest compared with the highest quartile (55.4% vs 42.3%, p=0.0003). Mean acculturation score and years of education were lowest in quartile 1 compared with quar-tile 4 ( p<0.0001, respectively).
Association between NSEP and transitions
Table 3 shows the results of transition models with no adjustment (model 1), and with adjustment for BMI, baseline age, physical activity, health insurance, alcohol consumption, smoking, acculturation and nativity (model 2). In model 2, among participants who were normal at baseline, NSEP was not associated with a tran-sition from normal to pre-diabetes. Higher NSEP was sig-nificantly associated with an increased risk for transition from normal to diabetes (HR=1.66, 95% CI=1.14 to 2.42) and a decreased risk for transition from normal to death without diabetes (HR=0.56, 95% CI=0.33 to 0.96).
(dying without diabetes: HR=0.92, CI 0.86 to 0.98). These are modest effects and among Mexican born these associations were not significant.
CONCLUSION
We found that higher NSEP was associated with a greater likelihood to transition from normal to diabetes. However,
higher NSEP was associated with a lower likelihood of transitioning to death without diabetes. Higher NSEP was associated with a greater likelihood that pre-diabetics would transition to normal status. All other transitions were not influenced by NSEP. We accounted for sociode-mographic and health/behavioural variables in our adjust-ments. Adjustment for individual socioeconomic factors
Table 2 Transitions between states defined by quartiles of NSEP scores
NSEP score (quartiles) (N tracts=257)
Total
Quartile 1 (10.6–<19.1) N=64
Quartile 2 (19.1–<23.2) N=64
Quartile 3 (23.2–<26.3) N=65
Quartile 4 (26.3–30.6) N=64
N (%) 785 (44.3) 559 (31.5) 246 (13.8) 187 (10.5)
Number of participants
No diabetes ever 190 79 65 28 18
Pre-diabetes always 42 20 14 5 3
Diabetes always from baseline 586 287 180 67 52 Number of state transitions
Normal to pre-diabetes 393 161 116 65 51 Normal to diabetes 132 49 36 24 23 Normal to death w/o diabetes 120 63 35 17 5 Pre-diabetes to diabetes 169 73 58 22 16 Pre-diabetes to death w/o diabetes 56 28 17 9 2 Pre-diabetes to normal 321 115 95 67 44 NSEP, neighbourhood socioeconomic position.
Table 1 Comparison of baseline characteristics of SALSA participants by baseline diabetes status
Variable
Diabetes N=586 (32.9%)
Pre-diabetes N=310 (17.5%)
No diabetes
N=881 (49.6%) p Value*
Demographics
Age in years,mean (SD) 70.3 (6.9) 69.8 (6.9) 71.2 (7.3) 0.003 Health/behavioural risk factors
Body mass index (kg/m2), mean (SD) 31.0 (6.3) 31.1 (5.6) 28.3 (5.4) <0.0001 Body mass index (kg/m2), n (%) <0.0001
Normal: <25 68 (12.5) 26 (8.4) 216 (28.0) Overweight:≥25 and <30 209 (38.4) 114 (36.8) 305 (39.5) Obese:≥30 267 (49.1) 170 (54.8) 251 (32.5)
Physical activity summary score,mean (SD) 16.3 (5.4) 17.6 (5.3) 17.6 (5.5) <0.0001 Any alcohol consumption, n (%) 234 (39.9) 191 (61.6) 519 (59.0) <0.0001
Smoking, n (%) 0.05
Never smoked 259 (44.3) 130 (41.9) 429 (48.9) Former smoker 269 (46.0) 140 (45.2) 345 (39.3) Current smoker 57 (9.7) 40 (12.9) 104 (11.9)
Health insurance(n, % with) 545 (93.0) 267 (86.7) 797 (90.7) 0.008 Has a regular doctor (n, % with) 537 (91.8) 265 (85.5) 762 (86.9) 0.004 Individual-level SEP
Years of education,mean (SD) 7.1 (5.4) 7.6 (5.4) 7.2 (5.3) 0.41
Household income, n (%) 0.51
Low (<$1500) 382 (66.4) 192 (62.5) 566 (65.4) High (≥$1500) 193 (33.6) 115 (37.5) 300 (34.6)
Lifetime occupation, n (%) 0.59
Non–manual 122 (21.0) 71 (23.3) 179 (20.6) Manual 346 (59.6) 172 (56.4) 536 (61.6) Housewives/unemployed 113 (19.5) 62 (20.3) 155 (17.8)
Acculturation score,mean (SD) 22.1 (12.9) 22.6 (13.2) 21.5 (12.8) 0.42 Nativity (Mexican born),n (%) 262 (44.7) 153 (49.4) 491 (55.7) 0.0002 *Analysis of variance (ANOVA) tests for continuous variables andχ2tests for categorical variables.
(education, income, occupation) did not substantially influence the association of census-level NSEP with the various transitions. The opposite effects of NSEP in normal participants of higher risk of incident diabetes and lower risk of death without diabetes may be explained by the negative influence of low SES and potentially
bene-ficial higher concentrations of cultural protections repre-sented by the HII.
Our findings may be due to unmeasured mediators such as behaviour and/or differential access to health-care. As Latino immigrants become more acculturated they are more likely to have higher levels of education and income, but they also may be more likely to consume more alcohol, smoke and adapt unhealthy food choices associated with a more US diet.23 24 In other literature, higher levels of acculturation have been associated with higher rates of obesity and dia-betes.25 Work by Kershaw et al7 about neighbourhood ethnic isolation suggested that prevalence of obesity was actually lower in Mexican American study partici-pants living in a predominantly Hispanic neighbour-hood. In this same study, obesity was lower in the foreign born, but estimates were not made for the influence of nativity on obesity in relation to ethnic isolation.
Consistent with our initial hypothesis and some other work,20 we did find that the transition from normal to non-diabetes death was associated with lower neighbourhood social position (NSEP), while the transition from pre-diabetes to no diabetes was associated with higher NSEP. Latinos with increased levels of education and income are more likely to have access to and use healthcare. Healthcare usage may increase medical screenings and treatment; all important factors in the prevention of death from any disease. For older Latinos, the usage of healthcare is key, as they are disparately at higher risk of diabetes and pre-diabetes compared with non-Latino whites.25 However, we adjusted for healthcare access with no effect. Access to care is more likely to affect progres-sion of a condition than incidence, unless an interven-tion targets a risk factor such as obesity. We did not have measures of diet which is a limitation of the study.
The higher risk of developing diabetes associated with higher NSEP in our study of older Latinos was consistent with the Hispanic paradox.26 The protective effect of low NSEP on risk of death without diabetes in normal participants, specifically the decreased risk for transition from normal to death without diabetes, may also be
Table 3 Association between NSEP scores (IQR) and transitions within multistate Markov regression models
Model 1 Model 2
Transition states HR (95% CI) HR (95% CI)
Normal (no diabetes)—pre-diabetes 1.01 (0.85 to 1.19) 1.05 (0.88 to 1.26) Normal (no diabetes)—diabetes 1.53 (1.07 to 2.20)* 1.66 (1.14 to 2.42)** Normal—death without diabetes 0.61 (0.43 to 0.85)** 0.56 (0.33 to 0.96)* Pre-diabetes—normal (no diabetes) 1.26 (1.04 to 1.52)* 1.22 (0.99 to 1.50) Pre-diabetes—diabetes 0.80 (0.62 to 1.05) 0.83 (0.62 to 1.10) Pre-diabetes—death without diabetes 0.62 (0.35 to 1.10) 0.76 (0.40 to 1.44)
Log likelihood 7421.452 6469.601
Model 1 NSEP (7 units).
Model 2 is model 1 adjusted for BMI, age, education in years, physical activity summary score, smoking status (ever/never), any alcohol consumption, medical insurance (yes/no) and nativity (US born/Mexican born).
*p<0.05; ** p<0.001.
BMI, body mass index; NSEP, neighbourhood socioeconomic position.
consistent with the Hispanic paradox. The Hispanic paradox postulates that Latinos have better health out-comes despite a lower socioeconomic status than non-Latino whites. Criticisms of this view suggest that migrants are a healthier population than the US born. Work by Espinoza26 reports that the mortality difference in Mexican Americans versus European Americans is largely explained by adjustment for socioeconomic mea-sures.26 We have some evidence that less acculturated Latinos are less likely to transition to diabetes. It may be that as Latinos in our study became more acculturated over time, they adopted more unhealthy behaviours. Along with the rest of the nation, Latinos will age and live longer. It is predicated that over the next 40 years Latinos over the age of 65 will double and those over the age of 85 will triple.25 27If in the next four decades, Latinos become the largest ethnic minority in the USA, then understanding the roles that NSEP and cultural change play in the prevention of pre-diabetes and dia-betes and its health-related costs and complications is vital.
Author affiliations
1Department of Public Health Sciences, University of California, Davis,
California, USA
2Department of Epidemiology & Biostatistics, University of California,
San Francisco, California, USA
3Department of Epidemiology & Public health, University of Miami, Miami,
Florida, USA
4Department of Epidemiology, University of North Carolina, Chapel Hill,
North Carolina, USA
Contributors LG conceived of the study, drafted the paper, interpreted the data, and critically revised and approved the manuscript. AL and JMN performed statistical analysis and interpreted the data, and critically revised and approved the manuscript. AZAH, SM, AA and TE interpreted the data and critically revised and approved the manuscript. MNH obtained the funding; conceived of the study, wrote, critically revised, interpreted the data and approved the manuscript. LG and MNH are the guarantors of this work and, as such, and take responsibility for the integrity of the data and accuracy of the data analysis.
Funding The Sacramento Area Latino Study of Aging (SALSA) is funded by the National Institute on Aging, AG12975 and has been funded by the NIDDK (DK60753).
Competing interests None declared.
Patient consent Obtained.
Ethics approval The parent study (SALSA) was conducted with appropriate informed consent and in agreement with established Human Institutional Review Board procedures and consent at the University of Michigan, the University of California, San Francisco, and the University of California, Davis, and along with the principles of the Declaration of Helsinki.
Provenance and peer review Not commissioned; externally peer reviewed.
Data sharing statement No additional data are available.
Open Access This is an Open Access article distributed in accordance with the Creative Commons Attribution Non Commercial (CC BY-NC 4.0) license, which permits others to distribute, remix, adapt, build upon this work non-commercially, and license their derivative works on different terms, provided the original work is properly cited and the use is non-commercial. See: http:// creativecommons.org/licenses/by-nc/4.0/
REFERENCES
1. Brown AF, Ettner SL, Piette J,et al. Socioeconomic position and health among persons with diabetes mellitus: a conceptual framework and review of the literature.Epidemiol Rev
2004;26:63–77.
2. Krishnan S, Cozier YC, Rosenberg L,et al. Socioeconomic status and incidence of type 2 diabetes: results from the Black Women’s Health Study.Am J Epidemiol2010;171:564–70.
3. Connolly V, Unwin N, Sherriff P,et al. Diabetes prevalence and socioeconomic status: a population based study showing increased prevalence of type 2 diabetes mellitus in deprived areas.J Epidemiol Community Health2000;54:173–7.
4. Merkin SS, Roux AV, Coresh J,et al. Individual and neighborhood socioeconomic status and progressive chronic kidney disease in an elderly population: the Cardiovascular Health Study.Soc Sci Med
2007;65:809–21.
5. Bosma H, van de Mheen HD, Borsboom GJ,et al. Neighborhood socioeconomic status and all-cause mortality.Am J Epidemiol
2001;153:363–71.
6. Dubowitz T, Heron M, Bird CE,et al. Neighborhood socioeconomic status and fruit and vegetable intake among whites, blacks, and Mexican Americans in the United States.Am J Clin Nutr
2008;87:1883–91.
7. Kershaw KN, Albrecht SS, Carnethon MR. Racial and ethnic residential segregation, the neighborhood socioeconomic environment, and obesity among Blacks and Mexican Americans.
Am J Epidemiol2013;177:299–309.
8. Patel KV, Eschbach K, Rudkin LL,et al. Neighborhood context and self-rated health in older Mexican Americans.Ann Epidemiol
2003;13:620–8.
9. Renders CM, Valk GD, Griffin SJ,et al. Interventions to improve the management of diabetes in primary care, outpatient, and community settings a systematic review.Diabetes Care2001;24:1821–33. 10. Estabrooks PA, Lee RE, Gyurcsik NC. Resources for physical
activity participation: does availability and accessibility differ by neighborhood socioeconomic status?Ann Behav Med
2003;25:100–4.
11. Nathan DM, Buse JB, Davidson MB,et al. Management of hyperglycemia in type 2 diabetes: a consensus algorithm for the initiation and adjustment of therapy a consensus statement from the American Diabetes Association and the European Association for the study of diabetes.Diabetes Care2006;29:1963–72. 12. Pani LN, Nathan DM, Grant RW. Clinical predictors of disease
progression and medication initiation in untreated patients with Type 2 Diabetes and A1C less than 7%.Diabetes Care2008;31:386–90. 13. Harris MI. Racial and ethnic differences in health care access and
health outcomes for adults with Type 2 diabetes.Diabetes Care
2001;24:454–9.
14. Haan MN, Mungas DM, Gonzalez HM,et al. Prevalence of dementia in older Latinos: the influence of type 2 diabetes mellitus, stroke and genetic factors.J Am Geriatr Soc2003;51:169–77.
15. Jeon CY, Haan MN, Cheng C,et al. Helicobacter pylori infection is associated with an increased rate of diabetes.Diabetes Care
2012;35:520–5.
16. Cuellar I, Arnold B, Maldonado R. Acculturation rating scale for Mexican Americans-II: a revision of the original ARSMA scale.Hisp J Behav Sci1995;17:275–304. http://dx.doi.org/10.1177/
07399863950173001.
17. Mujahid MS, Diez Roux AV, Cooper RC,et al. Neighborhood stressors and race/ethnic differences in hypertension prevalence (the Multi-Ethnic Study of Atherosclerosis).Am J Hypertens
2011;24:187–93.
18. Sheffield KM, Peek MK. Neighborhood context and cognitive decline in older Mexican Americans: results from the Hispanic Established Populations for Epidemiologic Studies of the Elderly.
Am J Epidemiol2009;169:1092–101.
19. Wight RG, Aneshensel CS, Miller-Martinez D,et al. Urban
neighborhood context, educational attainment, and cognitive function among older adults.Am J Epidemiol2006;163:1071–8.
20. Zeki Al Hazzouri A, Haan MN, Osypuk T,et al. Neighborhood socioeconomic context and cognitive decline among older Mexican Americans: results from the Sacramento Area Latino Study on Aging.Am J Epidemiol2011;174:423–31.
21. Kalbfleisch JD, Lawless JF. The analysis of panel data under a Markov Assumption.J Am Stat Assoc1985;80:863–71.
22. Jackson CH. Multi-state models for panel data: the msm Package for R.J Stat Software2011;38:1–28.
24. Santiago-Torres M, Tinker LF, Allison MA,et al. Development and use of a traditional Mexican diet score in relation to systemic inflammation and insulin resistance among women of Mexican descent.J Nutr2015;145:2732–40.
25. Vincent GK, Velkoff VA.THE NEXT FOUR DECADES, The older population in the United States: 2010 to 2050. Washington, DC: USA. Census Bureau, 2010.
26. Espinoza SE, Jung I, Hazuda H. The Hispanic paradox and predictors of Mortality in an Aging Biethnic Cohort of Mexican Americans and European Americans: The San Antonio Longitudinal Study of Aging.J Am Geriatr Soc2013;61:1522–9.