AGE-RELATED DIFFERENCES IN RAPID TORQUE PRODUCTION: INFLUENCE OF MUSCLE SIZE, QUALITY,
ARCHITECTURE, AND ACTIVATION
Joseph G. Rosenberg
A thesis submitted to the faculty of the University of North Carolina at Chapel Hill in partial fulfillment of the requirements for the degree of Master of Arts in the department of Exercise and
Sport Science in the College of Arts and Sciences (Exercise Physiology).
Chapel Hill 2014
Approved by: Eric. D. Ryan
iii ABSTRACT
JOSEPH G. ROSENBERG: Age-Related Differences in Rapid Torque Production: Influence of Muscle Size, Quality, Architecture, and Activation
(Under the direction of Eric Ryan)
ACKNOWLEDGEMENTS
v
TABLE OF CONTENTS
LIST OF TABLES ... viii
LIST OF ABBREVIATIONS ... ix
Chapter I. INTRODUCTION ...1
Purpose ...5
Research Questions ...5
Hypotheses ...6
Delimitations ...6
Limitations ...6
Theoretical Assumptions ...6
Statistical Assumptions ...7
Operational Definitions ...7
II. REVIEW OF LITERATURE ...8
Structure of Review ...8
The influence of age on various mechanisms of RTD ...8
Thelen et al. (1996) ...8
Izquierdo et al. (1999) ...9
Aagaard et al. (2007)...10
Klass et al. (2008) ...12
Factors influencing rate of torque development ...15
Skelton et al. (1994) ...15
Andersen and Aagaard (2006) ...16
Andersen et al. (2010) ...17
Moreau et al. (2012) ...18
Changes in fiber type distribution and size with age ...20
Lexell et al. (1988) ...20
Lee et al. (2006) ...21
Narici et al. (2003) ...22
The influence of intramuscular fat and connective tissue on muscle quality ...23
Reimers et al. (1993) ...23
Pillen et al. (2009) ...24
Delmonico et al. (2009) ...25
The relationship between muscle size, muscle quality, muscle strength, and rate of torque development ...26
Visser et al. (2005) ...26
Fukumoto et al. (2012) ...27
Cadore et al. (2012)...28
Strasser et al. (2013) ...29
The influence of rapid contractile variables on lower extremity muscular performance ...31
Lamoureux et al. (2001) ...31
Granacher et al. (2010) ...32
vii
Bento et al. (2010)...35
Clark et al. (2010) ...36
Clark et al. (2013) ...37
III. METHODOLOGY ...39
Participants ...39
Experimental Design ...39
Familiarization Trial ...40
Isometric Maximal Voluntary Contraction ...40
Electromyography ...40
Signal Processing ...41
Ultrasound Assessment ...41
Muscle Size and Quality Analysis ...43
Fascicle Length and Pennation Angle Analysis ...43
Statistical Analyses ...43
IV. RESULTS ...45
V. DISCUSSION ...47
LIST OF TABLES
Table 1. Physical characteristics and outcome variables for both
young and older groups ...52 Table 2. Correlation coefficients between physical characteristics,
RTD, and EMG variables of young males ...53 Table 3. Correlation coefficients between physical characteristics,
RTD, and EMG variables of older males ...54 Table 4. Correlation coefficients between physical characteristics,
RTD, and EMG variables of all participants ...55 Table 5. Factors associated with aRTDpeak on stepwise regression
analysis among young males ...56 Table 6. Factors associated with aRTDpeak on stepwise regression
ix
LIST OF ABBREVIATIONS
aRTDpeak Absolute peak rate of torque development CSA Cross-sectional area
EI Echo intensity EMG Electromyography FL Fascicle length
MG Medial gastrocnemius
MVC Maximal voluntary contraction
nRTDpeak Normalized peak rate of torque development
PA Pennation angle
RER Rate of electromyographic rise RFD Rate of force development RTD Rate of torque development
CHAPTER I INTRODUCTION
2
muscle strength) and less dependent on neural drive as the time from the onset of muscle action increases. Furthermore, previous studies have indicated that RTD decreases to a greater extent in aging adults than maximal strength (18, 26, 56). Collectively, these findings demonstrate that the age-related decline in rapid contractile variables may significantly contribute to the functional decline observed in older adults.
Previous research has shown that reductions in muscle mass (i.e. sarcopenia) with increasing age may correspond to a decline in maximal strength (18, 20, 56). In a study by Sipilä et al. (50) involving the quadriceps muscle, significant correlations between muscle strength and CSA were observed, with non-significant correlations between strength and muscle thickness. Similarly, Thompson et al. (56) reported that both estimated thigh CSA and RTD were significantly lower in older compared to young adults, indicating a possible relationship between these two variables. For example, Suetta et al. (53) found that changes in rapid force characteristics of the quadriceps among older adults were accompanied by alterations in muscle CSA.
quality obtained through the gray-scale analysis of individual pixels within an ultrasound (US) image has previously been correlated with skeletal muscle infiltration of fat and fibrous tissue (42). Despite a lack of available data concerning longitudinal reductions in muscle quality, there appears to be a general consensus that the increase in EI, indicative of reduced skeletal muscle quality, predominantly occurs among those adults over 60 years of age (5). Furthermore, the prevalence of sarcopenia may range from 13-24% in persons aged 65-70 years and nearly 50% for those over 80 years of age (15). Thus, despite non-significant changes in overall CSA between young and older adults, muscle quality may decline with age as lean muscle mass becomes increasingly replaced with fat and fibrous tissue (24, 45). This reduction in muscle quality may be attributed to neuromuscular aging - the progressive neurogenic process whereby a diminished re-innervation capacity causes a permanent denervation and loss of the fiber (32). Until recently, ultrasonography EI analysis has utilized individual slices of muscle cross-sections, rather than a composite image of the entire muscle (5, 9, 17). While EI can still be obtained in this manner, panoramic ultrasonography allows for quantification of a complete region or muscle of interest (2, 41). As the presence of intramuscular adipose and fibrous tissue may not necessarily be evenly distributed throughout the muscle, a panoramic analysis of the entire cross-section of the muscle may provide a better estimate of skeletal muscle quality.
4
a greater degree than maximal strength. While Narici and colleagues (40) have previously shown that both fascicle length and pennation angle decrease with increasing age, the possible relationship between these architectural features and RTD warrants further investigation in older adults.
In summary, the ability to examine muscle architecture in vivo is important for assessing changes associated with exercise interventions (2), neuromuscular diseases (38), and aging (47). Falls are the largest single cause of restricted activity days among the elderly, at 18% (48). Accordingly, identifying the mechanisms responsible for falls among older adults may allow for more specialized training programs among older patients, potentially reducing the number of restricted activity days. Rapid torque characteristics hold significant functional relevance among the aging population, because many functional movements last less than 250 ms (56). LaRoche and colleagues (30) suggest that neuromuscular as well as strength and RTD deficits in the ankle musculature may be present in adults with a history of falling, and that strength, speed of movement, and power of the ankle plantarflexors should be examined as potential contributors to falls in older adults. Therefore, the purpose of the present study was to examine the age-related differences in muscle quantity, muscle quality, pennation angle, fascicle length and the rate of EMG rise on the RTD.
Purpose
1. The primary purpose of this study was to 1) investigate the age-related differences in medial gastrocnemius (MG) muscle size (CSA), muscle quality (EI), pennation angle (PA), fascicle length (FL), the rate of EMG rise (RER) and normalized (nRTDpeak) and absolute (aRTDpeak) peak rate of torque development, 2) to determine the relationship between these variables in young and older adults, and 3) to determine the relative contributions of MG size, quality, architecture, and activation on relative and absolute plantar flexor RTD in young and older adults.
Research Questions
6
2. Are CSA, EI, PA, FL and RER related to either nRTDpeak or aRTDpeak in young adults, older adults, and all ages combined?
3. Which parameters are most predictive of nRTDpeak and aRTDpeak separately and combined amongst age groups.
Hypotheses
1. CSA, EI, PA, FL, RER, nRTDpeak and aRTDpeak will decline with increasing age. 2. CSA, EI, PA, FL and RER will be related to nRTDpeak and aRTDpeak in both groups
separately, and when groups are combined.
3. CSA, EI, and RER will significantly contribute to nRTDpeak and aRTDpeak in both
groups separately, and when groups are combined. Delimitations
1. Participants in the young and older groups were between the ages of 18-30 years and 65-74 years, respectively.
2. Muscle activity of the medial gastrocnemius was measured using bipolar surface
electrodes and the BIOPAC system. Limitations
1. Participant recruitment took place throughout various departments on the UNC campus. Therefore, participant selection was not truly random.
2. The sample included volunteers, therefore not meeting the underlying assumption of
random selection. Theoretical Assumptions
2. All participants gave maximal effort when performing isometric contractions. 3. Each participant’s right leg was completely relaxed during all US assessments. 4. All equipment was calibrated and accurate for all testing sessions.
Statistical Assumptions
1. The population from which the samples were drawn was normally distributed. 2. The data were based on a parametric scale, either interval or ratio.
3. The within-group variability of the samples in the experiment was equal or nearly so (homogeneity of variance).
Operational Definitions
Surface Electromyography (EMG) – an electrical recording of the muscle action potential potentials that sweep across the sarcolemma and pass through the surface electrode recording areas during a skeletal muscle action; representative of motor unit recruitment and firing frequency; the raw signal is expressed in microvolts (µV) (16).
Recreationally Active – 1-5 hours per week of structured and/or recreational exercise, excluding competitive athletes.
Maximum Voluntary Contraction (MVC) – the maximum voluntary torque produced by a muscle or group of muscles under isometric conditions.
Panoramic Ultrasound – an image fitting method that extends the field of view of the ultrasound probe through real-time generation of a cross-sectional image.
8 CHAPTER II
REVIEW OF LITERATURE
This literature review will include previous research studies that are most related to the influence of neuromuscular function on the age-related reduction in RTD. Additionally, the results of each study along with the conclusions suggested by the authors will provide a more in-depth understanding of the concepts expressed later in Chapter V of this thesis. This review will begin with an overview of the mechanisms suggested to be responsible for changes in RTD, and then move to an overview of the effects that aging may have on these mechanisms.
The influence of age on various mechanisms of RTD
Thelen, Schultz, Alexander, and Ashton-Miller (1996)
maximal warm-up trials, torque data were recorded during three sets of six muscle actions with 30 seconds between trials and five minutes between sets. Each set consisted of one isometric muscle action followed by one isokinetic muscle action at each of the five velocities. Surface electromyographic (EMG) signals were recorded from the tibialis anterior, soleus, and medial and lateral gastrocnemius muscles using bipolar surface electrodes. Maximum isometric voluntary strength (MVS) and absolute rate of torque development (MRTD) were significantly lower among the OA compared to the YA for isometric plantarflexion (P<0.01). MVS and MRTD were significantly lower among the OA compared to the YA for isometric dorsiflexion (P<0.05), with the exception of MVS among the male participants (P>0.05). The loss in MRTD with age was 25% and 29% in the dorsiflexors and plantarflexors, respectively. While the normalized RTD (NRTD) in the dorsiflexors and plantarflexors was greater for the YA than the OA, the difference was not significant (P>0.05). Additionally, YA developed significantly larger maximum isokinetic torques than OA at all angular velocities examined (P<0.05). The authors (54) suggested that the ability of healthy older adults to recover their balance following a perturbation or to complete time-critical actions that require at least moderate strength may be considerably degraded by the reductions in the elderly to develop ankle torque rapidly. Furthermore, the authors posit that these age related declines in RTD may result from changes in muscle activation or adaptations of muscle mechanics.
Izquierdo, Aguado, Gonzalez, López, and Häkkinen (1999)
10
participants were tested for their maximal bilateral isometric leg extension force (MIF) and maximal rate of force development (RFD) during the complete muscle action from a squatted isometric condition using a force platform (Dinascan 600M). MIF testing consisted of three trials lasting 2.5-4 s with a 90 s rest period. Dynamic explosive force was measured on the force platform through a maximal vertical squat jump (SJ), counter movement jump (CMJ), and standing long jump (SLJ). Balance performance was measured as the transition time (TT), percentage of time inside center with respect to the overall time lit (TC), and straightness of trajectory (ST) for the participant to achieve a bull’s-eye by moving their body. MIF in M70 was significantly lower (P<0.001) than both M40 and M20. Similarly, M70 demonstrated significantly lower values (P<0.001) than both M40 and M20 in SJ, CMJ, and SLJ protocols. Both maximal RFD and the force produced during the first 500 ms of the MIF were significantly lower in M70 (P<0.001-0.01, respectively) than in M40 and M20. Maximal RFD values between M40 and M20 did not differ significantly from one another (P>0.05). Specifically, the maximal RFD in M70 was 64% lower than in M20, while MIF in M70 was only 46% lower than in M20. Regarding balance performance, TT between the lit centers in M20 was significantly shorter than in M70 (P<0.001), while TC was greater in M20 than in M70 (P<0.001). The authors (23) concluded that explosive force production of the leg extensor muscles, examined through RFD, significantly declines with age to a greater extent than maximal muscle strength. Further, this loss of explosive force may contribute to the age-related impairments in postural control and balance.
Aagaard, Magnusson, Larsson, Kjær, and Krustrup (2007)
12
this study may have been retained at a higher level in physically active older individuals, particularly when exposed to chronic strength training.
Klass, Baudry, and Duchateau (2008)
adults, there was no difference (P=0.38) between the two groups when peak torques were expressed relative to the respective MVC torques. The fast muscle action was accompanied by a 48% decrease in absolute peak RTD (P<0.01) and by a 33% decrease in relative peak RTD (P<0.01). Peak RTD was linearly related to the peak torque achieved during the fast muscle actions produced at different torque levels in both young and old men. The results indicated that regardless of the torque achieved during the fast muscle action, the peak RTD was significantly (P<0.01) lower in older adults. Additionally, there was a significant age-related decline (P<0.001) in motor unit discharge frequency during the fast voluntary muscle action, with the discharge frequency of the third interspike interval significantly lower than the second (P<0.05) among the older adults. The percentage of motor units that discharged doublets (interspike intervals <5 ms) was significantly greater for young (8.4%) than for old (4.6%) adults (P<0.05). The authors (26) suggested that healthy aging involves neural impairments that likely limit the maximal capacity of motoneurons to discharge at very high rates, illustrated with the decline in interspike intervals and doublets, which consequently may limit maximal RTD.
Thompson, Ryan, Sobolewski, Conchola, and Cramer (2013)
14
leg flexors and extensors were performed with one minute of recovery between muscle actions and three minutes between muscle groups. All torque signals were sampled with a Biopac data acquisition system (MP150WSW, Biopac Systems, Inc., Santa Barbara, CA, USA). Estimated total thigh muscle cross-sectional area (eThighCSA) was calculated from midthigh circumference and anterior thigh skinfold measurements. Isometric MVC peak torque (PT) was determined as the highest 0.5 s epoch during the 3-4 s MVC plateau. Rate of torque development (RTD) was quantified from the linear slope of the torque-time curve at time intervals of 30 (RTD30), 50 (RTD50), 100 (RTD100), and 200 ms (RTD200) from the onset of torque production. Contractile impulse (IMPULSE) was determined as the integrated area under the torque-time curve for the previously described time intervals (see above). Finally, relative RTD values were computed on the normalized torque-time curve at 10, 20, 30, 40, and 50% of the MVC. PT was greater for the young (P<0.001) and middle-aged (P=0.001) men when compared to the older men. RTD50 was significantly greater for the young compared to the old men for the leg extensors (P=0.024). While both RTD30 (P=0.003) and RTD50 (P=0.002) were greater for the middle-aged men compared to the older men, only RTD50 was significantly greater for the young men compared to the older men. Peak RTD (P<0.001), RTD100 (young, P<0.001; middle-aged, P=0.002), and RTD200 (P<0.001) were significantly greater for the
indicated that maximal and rapid torque variables were significantly lower in the older men when compared to young and middle-aged men for both leg extensor and flexor muscle groups (P<0.05). These findings demonstrated that there might be an age-related neuromuscular adaptation at the early phases (RTD30 and RTD50) of the torque-time curve, as well as an age-related reduction in muscle mass, as indicated by the lower eThighCSA among the older men. The authors (56) concluded that because the maximal and rapid torque variables were maintained in the middle-aged compared to younger men, these age-related declines of the lower extremities may not present prior to age 50. Additionally, because relative RTD was not significantly different between age groups, the authors suggest that strength and muscle mass may be critical for improving RTD among older adults.
Factors influencing rate of torque development
Skelton, Greig, Davies, and Young (1994)
16
suggested that the age-related loss of LEP was significantly greater than the rate of loss of MVC (P=0.0001). The differences in isometric strength and leg extensor power over the age range were equivalent to reductions of 1-2% and 3.5% per year, respectively. Age and LEP relative to body weight each accounted for 33% of the variance in step height (P=0.04). These findings suggested that reductions in functional performance may be due to inactivity and disease rather than strength or power. The authors (51) suggested identification of those adults most at risk for becoming dependent might only be possible through comparisons with healthy older adults, and that strength and power may play a role in changes in functional performance.
Andersen and Aagaard (2006)
twitch time to peak torque (r=-0.26-0.11), half relaxation time (r=-0.10-0.01), and twitch peak torque with voluntary RFD (r=0.01-0.14) (P>0.05). At time intervals later than 90 ms from muscle action onset, maximal muscle strength could account for 52-81% of the variance in voluntary RFD, indicating that factors other than maximal strength may be responsible for early RFD. Specifically, a significant relationship was observed between both voluntary RFD at 30 ms (r=0.57, P<0.01) and 200 ms (r=0.89, P<0.001) from the onset of muscle action and twitch RFD. These findings suggested that voluntary RFD becomes increasingly dependent on maximal strength and less dependent on twitch RFD and intrinsic muscle contractile properties when RFD is calculated later from the onset of muscle action. The authors (4) suggest that RFD at later phases of muscle action (150-250 ms) may be influenced by muscle cross-sectional area, a component of maximal muscle strength, as well as the neural drive to the muscle fibers.
Andersen, Andersen, Zebis, and Aagaard (2010)
18
dynamometer (Kinetics Communicator, Chattecx Corp., Chattanooga, Tennessee, USA). MVC testing, preceded by a 15 min dynamic and isometric submaximal contraction warm-up, consisted of three maximal isometric attempts lasting 3 s with 60 s rest periods. MVC was defined as the highest peak torque of the three maximal attempts, while RTD was defined as the slope of the torque-time curve in increasing time-intervals from onset of muscle action to 250 ms. The results indicated that in the resistance training group, the RTD increased 11% at 250 ms from onset of muscle action (P<0.05) whereas no significant changes occurred in the earlier time intervals. Relative RTD (RTD/MVC) significantly decreased 10-18% (P<0.05) from the onset of muscle action to 140 ms in the resistance training group. MVC increased 18% in the resistance training group, while no change occurred in the control group (P<0.001). The training-induced increase in RTD observed at 250 ms was positively correlated to the gain in MVC (r=0.69, P<0.01), with an explained variance of 48% (P<0.05). The authors (3) suggested that because contractile RTD in the early and later phases of rising muscle torque respond differently to resistance training, training to improve early RTD should be performed with the intention of maximal acceleration regardless of the actual movement velocity.
Moreau, Falvo, and Damiano (2012)
three measurements of each variable used for subsequent analysis. All measurements were performed on the right limb with the participants in the supine position with the leg at 10º of flexion. Muscle thickness (MT), fascicle angle (FA), and estimated fascicle length (FL) were obtained with the probe held in the longitudinal plane, while anatomical cross-sectional area (CSA) of the RF was obtained along the transverse plane. Each participant performed three maximal voluntary isometric contractions (MVC) on an isokinetic dynamometer (System 3 Pro, Biodex Medical Systems, Shirley, NY) in the seated position with a hip angle of 85º of flexion above horizontal and knee angle of 60º of flexion. Each MVC was performed for 3 s, with 60 s rest periods between trials, from which the highest MVC was used for subsequent analysis. RTD was calculated as the mean slope of the torque-time curve from onset of muscle action to 30, 50, 100, and 200 ms. Peak RTD (RTDpeak) was calculated as the maximum slope during the 0 – 200
ms time period, with RFD50 calculated as the slope at 50% of MVC. Impulse was obtained from
the area under the torque-time curve during the same time periods described above. Gait (velocity, cadence, step length, stride length) was analyzed using a Vicon motion capture system (Vicon, Oxford Metrics, Oxford, UK) over ground level at a self-selected walking speed. Finally, functional mobility was assessed with the Pediatric Outcomes Data Collection Instrument (PODCI) parent report and the Activities Scale for Kids performance version (ASKp). All knee extensor RTD and impulse values among the CP group were significantly lower (P=0.001 – 0.002) than those in the TD group. The results indicated significant differences for normalized RTD (RTD/MVC) between the CP and TD groups at 0 – 30 ms, 0 – 50 ms, and 0 – 100 ms relative to onset of muscle action (P = 0.01 – 0.02), with no significant differences for normalized RTD at 0 – 200 ms, RTDpeak, or RTD50 (P = 0.054 – 0.64). While VL
20
impulse (0 – 100 ms) (R2 = 0.50), all muscle architectural variables in the TD group were significant predictors of RTDpeak (R2 = 0.46 – 0.71) and impulse (0 – 100 ms) (R2 = 0.37 – 0.70).
RTDpeak and impulse were the strongest predictors of PODCI Sports and Physical Functioning (r
= 0.82, R2 = 0.67, P<0.05). Additionally, while RTDpeak was shown to be a better predictor of
sports and higher level activities (R2 = 0.66, P<0.05), MVC was shown to be a better predictor of gait (R2 = 0.50, P<0.05). VL MT was the primary predictor of RTD and impulse in the CP group, while all muscle architectural variables were predictors of impulse and RTD in the TD group across all time periods. The authors (37) suggest that RTD may be more closely related to strength during the later phases of the torque-time curve.
Changes in fiber type distribution and size with age
Lexell, Taylor, and Sjöström (1988)
(age = 70 - 83 years) were less tightly packed with visible differences in fiber size and shape. Additionally, fiber type grouping was greater among the older men compared to the younger men. The largest muscle CSA was observed at 23.7 years of age, with a 40% reduction from age 20 to 80 years. There was a significant reduction (P<0.01) in size with increasing age of type II fibers only, with a 26% reduction from 20 to 80 years of age. Interestingly, the results indicated that muscle fibers comprised only 50% of muscle CSA among the older men, while muscle fibers in the younger men comprised 70% of muscle CSA. The authors (32) suggested that denervated and inactive fibers might be the cause for the change in fiber size and number, particularly in type II fibers, and that the replacement of those impaired fibers by fat and fibrous tissue may be responsible for the decrease in fiber density.
Lee, Cheung, Qin, Tang, and Leung (2006)
22
ratio of type IIa and IIb muscle fibers significantly decreased as age increased (P<0.05), with respect to total area, number, and mean fiber area. Alternatively, type I fibers increased in total area and number (P<0.05) with increasing age. Type IIa and IIb muscle fibers decreased in fiber number percentage (r=-0.282, P=0.027; and r=-0.552, P<0.001, respectively), and significantly increased in type I muscle fiber (r=0.597, P<0.001) with increasing age. Mean fiber area of type IIa and IIb fibers were smaller with increased age (r=-0.503, P<0.001; and r=-0.454, P<0.001, respectively), with no difference in type I muscle fibers (r=0.185, P=0.151). The area percentage of intramuscular connective tissue also increased with increasing age (r=0.401, P=0.002). Additionally, the type IIb muscle fibers appeared flattened and small with an aspect ratio (maximum length/maximum width) of 1.60 ± 0.40 for those participants less than 65 years of age, and 1.95 ± 0.60 for those greater than 65 years of age. These results indicated that type II muscle fiber number and size decrease with age, with concomitant increases in type I fiber number and connective tissue. The authors (31) suggested that lack of physical activity or regular exercise may have resulted in the differences in size and shape of the fast-twitch fibers to a greater extent than the deterioration seen with normal aging.
Narici, Maganaris, Reeves, and Capodaglio (2003)
the maximum ACSA (ACSAmax) of the MG selected for subsequent data analysis. For MG
muscle Vol calculation, all slices were fitted with a spline algorithm to interpolate for missing slices and total Vol was calculated by adding the individual ACSA of each image and multiplying the sum by the slice thickness. FL and PA were measured at the midbelly of the MG along the longitudinal plane. When the fascicle extended off the ultrasound image, the length of the missing portion of the fascicle was estimated by extrapolating linearly both the fascicular path and the aponeurosis. The results indicated significant differences between the older and younger groups for ACSAmax (19.1%, P<0.005), Vol (25.3%, P<0.001), FL (10.2%, P<0.01),
and PA (13.2%, P<0.01), with a significant correlation observed between ACSA and PA (r = 0.432, P<0.05). Additionally, a significant difference was observed between the older and younger groups for PCSA (15.2%, P<0.05). Because both ACSAmax and PCSA of the MG were
found to decrease with increasing age, the authors speculated that the aging process may include a loss of muscle fibers in series as well as parallel. Specifically, no difference was observed between the ratios of ACSAmax to PCSA of the young (0.30 ± 0.04) and of the older (0.29 ± 0.06)
(P>0.05). Combined between the young and old men, ACSAmax and PCSA were found to be
significantly correlated (r=0.759, P<0.01). The authors (40) suggested that the reductions in muscle size and architecture in the older group may not have been altered by disuse, because the older individuals selected in the study had similar physical activity and daily energy expenditure values to those of the younger group.
The influence of intramuscular fat and connective tissue on muscle quality
Reimers, Reimers, Wagner, Paetzke, and Pongratz (1993)
24
muscle biopsies were taken from the tibialis anterior (n=54), biceps brachii (n=14), rectus femoris (n=12), vastus lateralis (n=4), and medial gastrocnemius (n=2). Biopsy samples with a minimum of 100 fibers were included in the investigation (n=83). Total content of triglycerides in the muscle biopsy sample was determined enzymatically in 29 muscles. Ultrasonographic analyses of the muscles were performed in both transverse and longitudinal planes using a real-time scanner with a 3.75 MHz linear array transducer (Toshiba SSA 90-A, Tokyo, Japan). Echo intensities were determined using computer-assisted gray-scale analysis. The results indicated a significant correlation (r=0.46, P<0.001) between the content of intramuscular fat and the mean echogenicity. However, the degree of muscular fibrosis did not significantly influence the echogenicity (P>0.05). The authors (44) suggested that fat replacement, or increased intramuscular fat rather than increased fibrous tissue, constitutes the main cause of increased muscle echogenicity.
Pillen, Tak, Zwarts, Lammens, Verrijp, Arts, Van Der Laak, Hoogerbrugge, Van Engelen, and Verrips (2009)
specimen was selected and cut in 4 µm thick sections. The percentage of perimysial and endomysial tissue were measured using digital image analysis, whereby microscopic fields of vision were digitized using a (Red Green Blue) CCD camera, and multiple sections of each image were randomly chosen for analyses. For each section, the 4 to 10 digitized images were analyzed and the mean percentage of fibrous tissue was calculated, while the percentage of interstitial fat was determined manually. Muscle EI was significantly correlated to the amount of fibrous tissue (r=0.87; P<0.001), and remained after correction for fat content (r=0.88; P<0.001). No significant correlation between fat and EI were observed (P>0.05), however the authors suggest that this may have been due to the low levels of fat within the specimens. The authors (42) conclude that increased echo intensity is both caused by the infiltration of fat and fibrous tissue. However, through ultrasound alone, the relative contributions of fat and fibrous tissue on mean EI may not possible.
Delmonico, Harris, Visser, Park, Conroy, Velasquez-Mieyer, Boudreau, Manini, Nevitt, Newman, and Goodpaster (2009)
26
Kin-Com 125 AP Dynamometer (Chattanooga, TN) at 60º/s on the right leg. The average of the three most similar trials was used for subsequent analysis. In both men and women, total thigh CSA, average torque (both P<0.001), and subcutaneous fat (P<0.05) all decreased significantly. There was also a significant increase in IMF area in both men and women (P<0.001). Muscle quality, defined as muscle torque relative to quadriceps muscle area and a measure of relative performance, decreased significantly with increasing age over the five year period (P<0.001). In the men, average torque decreased 16.1% ± 20.6, while muscle CSA decreased 4.9% ± 7.4. These findings suggested that IMF of midthigh skeletal muscle in men and women increase with age, with age-related decreases in strength exceeding the loss of muscle size. The authors (13) suggest that progressive weakness and the increase in infiltrating fat with age occur independent of changes in muscle quantity or subcutaneous fat.
The relationship between muscle size, muscle quality, muscle strength, and rate of torque
development
Visser, Goodpaster, Kritchevsky, Newman, Nevitt, Rubin, Simonsick, and Harris (2005)
(cm2). Fat infiltration was measured through mean attenuation of the thigh muscle, where lower attenuation indicated greater fat infiltration. Mobility limitations were assessed by self-reported level of difficulty walking one-quarter mile and climbing 10 steps without resting. Hazard ratios for men and women ranged between 1.68 (P<0.01) – 2.02 (P<0.001) for muscle strength and muscle attenuation. When muscle strength was accounted for, low muscle area did not remain a significant factor associated with incident mobility limitations. Additionally, those participants with the greatest amount of intramuscular fat (within the lowest quartile of all participants) were 50-80% more likely to develop mobility limitations over time, independent of muscle CSA, strength, or total body fat mass (P<0.001). The results indicated that only muscle attenuation and muscle strength independently predicted mobility limitation. The authors (59) suggest the association between low muscle mass and incident mobility limitations to be a function of lower muscle strength. Specifically, older persons with low muscle mass may be at increased risk of functional decline due to overall fraility.
Fukumoto, Ikezoe, Yamada, Tsukagoshi, Nakamura, Mori, Kimura, and Ichihashi (2012)
28
femoris as possible without the surrounding fascia were selected for EI analysis. Percent body fat (%BF) was assessed using segmental bioelectrical impedance analysis with 12 pre-gelled electrocardiogram electrodes (2x2 cm, Red Dot, 3 M). Strength testing of the knee extensors on the right side was performed using an isometric dynamometer (Isoforce GT-330; OG GIEN Co., Okayama, Japan). The participants were tested in a seated position with 60º of knee flexion. Isometric strength was measured twice for 3 s, with a 30 s rest period between trials. The results indicated that while significantly positively correlated with age (r=0.34, P<0.01), EI was also significantly correlated with muscle strength when age and MT were controlled (r=−0.26, P<0.05). Additionally, EI showed no significant correlation with %BF (r=0.08) and FT
(r=-0.19) (P>0.05). Muscle strength was significantly negatively correlated with age (r=−0.32, P<0.01). Finally, MT was significantly correlated with muscle strength (r=0.32, P<0.01) when
age, BMI, and EI were controlled. These findings suggested that muscle size and muscle quality independently contribute to muscle strength, although together they only account for a majority of the variance in muscle strength, which may have resulted from the already compromised muscle quality among these older adults. The authors (17) also suggest that age-related decreases in muscle strength may be associated with factors other than muscle quality, including decreased neural activation of the agonist muscle, specifically among older adults.
Cadore, Izquierdo, Conceição, Radaelli, Pinto, Baroni, Vaz, Alberton, Pinto, Cunha, Bottaro, and Kruel (2012)
leg at 120º of knee extension. Maximal isometric protocols consisted of three maximum voluntary contractions (MVC) of the knee extensors lasting 5-s each, while isokinetic PT at 60, 180, and 360º/s was assessed as the PT achieved from five dynamic repetitions (2-min rest intervals) of concentric knee extension/flexion at each angular velocity. EI of the rectus femoris (RF) and MT of the vastus lateralis (VL), vastus medialis (VM), vastus intermedius (VI), and RF were measured using B-mode ultrasound (Philips, VMI, MG, Brazil) with a 7.5 MHz probe placed perpendicular to the skin, and analyzed using Image-J (National Institute of Health, USA, version 1.37). Regions of interested that included as much of the muscle as possible without the surrounding fascia were selected for EI analysis. The sum of the four lower-body muscles MT was represented in subsequent analyses as the quadriceps femoris (QF). The results indicated significant negative correlations between individual RF EI and corresponding isometric PT and isokinetic PT values at 60, 180, and 360º/s (range from r=−0.48 to r=−0.64, P<0.05). MT was also significantly correlated with isometric and isokinetic PT values (range from r=0.44 to r=0.62, P<0.001 to P<0.05). Additionally, a significant relationship between muscle EI and explosive strength, represented as isokinetic performance, was observed (range from r=−0.64 to r=−0.67, P<0.001). The authors (9) concluded that both muscle size and muscle quality (i.e. the amount of connective and adipose tissues in the muscle) are associated with high-speed isokinetic performance, or rapid force muscle actions.
Strasser, Draskovits, Praschak, Quittan, and Graf (2013)
30
4.8 years, n=26) adults participated in this investigation. MVC performance during three maximal leg extensions with two minutes rest between each trial was assessed using a load cell (DFS Ametek Inc., Chatillon, USA) with participants seated with their hips and knees at 90º of flexion. MT and EI of the quadriceps muscles at 50% of the femur length of a randomly assigned leg of each participant were obtained through brightness mode ultrasonography with a 7.25 MHz linear array transducer and assessed using Image-J (National Institutes of Health, USA). PA was measured from each longitudinal US image, with the average PA obtained from the three separate fascicles. Maximal MT was measured as the distance between the superficial and deep fascia at the widest point, with a region of interest excluding surrounding fascia from a longitudinal scan used to examine EI. MT of the rectus femoris, vastus intermedius, vastus lateralis, and vastus medialis between the young and old groups was significantly reduced in the older group (P<0.0001, P<0.05, P<0.01, and P<0.05, respectively). EI was also significantly reduced in the older group (P<0.01). PA was significantly different between the young and old groups in both the vastus lateralis and vastus medialis (P<0.001). Furthermore, PA was significantly correlated with MVC in the vastus intermedius in the young group only (r=0.68, P<0.001). Mean MVC of the older group was significantly lower than that of the younger group
(-31.1%, P<0.001). In both groups, a significant relationship between MT (r=0.75-0.92, P<0.001) and MVC was observed. There was no significant relationship between EI and MVC
and significantly correlated with MVC in the young group, the relationship between PA and MVC among different ages may be significant in other muscle groups. Furthermore, because EI was evaluated in longitudinal compared to transverse ultrasound scans, the significance of this measure on MVC among older adults may still be present. Because EI provides an indirect measure of skeletal muscle tissue quality (accumulation of connective tissue and/or intramuscular fat) an increased EI may indicate a reduction in skeletal muscle quality. Additionally, because EI is based on the gray-scale of each ultrasound image, the cross-sectional view of the muscle fibers permitted during a transverse scan may provide an alternative view of the muscle.
The influence of rapid contractile variables on lower extremity muscular performance
Lamoureux, Sparrow, Murphy, and Newton (2001)
32
of individual peak integrated EMG activity. Absolute RTD was determined from the time taken to increase torque in 50 Nm intervals from 50 to 250 Nm. The relative torque-time curve was taken from the times needed to increase torque from 10 to 20%, 30%, and 40% of MVC. The results suggest that both MVC and RTDpeak of the old group were significantly greater than the
older group (P<0.01). Mean BFLT of the thigh was significantly greater (P<0.05) in the old group than in the older group. BFLT was significantly correlated to MVC of the knee extensors in both groups (r=0.851, P<0.001). In addition, the older group took significantly longer to reach each torque level than the old group (P<0.05). No significant differences were observed between groups among the relative torque-time responses. Additionally, the old group produced significantly higher integrated EMG values (P<0.01) at each 100 ms epoch from the start of muscle activation up to 500 ms. Together, these findings indicate that reduced neuromuscular activity, size and number of functional motor units, and excitable muscle mass may be possible mechanisms for age-related changes in MVC and RTD. The authors (29) suggested that the age-related reductions in muscle strength and explosive force characteristics of the neuromuscular system may contribute to increased fall related injuries and limitations of activities of daily living among older adults. This may be due to decreased ability to activate functional motor units, as well as decreased proportion of type II muscle fibers.
Granacher, Gruber, and Gollhofer (2010)
were assessed for all participants on a leg-press, whereby the characteristics of the leg-extensors were evaluated. During all assessments, circular bipolar surface electrodes (Hellige, Ag/AgCl, Freidburg, Germany) positioned over the tibialis anterior (TA), soleus (SO) and vastus medialis (VM) of the right leg measured mean amplitude voltage (MAV), which was normalized on the swing and stance phases of ten regular gait cycles. Gait perturbation protocol used to determine FRA consisted of random decelerating perturbation impulses at separate phases of the gait cycle, with the decelerating perturbation impulses 120 ms after the first biomechanical response to the perturbation impulse used for FRA analysis. The MVC was performed following a warm-up of 3-5 submaximal muscle actions with each foot on individual force platforms (Kistler, Winterthur, Switzerland). RFDpeak was defined as the maximal slope at the deflection point on the force-time
curve, while RFD30 and RFD100 were determined over the time intervals 0-30 ms and 0-100 ms, respectively. MVC, RFDpeak, RFD30, and RFD100, as well as MAV of SO and VM, were
significantly lower in the old compared with the young men (P<0.01). Regarding gait perturbations, only the decelerating perturbation impulse (functional reflex activity) was significantly reduced for the TA in the old compared to young men (P<0.05), with a no significant differences in coactivation between groups (P=0.07). The results suggested that older men experience reduced maximal and explosive force production capacity, with impairments in neural activation of select muscles. The authors (18) hypothesized that strength performance and functional reflex activity, or neuromuscular activation, in older adults must be trained complementarily.
LaRoche, Cremin, Greenleaf, and Croce (2010)
34
summed across muscle groups and examined independently, motor time was 22 ms longer (29%) in fallers. However, no differences in any variable were found between groups for the leg extensors or leg flexors, independently. The authors (30) hypothesized that neuromuscular as well as strength and RTD deficits in the ankle musculature may be present in those adults within the fall group. The authors further suggest that strength, speed of movement, and power of the ankle dorsiflexors and plantarflexors should be examined as potential contributors to falls in older adults.
Bento, Pereira, Ugrinowitsch, and Rodacki (2010)
36
RTD in the non-fallers than in the other two groups of fallers. However, there were no differences in knee flexor PT between GII and GIII (P>0.05). The authors (6) concluded that because RTD rather than PT was more closely related to falls among the older participant, exercises designed to develop muscle power may be more beneficial to reduce the risk of falls than exercises designed to improve strength.
Clark, Patten, Reid, Carabello, Phillips, and Fielding (2010)
(P<0.05), with the MH producing the greatest power followed by OH and OML (P<0.0001) groups. Normalized torque (expressed as a percentage of maximal voluntary contraction) in the OML was significantly lower than the MH and OH groups at 90, 180, and 240º/s (P<0.0001). Anterior compartment thigh muscle CSA was significantly greater in the MH group than the OH and OML groups (P<0.001). The OML group produced significantly less absolute power than both the MH and OH groups at each velocity (P<0.05). In contrast to agonist activation amplitude in MH and OH, which was positively associated with velocity (P<0.05), no significant associations were observed for OML (P>0.05). Furthermore, the rate of normalized quadriceps activation was significantly greater in the OH group compared to the OML (P=0.03), indicating that reduced activation may have contributed to mobility limitations. Additionally, there were significant correlations between agonist activation and torque production for all groups as velocity increased (r=0.56-0.62, P<0.001). The authors (11) suggested that impaired power and neuromuscular activation, specifically of the agonist muscle groups, may contribute to compromised mobility function in older adults.
Clark, Manini, Fielding, and Patten (2013)
The purpose of this investigation was to examine the extent to which maximum walking
38
CHAPTER III METHODOLOGY
Participants
Thirty-five (18-30 yrs) and 22 older males (65-74 yrs) were recruited from the University of North Carolina at Chapel Hill (UNC-CH) and the surrounding area. Participants were excluded if they accumulated more than 5 hours of exercise per week or had a current or recent injury of the low back, hip, knee, or ankle within the past three months, or a neuromuscular disease that may have affected their ability to produce maximum torque. Prior to any testing, participants completed a health history and exercise status questionnaire detailing various resistance and aerobic training modalities and the average time each week spent performing each activity, along with a written informed consent document approved by the University's Institutional Review Board.
Experimental Design
40 Familiarization Trial
During the familiarization trial, each participants height and body mass were measured using a stadiometer (Detecto, Webb City, MO, USA) and underwent a musculoskeletal ultrasound (US) assessment of their right medial gastrocnemius (MG) to examine muscle size and quality, fascicle length, and pennation angle. In addition, each participant practiced the isometric maximum strength testing protocol.
Isometric Maximal Voluntary Contraction
Isometric testing was conducted on a calibrated, HUMAC Norm dynamometer (Computer Sports Medicine Inc., Stoughton, MA, USA). All participants were seated at a 135° angle between the thigh and torso, measured using a handheld goniometer model G300 (Whitehall Manufacturing, City of Industry, CA, USA), with a Velcro restraining strap (90 mm width) across the thigh and the participants' arms crossed in front of their chest. The participants' right leg was fully extended (0° below the horizontal plane) with their foot secured in a thick rubber heel cup and held against a custom steel foot plate (36 x 17 cm) with straps over the toes and metatarsals (25 mm width), and the lateral malleolus of the fibula aligned with the axis of rotation of the dynamometer. The isometric strength testing was conducted at a neutral ankle joint angle (0˚ dorsiflexion). Each participant performed 2-3 maximal voluntary contractions (MVCs) with 2 min of recovery between trials. During each MVC, participants received strong verbal encouragement and instructed to plantarflex “as hard and fast as possible” for a total of 3-4 s (58).
Electromyography
bipolar surface electrodes (EL254S Biopac Systems, Santa Barbara, CA, USA) were placed on the prominent bulge of the medial gastrocnemius and at a 2/3 distance between the medial condyles of the femur to the medial malleolus for the soleus, parallel to the muscle fiber orientation in accordance with the SENIAM guidelines (22). A single, pre-gelled, disposable reference electrode was placed over the tibial tuberosity (Ag Cl Quinton Quick Prep; Quinton Instruments Co, Bothell, WA, USA).
Signal Processing
42
onset of the exponential phase (apex of the first trough). The instant of torque onset was confirmed by also displaying the first derivative of the torque-time curve, with any noticeable active baseline discarded from further analyses.
Ultrasound Assessment
the assessments, an adjustable strap was used to securely attach the right foot to a vertical post at a 90° joint angle between the foot and leg. All measurements were performed following a 10 min rest period to allow for any fluid shifts to occur (7). A generous amount (1 - 2 oz.) of hypoallergenic water-soluble transmission gel was applied to the skin to reduce possible near field artifacts and enhance acoustic coupling (Aquasonic 100, Parker Laboratories, Inc., Fairfield, NJ, USA). LogicView™ software (General Electric Company, Milwaukee, WI, USA) was used to generate real-time panoramic cross-sectional images of the MG, as previously in detail by Rosenberg et al. (46). Following each scan, each image was reviewed to ensure appropriate image quality.
Muscle Size and Quality Analysis
All US imaging analyses were performed using Image-J software (version 1.46r, National Institutes of Health, USA). Prior to analysis, each image was individually scaled from area in pixels to centimeters using the straight-line function. CSA of the MG were determined using the polygon function by selecting a region of interest that included as much of the muscle as possible without any surrounding fascia. EI was assessed by computer-aided gray-scale analysis using the standard histogram function. The same pre-selected region of interest used for the calculation of muscle CSA was used to determine the mean EI value and corresponding index of muscle quality ranging between 0 and 255 arbitrary units (a.u.) (black = 0; white = 255). Test-retest reliability for CSA and EI yielded intraclass-correlation coefficients (ICC2,1) of 0.95 and
0.77 for the young, and 0.88 and 0.65 for the older adults, respectively. Fascicle Length and Pennation Angle Analysis
44
of the MG, with the average FL used for subsequent analysis. PA was measured using the angle tool in Image-J and defined as the angle between muscle fibers and the deep aponeurosis for two separate fascicles, with the average PA used for subsequent analysis. Test-retest reliability for FL and PA yielded intraclass-correlation coefficients (ICC2,1) of 0.91 and 0.89 for the young, and
0.94 and 0.80 for the older adults, respectively. Statistical Analyses
CHAPTER IV RESULTS
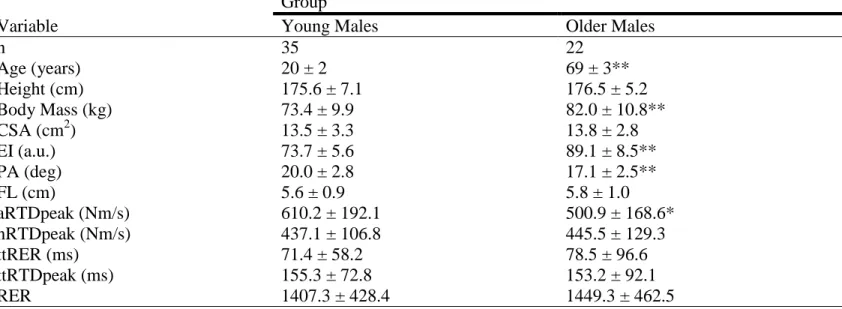
Thirty-five young (mean ± SD: age = 20 ± 2 years) and 22 older (age = 69 ± 3 years) males were used for statistical analyses. Body mass, EI, and age were significantly greater in the older males than the young males (P<0.001). CSA and nRTDpeak were not significantly different between groups (P=0.693 and P=0.789, respectively). PA and aRTDpeak were significantly lower in the older males than the young males (P<0.001 and P<0.05, respectively) (Table 1). Due to differences in body mass between groups, analyses of covariance (ANCOVAs) were used to examine differences in aRTDpeak and CSA between groups with body mass as the covariate and showed no difference (P=0.317) between groups for CSA, and a significant difference (P=0.001) between groups for aRTDpeak when controlling for body mass. The observed power value for aRTDpeak was 0.92.
46
respectively) to aRTDpeak (P=0.009, P=0.002 and P=0.011, respectively) when groups were combined (Table 4).
CHAPTER V DISCUSSION
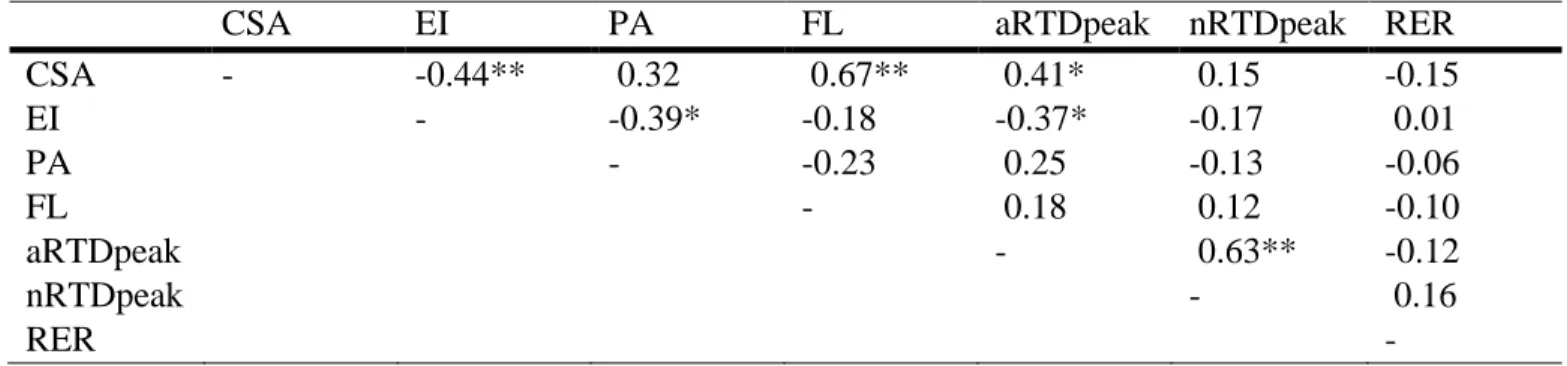
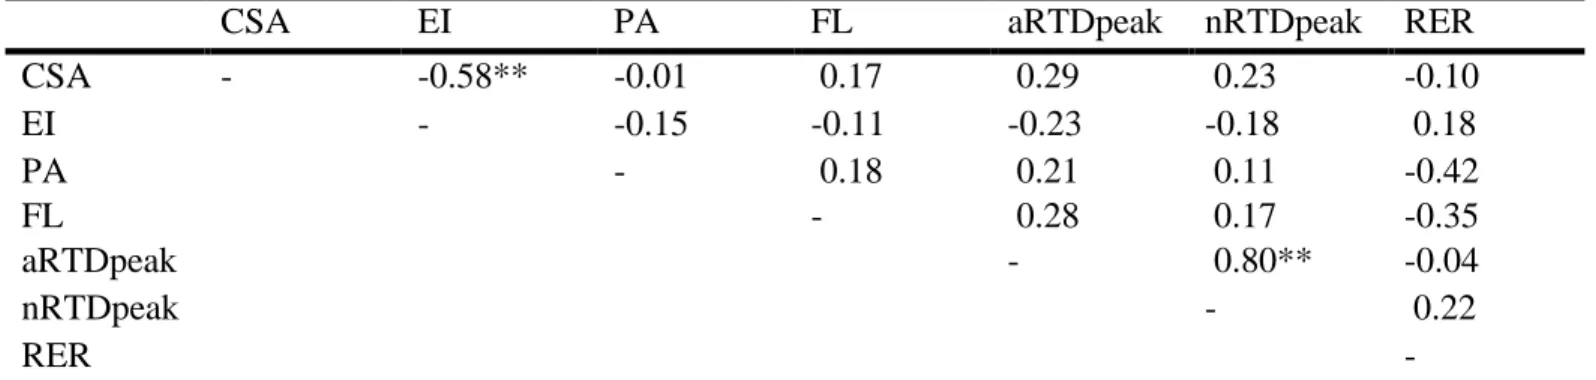
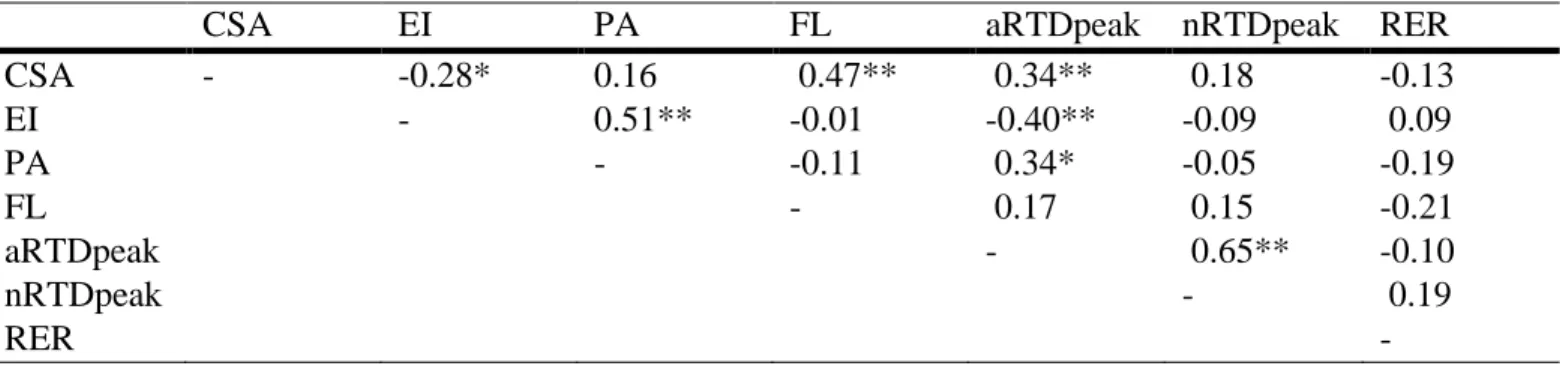
The main findings of the present study indicated the older men had lower aRTDpeak, a smaller PA, and poorer muscle quality (higher EI) when compared to the younger men. However, there were no age-related differences in nRTDpeak, CSA, FL, or RER. Furthermore, only CSA and EI of the MG were significantly correlated with aRTDpeak in the young group, no variables were correlated to aRTDpeak in the old, however, CSA, EI, and PA were related to aRTDpeak when both groups were combined. Groups were combined in order to provide a
larger sample size as well as assist in assessing collectively which variables contributed to aRTDpeak and nRTDpeak independent of age (60). In addition, CSA was the only significant
predictor of aRTDpeak in the young group while both CSA and PA had a significant cumulative effect on the prediction of aRTDpeak when young and older groups were combined. Taken together, these results illustrate that in addition to muscle size and architectural features which have previously been correlated to rapid torque production (4, 37), intrinsic qualitative features of the muscle (i.e. EI) may also correlate with these measures. The results of this study may contribute to our current understanding of underlying causes for age-related reductions in functional performance.
48
studies (approximately 62-67%, 37%, 64%, and 27-36%, respectively), the overall findings support those from the present study (18%). Differences in the magnitude of aRTDpeak may be due to differences in the muscles examined (i.e. thigh vs. calf) and activity status of participants. The present finding that the relative capacity for rapid torque production was preserved in older men for the plantar flexors is in agreement with previous studies examining the plantar flexors (54), dorsiflexors (54), leg flexors (56), and leg extensors (56). However, other previous studies have also reported that relative or normalized RTD is lower in the old when compared to the young men for the plantar flexors (55) and leg extensors (27). Similar to aRTDpeak, the conflicting results among previous studies for nRTDpeak may be due to the muscles assessed, as well as activity status. For example, because all of the older men in the current study were ambulatory and recreationally active, the degree muscular atrophy and fat and fibrous tissue infiltration in the GM may have been less than their older frail counterparts (1).
reduction of excitable muscle mass within a given CSA was observed between young (70%) and older (50%) men. The authors suggested that denervated and inactive fibers, particularly the larger type II fibers, along with the replacement of those fibers by fat and fibrous tissue, may be responsible for the decrease in fiber density. Similarly, in our study, the reduction in muscle quality as indicated by a greater EI in the older men despite no significant difference in muscle CSA illustrates that the replacement of type II muscle fibers with fat and fibrous tissue may have contributed to the lower aRTDpeak. The simultaneous increase in EI and lack of change in CSA is similar to the findings reported by McNeil et al. (35) who reported no differences in total CSA of the anterior compartment of the lower limb between young and older adults, but did reveal an increase in the non-contractile CSA in the older adults. With respect to the influence of contractile and non-contractile CSA on RTD, Wilhelm et al. (61) also reported a significant correlation between the individual quadriceps muscles EI and RTD during leg extension, but also stated that these correlations decrease at earlier time-points from the onset of contraction (<200ms). Given the functional implications for a reduction in RTD, it is important to note that Visser et al. (59) found that among older participants (70-79 years), increased intramuscular fat significantly increased the probability of developing mobility limitations, independent of muscle CSA, strength, or total body fat mass. These results indicate that older adults with a greater increase of intramuscular fat and/or connective tissue may be at increased risk of functional impairments.
50
reported significant differences between young and older groups for CSA, FL, and PA. These findings suggest that as muscle size decreases with age, FL and PA experience similar reductions. While actual fiber density may decline with age, a similar or even reduced CSA has been shown to result in no change in FL (32, 39). Therefore, it is possible that a reduction in PA, with no change in CSA or FL, may result in an increase in the vertical component of the muscle force vector (49). In contrast to our findings, Kubo et al. (28) reported no significant reduction in PA of the MG with increasing age. It is important to note however that these results were obtained from sedentary adults, likely with greater muscular atrophy than the adults used in our study. These findings present further evidence for why activity levels and health status should be taken into account when comparing age groups. Specifically, in order to better evaluate these age-related changes, healthy and recreationally active males from both young and older age groups must be assessed in order to reduce any changes that may have occurred from inactivity and disease (31, 40, 51).
5
2
Table 1: Physical characteristics and outcome variables for both young and older groups. (Mean ± SD)
Group
Variable Young Males Older Males
n
Age (years)
35 20 ± 2
22 69 ± 3**
Height (cm) 175.6 ± 7.1 176.5 ± 5.2
Body Mass (kg) 73.4 ± 9.9 82.0 ± 10.8**
CSA (cm2) 13.5 ± 3.3 13.8 ± 2.8
EI (a.u.) 73.7 ± 5.6 89.1 ± 8.5**
PA (deg) 20.0 ± 2.8 17.1 ± 2.5**
FL (cm) 5.6 ± 0.9 5.8 ± 1.0
aRTDpeak (Nm/s) 610.2 ± 192.1 500.9 ± 168.6* nRTDpeak (Nm/s)
ttRER (ms) ttRTDpeak (ms)
437.1 ± 106.8 71.4 ± 58.2 155.3 ± 72.8
445.5 ± 129.3 78.5 ± 96.6 153.2 ± 92.1
RER 1407.3 ± 428.4 1449.3 ± 462.5
CSA: Cross-sectional Area; EI: Echo Intensity; PA: Pennation Angle; FL: Fascicle Length; aRTDpeak: Absolute Peak Rate of Torque Development; nRTDpeak: Normalized Peak Rate of Torque Development; ttRER: Time to
Normalized Peak Rate of EMG Rise; ttRTDpeak: Time to Absolute Peak Rate of Torque Development; RER: Rate of EMG Rise
5
3
Table 2: Correlation coefficients between physical characteristics, RTD, and EMG variables of young males (n=35).
CSA EI PA FL aRTDpeak nRTDpeak RER CSA - -0.44** 0.32 0.67** 0.41* 0.15 -0.15
EI - -0.39* -0.18 -0.37* -0.17 0.01
PA - -0.23 0.25 -0.13 -0.06
FL - 0.18 0.12 -0.10
aRTDpeak - 0.63** -0.12
nRTDpeak - 0.16
RER -
CSA: Cross-sectional Area; EI: Echo Intensity; PA: Pennation Angle; FL: Fascicle Length; aRTDpeak: Absolute Peak Rate of Torque Development; nRTDpeak: Normalized Peak Rate of Torque Development; RER: Rate of EMG Rise
5
4
Table 3: Correlation coefficients between physical characteristics, RTD, and EMG variables of older males (n=22).
CSA EI PA FL aRTDpeak nRTDpeak RER
CSA - -0.58** -0.01 0.17 0.29 0.23 -0.10
EI - -0.15 -0.11 -0.23 -0.18 0.18
PA - 0.18 0.21 0.11 -0.42
FL - 0.28 0.17 -0.35
aRTDpeak - 0.80** -0.04
nRTDpeak - 0.22
RER -
CSA: Cross-sectional Area; EI: Echo Intensity; PA: Pennation Angle; FL: Fascicle Length; aRTDpeak: Absolute Peak Rate of Torque Development; nRTDpeak: Normalized Peak Rate of Torque Development; RER: Rate of EMG Rise
5
5
Table 4: Correlation coefficients between physical characteristics, RTD, and EMG variables of all participants (n=57).
CSA EI PA FL aRTDpeak nRTDpeak RER CSA - -0.28* 0.16 0.47** 0.34** 0.18 -0.13
EI - 0.51** -0.01 -0.40** -0.09 0.09
PA - -0.11 0.34* -0.05 -0.19
FL - 0.17 0.15 -0.21
aRTDpeak - 0.65** -0.10
nRTDpeak - 0.19
RER -
CSA: Cross-sectional Area; EI: Echo Intensity; PA: Pennation Angle; FL: Fascicle Length; aRTDpeak: Absolute Peak Rate of Torque Development; nRTDpeak: Normalized Peak Rate of Torque Development; RER: Rate of EMG Rise
5
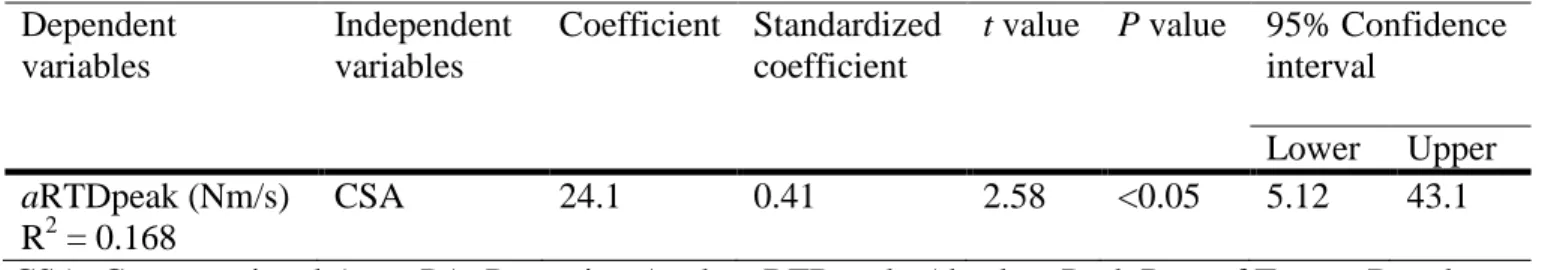
6
Table 5: Factors associated with aRTDpeak on stepwise regression analysis among young males (n=35)
Dependent variables
Independent variables
Coefficient Standardized coefficient
t value P value 95% Confidence
interval
Lower Upper
aRTDpeak (Nm/s) CSA 24.1 0.41 2.58 <0.05 5.12 43.1 R2 = 0.168
5
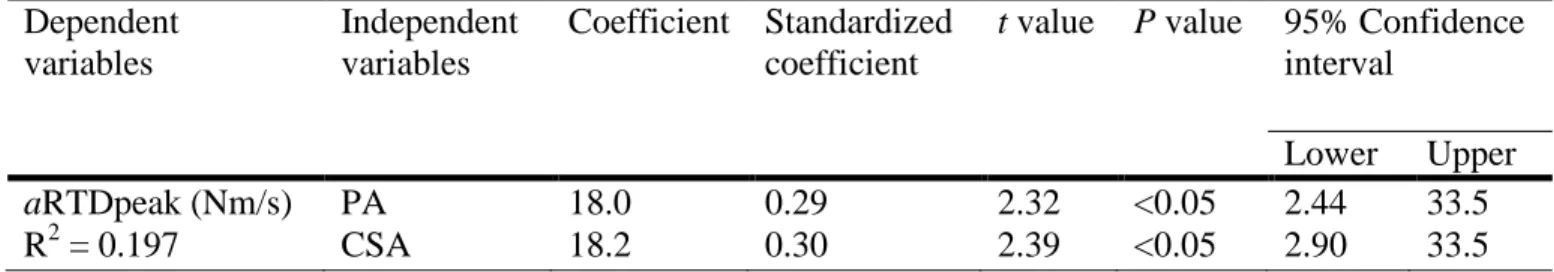
7
Table 6: Factors associated with aRTDpeak on stepwise regression analysis among all participants (n=57)
Dependent variables
Independent variables
Coefficient Standardized coefficient
t value P value 95% Confidence
interval
Lower Upper
58 REFERENCES
1. Aagaard P, Magnusson PS, Larsson B, Kjaer M, Krustrup P. Mechanical muscle function, morphology, and fiber type in lifelong trained elderly. Med Sci Sports Exerc 2007;39:1989-1996.
2. Ahtiainen JP, Hoffren M, Hulmi JJ, Pietikäinen M, Mero AA, Avela J, et al. Panoramic ultrasonography is a valid method to measure changes in skeletal muscle cross-sectional area. Eur J Appl Physiol 2010;108:273-279.
3. Andersen LL, Andersen JL, Zebis MK, Aagaard P. Early and late rate of force development: differential adaptive responses to resistance training? Scand J Med Sci Sports 2010;20(1):e162-e169.
4. Andersen LL, Aagaard P. Influence of maximal muscle strength and intrinsic muscle contractile properties on contractile rate of force development. Eur J Appl Physiol 2006;96:46-52.
5. Arts I, Pillen S, Schelhaas HJ, Overeem S, Zwarts MJ. Normal values for quantitative muscle ultrasonography in adults. Muscle Nerve 2010;41:32-41.
6. Bento PCB, Pereira G, Ugrinowitsch C, Rodacki ALF. Peak torque and rate of torque development in elderly with and without fall history. Clin Biomech 2010;25(5):450-454. 7. Berg HE, Tedner B, Tesch PA. Changes in lower limb muscle cross-sectional area and tissue
fluid volume after transition from standing to supine. Acta Physiol Scand 1993;148:379-385.
8. Bottinelli R, Pellegrino MA, Canepari M, Rossi R, Reggiani C. Specific contributions of various muscle fibre types to human muscle performance: an in vitro study. J Electromyogr Kinesiol 1999;9:87-95.
9. Cadore EL, Izquierdo M, Conceição M, Radaelli R, Pinto RS, Baroni BM, et al. Echo intensity is associated with skeletal muscle power and cardiovascular performance in elderly men. Exp Gerontol 2012;47:473-478.
10. Clark DJ, Patten C, Reid KF, Carabello RJ, Phillips EM, Fielding RA. Muscle performance and physical function are associated with voluntary rate of neuromuscular activation in older adults. J Gerontol A Biol Sci Med Sci 2011;66(1):115-121.