. . . .
. . . .
Cardiac structure and function and leisure-time
physical activity in the elderly: The
Atherosclerosis Risk in Communities Study
Sheila M. Hegde
1, Alexandra Gonc¸alves
1,2, Brian Claggett
1, Kelly R. Evenson
3,
Susan Cheng
1, Amil M. Shah
1, Aaron R. Folsom
4, and Scott D. Solomon
1*
1
Cardiovascular Division, Brigham and Women’s Hospital, Harvard Medical School, 75 Francis St, Boston, MA, USA;2
Department of Physiology and Cardiovascular Surgery, University
of Porto Medical School, Porto, Portugal;3
Department of Epidemiology, Gillings School of Global Public Health, University of North Carolina-Chapel Hill, NC, USA; and4
Division of Epidemiology and Community Health, School of Public Health, University of Minnesota, Minneapolis, MN, USA
Received 23 October 2015; revised 11 December 2015; accepted 2 March 2016
Aims Adults who engage in leisure-time physical activity (LTPA) have a reduced risk of developing heart failure. We hypothe-sized that high levels of LTPA are associated with diminished adverse age-related changes in cardiac structure and function.
Methods and results
We studied 4342 Atherosclerosis Risk in Communities Study participants free of cardiovascular disease who under-went standardized echocardiography. In a cross-sectional analysis, we related LTPA (poor, intermediate, or ideal) to cardiac structure and function. We also related cumulative average LTPA over 24 years and changes in LTPA categories to echocardiographic measures. Cross-sectional analysis demonstrated that ideal LTPA, compared with poor LTPA, was associated with better diastolic function [prevalence of normal diastolic function: 39.8% vs. 31.5%,P,0.001; mean E/E′ratio (95% CI): 9.8 (9.6, 9.9) vs. 10.4 (10.2, 10.5),P¼0.001] and better systolic function [left-ventricular (LV) longitudinal strain:218.3 (218.4,218.2) vs.217.9 (218.0,217.8),P,0.001] after adjusting for age, sex, race, and centre. Higher cumulative average LTPA over 24 years or an improvement in LTPA category were also, re-spectively, related to a more favourable E/E′ratio (P,0.0001,P¼0.004) and longitudinal LV strain (P¼0.0002,
P¼0.002).
Conclusion Ideal LTPA, higher average levels of LTPA over a 24-year period, and an improvement in LTPA even later in life were associated with more favourable indices of LV diastolic and systolic function in older adults. Sustaining higher levels of LTPA, and even increasing physical activity later in life, may be beneficial for older adults in attenuating expected age-related changes in cardiac structure and function.
-Keywords Exercise † Leisure-time physical activity † Echocardiography † Elderly
Introduction
Participation in leisure-time physical activity (LTPA) has been asso-ciated with lower incident heart failure in several populations,1–6
including in the elderly Atherosclerosis Risk in Communities (ARIC) Study participants.1The mechanisms by which physical
ac-tivity reduces the risk of heart failure are likely multifactorial with many downstream effects at the molecular and cellular level ultim-ately resulting in changes in cardiac structure and function.7Much of
what is known about cardiac remodelling in response to exercise
comes from studies in trained athletes. The cardiac response to ex-ercise in the elderly, however, is less well studied.
Longitudinal data from the Framingham population demonstrate that the cardiac remodelling associated with ageing is characterized by increasing LV wall thickness, decreasing LV dimensions, and increasing fractional shortening.8Furthermore, age has been asso-ciated with a rising prevalence and progression of diastolic dysfunc-tion.9These age-related changes in cardiac structure and function, including age-related diastolic dysfunction, have been associated with the incidence of heart failure in older age.9Recommendations
*Corresponding author. Tel:+1 857 307 1960, Fax:+1 857 307 1944, Email:[email protected]
Published on behalf of the European Society of Cardiology. All rights reserved.&The Author 2016. For permissions please email: [email protected].
for exercise in those with heart failure10are based on previously de-monstrated improvements in functional capacity, peak myocardial oxygen consumption, and quality of life. Regular physical activity may also play an important role in mitigating the changes in cardiac structure and function that occur with ageing and precede the de-velopment of heart failure. We hypothesized that high levels of LTPA are associated with diminished adverse age-related changes in cardiac structure and function. To test this hypothesis, we as-sessed measures of cardiac structure and function in relation to LTPA measured at the time of echocardiography and over the 24-year course of study of the elderly ARIC population.
Methods
Study design and population
The ARIC study has been described previously.11The intent of the
ARIC Study was to identify the causes and outcomes of atherosclerosis. Initial enrolment (1987 – 89) included 15 792 participants aged 45 – 64 years from four communities: Forsyth County, NC; Jackson, MS; subur-ban Minneapolis, MN; and Washington County, MD. These adults participated in four serial examinations at3-year intervals. A fifth examination of 6538 participants was conducted between 1 June 2011 and 30 August 2013; this exam included physical activity question-naires and echocardiograms in all participants. Physical activity was also assessed at Visits 1 (1987 – 89) and 3 (1993 – 95). Our study sample included all patients who underwent echocardiography during Visit 5 with images of acceptable quality for analysis (n¼6118). Those ex-cluded were those with prevalent cardiovascular disease [coronary heart disease (CHD), stroke, heart failure, severe valvular disease] (n¼1626) and those with missing physical activity data at Visit 5 (n¼138). Twelve remaining participants who were not white or black were also excluded from the study. The final analytic sample population included 4342 participants.
Leisure-time physical activity
Participants completed an interviewer-administered modified Baecke Physical Activity questionnaire at Visits 1, 3, and 5,12and this analysis fo-cused on the sports questions. A composite measure was calculated using up to four sports or exercises that participants reported in the past year along with categorical choices of usual frequency and duration for each sport/exercise. The activities were assigned a metabolic equiva-lent (MET) value13to classify intensity as moderate or vigorous activity; duration and frequency were multiplied to obtain minutes per week of moderate or vigorous activity. Physical activity was further defined ac-cording to the analysis. The reliability and validity of the modified Baecke Physical Activity questionnaire have been previously evaluated, and the questionnaire performs similarly to other physical activity instru-ments.14Good correlation between sport activity and 48 h physical ac-tivity records in men and women (r¼0.73,r¼0.63, respectively) and peak oxygen consumption by VO2peak (r¼0.67,r¼0.45, respective-ly) has been previously demonstrated within the ARIC cohort.15
Cross-sectional analysis leisure-time physical activity categories
Minutes per week of moderate or vigorous activity were converted to intensity categories of LTPA (poor, intermediate, and ideal) in rela-tion to the American Heart Associarela-tion (AHA) recommended levels due to the skewness of the variable as previously described in other ARIC studies.1Ideal LTPA was defined as≥150 min/week of moder-ate activity,≥75 min/week of vigorous activity, or≥150 min/week of
moderate+vigorous activity. Intermediate LTPA was defined as 1 – 149 min/week of moderate activity, 1 – 74 min/week of vigorous activity, or 1 – 149 min/week of moderate+vigorous activity. Poor LTPA was defined as 0 min/week of moderate+vigorous activity.
Cumulative average leisure-time physical activity over 24 years
Cumulative LTPA over the 24-year course of the study was measured as a continuous index. Metabolic equivalent values using the updated com-pendium of physical activities16were multiplied by usual duration and frequency to obtain estimated total MET-minutes per week of sport activity.
Change in leisure-time physical activity category over 18 years
We also categorized the change in AHA-assigned LTPA categories be-tween Visit 3 (1993 – 95) and Visit 5 (2011 – 13) as persistently poor ac-tivity, decreased acac-tivity, increased acac-tivity, or persistently active. Those who maintained either intermediate or ideal LTPA over both visits were categorized as persistently active, and those who maintained poor LTPA over both visits were categorized as persistently poor activity. Those who increased or decreased their activity level from one AHA category to another were categorized accordingly.
Echocardiography protocol
Details of the echocardiographic imaging and analysis protocol have been thoroughly described.17All echocardiograms were acquired dur-ing Visit 5 with a dedicated machine (Phillips iE33 Ultrasound systems with Vision 2011) according to a detailed acquisition protocol that in-cluded comprehensive two-dimensional, Doppler, tissue Doppler, and speckle-tracking echocardiography.17Dedicated and blinded analysts at the Brigham and Women’s Hospital Cardiac Imaging Core Laboratory performed quantitative measures on all echocardiograms according to American Society of Echocardiography (ASE) recommendations.18
Car-diac structure measurements included left-ventricular (LV) end-diastolic volume index (LVEDVi), right-ventricular end-diastolic area index (RVE-DAi), left-atrial volume index (LAVi), LV mass index (LVMi), and relative wall thickness (RWT). Left-ventricular dimensions and mass were in-dexed to body surface area as per ASE guidelines. Left-ventricular hypertrophy (LVH) was defined as LV mass index.115 g/m2in men or.95 g/m2in women. Left-ventricular geometry was categorized as normal, concentric remodelling (RWT.0.42, normal LVMi), concen-tric hypertrophy (RWT.0.42, elevated LVMi), or eccentric hyper-trophy (RWT,0.42, elevated LVMi). Cardiac function measurements included LV ejection fraction (LVEF), longitudinal LV strain, RV fractional area change (RV FAC), and tricuspid annulus peak systolic velocity (TAPSV). Diastolic indices included peak early transmitral (E-wave) vel-ocity, peak late transmitral (A-wave) velvel-ocity, E-wave deceleration time, and lateral mitral annular early relaxation velocity (E′); diastolic function was classified by Olmsted criteria.19
Covariates
was defined as per American Thoracic Society guidelines.21Fasting plas-ma total cholesterol, low-density lipoprotein, and high-density lipopro-tein levels were measured in a central laboratory, and results from Visit 5 were analysed for this study.22N-terminal pro B-type natriuretic
peptide (NT-proBNP) levels were also measured at Visit 5 using elec-trochemiluminescent immunoassay (Roche Diagnostics) with a lower detection limit≤5 pg/mL.23
Statistical analyses
Descriptive statistics for the sample by LTPA category at Visit 5 are pre-sented as means+standard deviation, proportions, or medians [inter-quartile range (IQR)] for skewed variables. We related AHA-assigned LTPA category at Visit 5 to echocardiographic measures at Visit 5 in a sectional analysis. In addition and complementary to the cross-sectional analysis, we also conducted analysis of the cumulative average LTPA over 24 years and change in LTPA category from Visit 3 to Visit 5 in relation to cardiac structure and function.
Cross-sectional analysis
Echocardiographic variables were compared for trend by LTPA cat-egory using multivariable linear or logistic regression, as appropriate. All multivariable regression models were adjusted for age, sex, race, and field centre. Continuous echocardiographic variables are presented as adjusted means+standard error and categorical variables are pre-sented with adjusted prevalence.
Significant correlates were tested for interaction by sex, race, educa-tion, and prevalent hypertension. Additional covariates (resting heart rate, BMI, diabetes, hypertension) were considered as mediators in the relationship between LTPA and cardiac structure and function and were therefore not included in the multivariable models. Because of low participation rates during ARIC Visit 5, we also repeated these analyses using inverse probability weights24to account for the propensity of par-ticipants to attend Visit 5 with results also provided in the Supplemen-tary material online.
Cumulative average leisure-time physical activity analysis
Total cumulative average LTPA in MET-minutes per week was calcu-lated accounting for the time intervals between Visits 1, 3, and 5 for each participant. We estimated the average amount of activity during the interval between subsequent visits by averaging the activity obtained at the beginning and end of each interval. Missing physical activity data were relatively few (n¼268). Any missing values were imputed using the average of available values from neighbouring visits. Linear and curvi-linear associations between cumulative average LTPA and measures of cardiac structure and function were analysed using adjusted restricted cubic spline models and linear regression models adjusted for age, sex, race, and centre.
Change in leisure-time physical activity category analysis
Echocardiographic variables between groups (poor activity, decreased activity, increased activity, or persistently active) were compared rela-tive to the persistently poor activity group by multivariable linear or lo-gistic regression, as appropriate. Sensitivity analysis stratifying the persistently active group into those with persistently intermediate and persistently ideal LTPA was performed with results provided in Supple-mentary material online.
Best fit linear and curvilinear models were determined using the Akaike information criterion. A two-sidedP-value of,0.05 was consid-ered statistically significant. All statistical analyses were performed using Stata Software (version 13, Stata Corp., College Station, TX, USA).
Results
Cross-sectional analysis
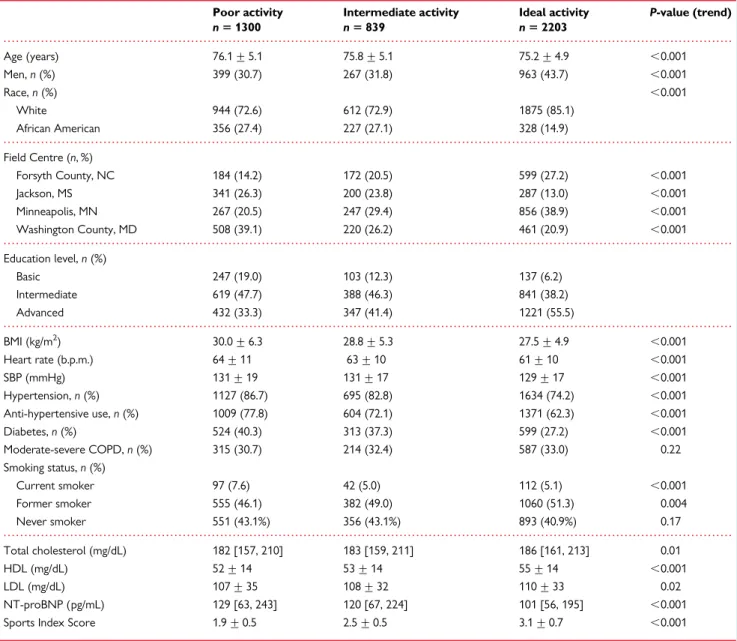
Population characteristicsAfter excluding those with prevalent cardiovascular and valvular dis-ease, 4342 participants were evaluated at Visit 5. Overall, 62.5% of par-ticipants were women, 79% were Caucasian, and the mean age was 75.6+5 years (Table1). The majority of the population met criteria for ideal LTPA (50.7%,n¼2203) while 19.3% (n¼839) were cate-gorized as having intermediate LTPA, and 29.9% (n¼1300) were ca-tegorized as having poor LTPA. Participants in Forsyth County, NC and Minneapolis, MN were more likely to have ideal LTPA while par-ticipants in Jackson, MS and Washington County, MD were more likely to have poor LTPA (Table1). Participants who were more active had on average higher education, lower BMI, lower prevalence of hyper-tension, less anti-hypertensive medication use, lower heart rates, and a lower prevalence of diabetes. There was no significant difference in the presence of moderate–severe COPD among LTPA categories despite a higher prevalence of current smokers in the poor LTPA cat-egory. Nearly half of the sample population represented former smo-kers with 243 participants (5.7%) with unknown smoking status. Those who met criteria for ideal LTPA had lower median NT-proBNP levels.
Cardiac structure and function
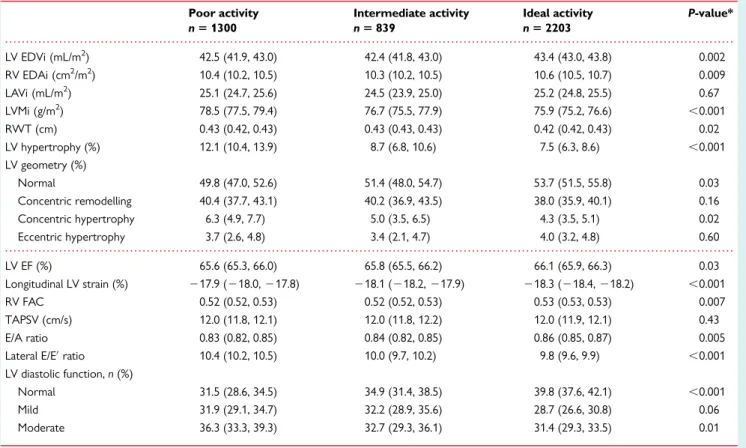
At Visit 5, ideal LTPA was associated with a significantly lower LV mass index [75.9 (75.2, 76.6) vs. 78.5 g/m2(77.5, 79.4),P,0.001] and lower prevalence of LVH (7.5 vs. 12.1%,P,0.001) compared with those with poor LTPA after adjusting for age, sex, race, and centre (Table2). Conventional measures of systolic function, such as resting LVEF and RV fractional area change, were clinically similar between LTPA groups; however, LV longitudinal strain was more favourable in those with ideal LTPA [218.3 (218.4, 218.2) vs. 217.9 (218.0,217.8),P,0.001]. Measures of diastolic function [E/A ratio: 0.86 (0.85, 0.87) vs. 0.83 (0.82, 0.85),P¼0.005; E/E′ratio: 9.8+0.1 vs. 10.4+0.1,P,0.001] were more favourable in those with ideal LTPA compared with those with poor LTPA. Ideal LTPA was also associated with a higher prevalence of normal diastolic function (39.8 vs. 31.5%,P,0.001) and a lower prevalence of mod-erate diastolic dysfunction (31.4 vs. 36.3%,P¼0.01) than those with poor LTPA at Visit 5. None of the participants demonstrated dia-stolic indices consistent with severe diadia-stolic dysfunction.
Sensitivity analysis demonstrated no significant effect modifica-tion by sex, race, educamodifica-tion, or prevalent hypertension. In sensitivity analyses intended to generalize results to all eligible Visit 5 ARIC participants, our major findings remained unchanged (Supplemen-tary material online,Tables S1andS2).
Cumulative average leisure-time physical
activity analysis
The median cumulative average LTPA was 602.5 MET-min/week [IQR: 239.5, 1089.8]. The majority of participants remained active over all three visits with median total LTPA as follows: Visit 1—470.1 MET-min/week [IQR: 0.0, 1075.7]; Visit 3—546.7 MET-MET-min/week [IQR: 0.0, 1096.7], and Visit 5—633.4 MET-min/week [IQR: 0.0, 1306.8].
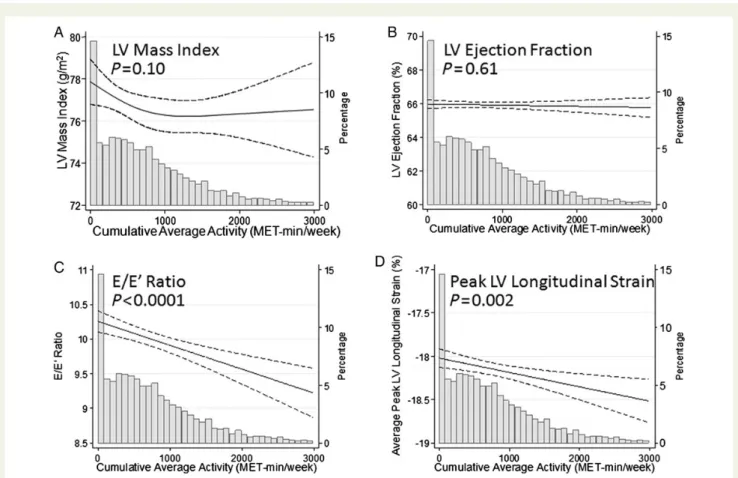
amounts of activity despite no significant difference in LVEF across the range of leisure activity (Figure1). Higher average LTPA was also associated with favourable diastolic function (E/E′ ratio: P, 0.0001). Left-ventricular mass index, however, showed an inverse association with average LTPA only at low levels (Figure1). Curvilin-ear models also demonstrated larger cardiac chamber dimensions (LVEDVi:P,0.0001; RVEDAi:P,0.0001; LAViP¼0.02) with higher average LTPA (Supplementary material online,Figure S1).
Change in leisure-time physical activity
category analysis
Of the 4342 participants analysed, 4149 had available LTPA data at both Visits 3 and 5. The majority of participants maintained
intermediate or ideal activity LTPA (36.0%,n¼1494) or increased their LTPA category (27.3%,n¼1134). The remaining population decreased their LTPA category (21.5%,n¼894) or maintained per-sistently poor activity over 18 years (15.1%,n¼627).
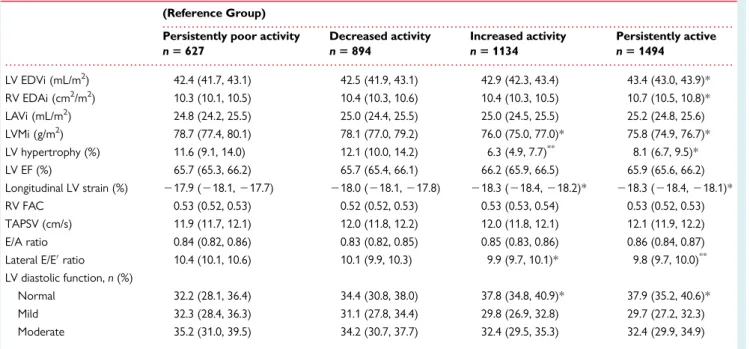
Participants who remained active over 18 years demonstrated a lower LV mass index and a lower prevalence of LVH compared with those with persistently poor activity after controlling for age, gender, race, and centre (Table3). Systolic function measured by LV longitudinal strain was more favourable in the persistently active [218.3 (218.4,218.1) vs.217.9 (218.1,217.7),P¼0.001] and increased activity groups [218.3 (218.4,218.2) vs.217.9 (218.1, 217.7),P¼0.002] compared with the persistently poor activity groups. Furthermore, diastolic function measured by the E/E′ratio
. . . .
. . . .
. . . .
. . . .
. . . .
Table 1 Sample characteristics at Visit 5 (2011 – 2013) by physical activity level, ARIC
Poor activity Intermediate activity Ideal activity P-value (trend)
n51300 n5839 n52203
Age (years) 76.1+5.1 75.8+5.1 75.2+4.9 ,0.001 Men,n(%) 399 (30.7) 267 (31.8) 963 (43.7) ,0.001
Race,n(%) ,0.001
White 944 (72.6) 612 (72.9) 1875 (85.1) African American 356 (27.4) 227 (27.1) 328 (14.9)
Field Centre (n, %)
Forsyth County, NC 184 (14.2) 172 (20.5) 599 (27.2) ,0.001 Jackson, MS 341 (26.3) 200 (23.8) 287 (13.0) ,0.001 Minneapolis, MN 267 (20.5) 247 (29.4) 856 (38.9) ,0.001 Washington County, MD 508 (39.1) 220 (26.2) 461 (20.9) ,0.001
Education level,n(%)
Basic 247 (19.0) 103 (12.3) 137 (6.2) Intermediate 619 (47.7) 388 (46.3) 841 (38.2) Advanced 432 (33.3) 347 (41.4) 1221 (55.5)
BMI (kg/m2) 30.0+6.3 28.8+5.3 27.5+4.9 ,0.001 Heart rate (b.p.m.) 64+11 63+10 61+10 ,0.001 SBP (mmHg) 131+19 131+17 129+17 ,0.001 Hypertension,n(%) 1127 (86.7) 695 (82.8) 1634 (74.2) ,0.001 Anti-hypertensive use,n(%) 1009 (77.8) 604 (72.1) 1371 (62.3) ,0.001 Diabetes,n(%) 524 (40.3) 313 (37.3) 599 (27.2) ,0.001 Moderate-severe COPD,n(%) 315 (30.7) 214 (32.4) 587 (33.0) 0.22 Smoking status,n(%)
Current smoker 97 (7.6) 42 (5.0) 112 (5.1) ,0.001 Former smoker 555 (46.1) 382 (49.0) 1060 (51.3) 0.004 Never smoker 551 (43.1%) 356 (43.1%) 893 (40.9%) 0.17
Total cholesterol (mg/dL) 182 [157, 210] 183 [159, 211] 186 [161, 213] 0.01 HDL (mg/dL) 52+14 53+14 55+14 ,0.001 LDL (mg/dL) 107+35 108+32 110+33 0.02 NT-proBNP (pg/mL) 129 [63, 243] 120 [67, 224] 101 [56, 195] ,0.001 Sports Index Score 1.9+0.5 2.5+0.5 3.1+0.7 ,0.001
Numbers represent mean+standard deviation or median [interquartile range] for continuous variables andn(%) for categorical variables. Education levels described as: Basic
(≤grade 11), Intermediate (≥grade 12 or vocational school), Advanced (college or graduate school).
was more favourable in those who were persistently active [9.8 (9.7, 10.0) vs. 10.4 (10.1, 10.6),P≤0.001] and those who increased their activity [9.9 (9.7, 10.1) vs. 10.4 (10.1, 10.6),P¼0.004] compared with those with persistently poor activity. Participants who were persistently active (37.9 vs. 32.2%,P¼0.03) and those who became more active (37.8 vs. 32.2%,P¼0.04) had a greater prevalence of normal diastolic function compared with those with persistently poor activity.
Discussion
This study demonstrates a relationship between higher amounts of LTPA and favourable indices of LV diastolic and systolic function in a large elderly cohort. Moreover, we found that staying active or be-coming physically active is more strongly associated with favourable measures of cardiac structure and function than not participating in LTPA.
Previous large population studies have demonstrated that normal ageing leads to decreased cardiac chamber dimensions, increased LV wall thickness, and increased fractional shortening.8Invasive haemo-dynamic measurements suggest that an increase in LV stiffness oc-curs between ages 50 and 64 after which LV dimensions decline and remodelling occurs.25Exercise, however, may be one means to counteract these changes. In small cohorts, several groups have
demonstrated that LV compliance resembles a more youthful pattern in those who maintain high-level exercise, yet whether echocardiographic-based measures of diastolic function change in non-athletes who take up exercise remains inconclusive.26,27
In this large elderly cohort, those with higher LTPA demonstrated better diastolic indices than their inactive counterparts. This appar-ent benefit was observed in those who had remained active since middle age, whether by AHA recommended levels or by cumulative average activity, and among those who had increased their activity. These cross-sectional findings mirror prior results in which age-associated changes in ventricular relaxation were reduced by endurance activity.28However, our findings are in contrast to recent observations from the Framingham population in which there was no association with physical activity and E/E′ratios,29which may re-flect differences in the populations studied; age-related changes in diastolic function are less likely to have developed in this younger cohort. Although the differences in diastolic indices between activity levels are modest in this ARIC sample, the trend towards more fa-vourable diastolic function supports the hypothesis of attenuation of age-related changes with exercise. These results may provide insight into the lower incidence of heart failure seen with exercise in the ARIC sample,1a finding that may be consistent with the modestly lower NT-proBNP values seen in those with ideal LTPA in this and other studies.30Additional studies are needed to evaluate the
. . . .
. . . .
Table 2 Cardiac structure and function by physical activity level at Visit 5 (2011 – 2013), ARIC
Poor activity Intermediate activity Ideal activity P-value*
n51300 n5839 n52203
LV EDVi (mL/m2) 42.5 (41.9, 43.0) 42.4 (41.8, 43.0) 43.4 (43.0, 43.8) 0.002 RV EDAi (cm2/m2) 10.4 (10.2, 10.5) 10.3 (10.2, 10.5) 10.6 (10.5, 10.7) 0.009 LAVi (mL/m2) 25.1 (24.7, 25.6) 24.5 (23.9, 25.0) 25.2 (24.8, 25.5) 0.67 LVMi (g/m2) 78.5 (77.5, 79.4) 76.7 (75.5, 77.9) 75.9 (75.2, 76.6) ,0.001 RWT (cm) 0.43 (0.42, 0.43) 0.43 (0.43, 0.43) 0.42 (0.42, 0.43) 0.02 LV hypertrophy (%) 12.1 (10.4, 13.9) 8.7 (6.8, 10.6) 7.5 (6.3, 8.6) ,0.001 LV geometry (%)
Normal 49.8 (47.0, 52.6) 51.4 (48.0, 54.7) 53.7 (51.5, 55.8) 0.03 Concentric remodelling 40.4 (37.7, 43.1) 40.2 (36.9, 43.5) 38.0 (35.9, 40.1) 0.16 Concentric hypertrophy 6.3 (4.9, 7.7) 5.0 (3.5, 6.5) 4.3 (3.5, 5.1) 0.02 Eccentric hypertrophy 3.7 (2.6, 4.8) 3.4 (2.1, 4.7) 4.0 (3.2, 4.8) 0.60
LV EF (%) 65.6 (65.3, 66.0) 65.8 (65.5, 66.2) 66.1 (65.9, 66.3) 0.03 Longitudinal LV strain (%) 217.9 (218.0,217.8) 218.1 (218.2,217.9) 218.3 (218.4,218.2) ,0.001 RV FAC 0.52 (0.52, 0.53) 0.52 (0.52, 0.53) 0.53 (0.53, 0.53) 0.007 TAPSV (cm/s) 12.0 (11.8, 12.1) 12.0 (11.8, 12.2) 12.0 (11.9, 12.1) 0.43 E/A ratio 0.83 (0.82, 0.85) 0.84 (0.82, 0.85) 0.86 (0.85, 0.87) 0.005 Lateral E/E′ratio 10.4 (10.2, 10.5) 10.0 (9.7, 10.2) 9.8 (9.6, 9.9) ,0.001 LV diastolic function,n(%)
Normal 31.5 (28.6, 34.5) 34.9 (31.4, 38.5) 39.8 (37.6, 42.1) ,0.001 Mild 31.9 (29.1, 34.7) 32.2 (28.9, 35.6) 28.7 (26.6, 30.8) 0.06 Moderate 36.3 (33.3, 39.3) 32.7 (29.3, 36.1) 31.4 (29.3, 33.5) 0.01
Values represent adjusted means (95% confidence interval) for continuous variables and adjusted prevalence (95% confidence interval) for categorical variables. EDAi, end-diastolic area index; EDVi, end-diastolic volume index; EF, ejection fraction; FAC, fractional area change; LAVi, left-atrial volume index; LV, left ventricle; LVMi, left-ventricular mass index; RV, right ventricle; RWT, relative wall thickness; TAPSV, tricuspid annular peak systolic velocity.
progression of diastolic function with age and exercise and the rela-tionship with associated sequelae.
Our findings also demonstrate a higher LV mass index and a high-er prevalence of LVH in those with poor LTPA and in those with persistently poor activity compared with those who were active or increased their activity. While regular vigorous athlete-level ac-tivity is typically associated with increased LV mass as seen in the athlete’s heart, ageing and hypertension are also associated with in-creased LV mass and hypertrophy.8,31,32Despite a higher preva-lence of hypertension in those that were poorly active, no significant interaction was observed between physical activity and prevalent hypertension to suggest synergism between these two risk factors. The higher LV mass index and prevalence of LVH in those who were poorly active may, however, be explained by a dif-ferent mechanism. Several focused studies have reported a para-doxical effect of exercise on LV mass in those with hypertension; in these studies, those with regular physical activity had a lower risk of developing LVH compared with sedentary participants with hypertension.33–35In this elderly hypertensive population, regular activity may have played a role in preventing the expected increase in LV mass seen in hypertensive and athletic cohorts.
Increased global strain has been suggested to be a more sensitive marker of subclinical changes in systolic function and predictive of
adverse cardiovascular outcomes than are traditional measures of systolic function, such as LVEF.36–38While there was no clinically significant association between LVEF and LTPA, LV longitudinal strain was significantly more favourable in those who stayed active or increased their LTPA category. Although modest in magnitude, the trend towards favourable LV longitudinal strain suggests that regular exercise could potentially help preserve systolic function in this older population.
Despite the large size of our cohort, our findings did not demon-strate any clinically significant differences in LV dimensions, LA dimensions, RV dimensions, or RV systolic function by LTPA cat-egory. While cardiac chambers may dilate as a physiological adapta-tion to intensive exercise in elite athletes,31,39we did not observe clinically significant associations in an elderly population of non-athletes when evaluated at Visit 5 or in those who increased their activity. However, those who maintained higher average physical ac-tivity over 24 years demonstrated modestly larger LV, RV, and LA dimensions, likely reflecting changes expected in a more athletic population or perhaps reflecting deceleration of the expected de-cline in cardiac dimensions with age.
Several limitations of this analysis should be noted. Due to the ob-servational nature of this study, we can only describe association and cannot infer causality, and despite adjusting for covariates, we
cannot rule out the possibility of residual confounding or reverse causality. Measures of cardiac structure and function were only ob-tained at Visit 5, which also limits conclusions about causality. The questionnaire used to measure physical activity, as a self-reported variable, is subject to recall error and possible over-reporting of ac-tivity, which is likely to bias observed associations towards the null. The evaluation of Visit 5 participants in a longitudinal study over 24 years likely introduces a survival bias, and the remaining cohort may represent a more highly active, healthier elderly population than is typical for this age range although sensitivity analysis for attrition showed that findings remained unchanged. We also acknowledge that those in the persistently active group over Visits 3 and 5 may be better evaluated if stratified by persistently ideal or persistently intermediate activity subgroups; however, sensitivity analysis did not demonstrate significant differences between these subgroups.
The strengths of this study include its large size and evaluation of an elderly cohort. This population represents an active elderly population with increasing total physical activity over each visit with approximately half of the sample meeting criteria for ideal LTPA at Visit 5. This increase in physical activity may reflect a secular trend towards more leisure activity, having more time during retire-ment, or increased reporting of leisure activity at later visits. This population sample of a particularly active older cohort allowed for a more granular assessment of the association of physical activity with various echocardiographic measures. Moreover, we analysed cumulative average LTPA and change in LTPA category over Visits 3 and 5 to further evaluate and strengthen the associations seen by cross-sectional analysis at Visit 5.
In summary, we found that ideal LTPA, higher average levels of LTPA over 24 years, and an improvement in LTPA, even later in life, are asso-ciated with better LV diastolic and systolic function. These findings suggest that maintenance of a healthy lifestyle that includes LTPA may help attenuate age-related changes in cardiac structure and function.
Supplementary material
Supplementary material is available atEuropean Heart Journalonline.
Authors’ contributions
S.M.H., B.C.: Performed statistical analysis; A.R.F., S.D.S.: Handled funding and supervision; S.H., K.R.E., S.C., A.M.S.: Acquired the data; S.M.H., A.G., B.C., S.D.S.: Conceived and designed the re-search; S.M.H., B.C., S.D.S.: Drafted the manuscript; S.M.H., A.G., B.C., K.R.E., S.C., A.M.S., A.R.F., S.D.S.: Made critical revision of the manuscript for key intellectual content.
Acknowledgements
The authors thank the staff and participants of the ARIC study for their important contributions.
Funding
The Atherosclerosis Risk in Communities Study is carried out as a collaborative study supported by National Heart, Lung, and Blood Institute (NHLBI) contracts (HHSN268201100005C, HHSN268201100006C, HHSN268201100007C, HHSN268201100008C,
. . . .
. . . .
Table 3 Cardiac structure and function by change in physical activity over 18 years (1995 – 2013), ARIC
(Reference Group)
Persistently poor activity Decreased activity Increased activity Persistently active
n5627 n5894 n51134 n51494
LV EDVi (mL/m2) 42.4 (41.7, 43.1) 42.5 (41.9, 43.1) 42.9 (42.3, 43.4) 43.4 (43.0, 43.9)* RV EDAi (cm2/m2) 10.3 (10.1, 10.5) 10.4 (10.3, 10.6) 10.4 (10.3, 10.5) 10.7 (10.5, 10.8)* LAVi (mL/m2) 24.8 (24.2, 25.5) 25.0 (24.4, 25.5) 25.0 (24.5, 25.5) 25.2 (24.8, 25.6) LVMi (g/m2) 78.7 (77.4, 80.1) 78.1 (77.0, 79.2) 76.0 (75.0, 77.0)* 75.8 (74.9, 76.7)* LV hypertrophy (%) 11.6 (9.1, 14.0) 12.1 (10.0, 14.2) 6.3 (4.9, 7.7)** 8.1 (6.7, 9.5)* LV EF (%) 65.7 (65.3, 66.2) 65.7 (65.4, 66.1) 66.2 (65.9, 66.5) 65.9 (65.6, 66.2) Longitudinal LV strain (%) 217.9 (218.1,217.7) 218.0 (218.1,217.8) 218.3 (218.4,218.2)* 218.3 (218.4,218.1)* RV FAC 0.53 (0.52, 0.53) 0.52 (0.52, 0.53) 0.53 (0.53, 0.54) 0.53 (0.52, 0.53) TAPSV (cm/s) 11.9 (11.7, 12.1) 12.0 (11.8, 12.2) 12.0 (11.8, 12.1) 12.1 (11.9, 12.2) E/A ratio 0.84 (0.82, 0.86) 0.83 (0.82, 0.85) 0.85 (0.83, 0.86) 0.86 (0.84, 0.87) Lateral E/E′ratio 10.4 (10.1, 10.6) 10.1 (9.9, 10.3) 9.9 (9.7, 10.1)* 9.8 (9.7, 10.0)** LV diastolic function,n(%)
Normal 32.2 (28.1, 36.4) 34.4 (30.8, 38.0) 37.8 (34.8, 40.9)* 37.9 (35.2, 40.6)* Mild 32.3 (28.4, 36.3) 31.1 (27.8, 34.4) 29.8 (26.9, 32.8) 29.7 (27.2, 32.3) Moderate 35.2 (31.0, 39.5) 34.2 (30.7, 37.7) 32.4 (29.5, 35.3) 32.4 (29.9, 34.9)
Values represent adjusted means (95% confidence interval) for continuous variables and adjusted prevalence (95% confidence interval) for categorical variables. Pairwise comparison relative to Persistently Poor Activity group with multivariable regression adjusted for age, gender, race, and centre.
EDAi, end-diastolic area index; EDVi, end-diastolic volume index; EF, ejection fraction; FAC, fractional area change; LAVi, left-atrial volume index; LV, left ventricle; LVMi, left-ventricular mass index; RV, right ventricle; TAPSV, tricuspid annular peak systolic velocity.
*P,0.05.
**
HHSN268201100009C, HHSN268201100010C, HHSN268201100011C, and HHSN268201100012C). This work was also supported by NHLBI co-operative agreement NHLBI-HC-11-08 [S.D.S.], grants R00-HL-107642 [S.C.], and K08-HL-116792 [A.M.S.], American Heart Association grant 14CRP20380422 [A.M.S.], grant from the Ellison Foundation [S.C.], National Institutes of Health grant T32 HL094301-06 [S.M.H.], and funds from the Portuguese Foundation for Science and Technology Grant HMSP-ICS/007/2012 [A.G.].
Conflict of interest:none declared.
References
1. Bell EJ, Lutsey PL, Windham BG, Folsom AR. Physical activity and cardiovascular
disease in African Americans in atherosclerosis risk in communities.Med Sci Sports
Exerc2013;45:901 – 907.
2. Kenchaiah S, Sesso HD, Gaziano JM. Body mass index and vigorous physical activity
and the risk of heart failure among men.Circulation2009;119:44 – 52.
3. Wang Y, Tuomilehto J, Jousilahti P, Antikainen R, Ma¨ho¨nen M, Katzmarzyk PT, Hu G. Occupational, commuting, and leisure-time physical activity in relation to
heart failure among Finnish men and women.J Am Coll Cardiol2010;56:1140 – 1148.
4. Berry JD, Pandey A, Gao A, Leonard D, Farzaneh-Far R, Ayers C, DeFina L, Willis B.
Physical fitness and risk for heart failure and coronary artery disease.Circ Heart Fail
2013;6:627 – 634.
5. Rahman I, Bellavia A, Wolk A. Relationship between physical activity and heart
fail-ure risk in women.Circ Heart Fail2014;7:877 – 881.
6. Andersen K, Mariosa D, Adami H-O, Held C, Ingelsson E, Lagerros YT, Nyre´n O, Ye W, Bellocco R, Sundstro¨m J. Dose – response relationship of total and leisure
time physical activity to risk of heart failure: a prospective cohort study.Circ Heart
Fail2014;7:701 – 708.
7. Wilson MG, Ellison GM, Cable NT. Basic science behind the cardiovascular
bene-fits of exercise.Heart2015;101:758 – 765.
8. Cheng S, Xanthakis V, Sullivan LM, Lieb W, Massaro J, Aragam J, Benjamin EJ, Vasan RS. Correlates of echocardiographic indices of cardiac remodeling over the adult life course longitudinal observations from the Framingham Heart Study.
Circulation2010;122:570 – 578.
9. Kane GC, Karon BL, Mahoney DW, Redfield MM, Roger VL, Burnett SJ, Jacobsen SJ, Rodeheffer RJ. Progression of left ventricular diastolic dysfunction and risk of heart
failure.JAMA2011;306:856 – 863.
10. Authors/Task Force Members, McMurray JJV, Adamopoulos S, Anker SD, Auricchio A, Bo¨hm M, Dickstein K, Falk V, Filippatos G, Fonseca C, Gomez-Sanchez MA, Jaarsma T, Køber L, Lip GYH, Maggioni AP, Parkhomenko A, Pieske BM, Popescu BA, Rønnevik PK, Rutten FH, Schwitter J, Seferovic P, Stepinska J, Pedro T, Trindade Voors, Adriaan Zannad, Faiez Zeiher A. ESC
guide-lines for the diagnosis and treatment of acute and chronic heart failure 2012.Eur J
Heart Fail2012;14:803 – 869.
11. The ARIC investigators. The Atherosclerosis Risk in Communities (ARIC) Study:
design and objectives.Am J Epidemiol1989;129:687 – 702.
12. Folsom AR, Arnett DK, Hutchinson RG, Liao F, Clegg LX, Cooper LS. Physical activity and incidence of coronary heart disease in middle-aged women and men.
Med Sci Sports Exerc1997;29:901 – 909.
13. Ainsworth BE, Haskell WL, Whitt MC, Irwin ML, Swartz AM, Strath SJ, O’Brien WL, Bassett DR, Schmitz KH, Emplaincourt PO, Jacobs DR, Leon AS. Compendium of
physical activities: an update of activity codes and MET intensities.Med Sci Sports
Exerc2000;32:S498 – S504.
14. Pereira MA, FitzerGerald SJ, Gregg EW, Joswiak ML, Ryan WJ, Suminski RR, Utter AC, Zmuda JM. A collection of physical activity questionnaires for
health-related research.Med Sci Sports Exerc1997;29:S1 – S205.
15. Richardson MT, Ainsworth BE, Wu HC, Jacobs DR, Leon AS. Ability of the Athero-sclerosis Risk in Communities (ARIC)/Baecke Questionnaire to assess leisure-time physical activity.Int J Epidemiol1995;24:685 – 693.
16. Ainsworth BE, Haskell WL, Herrmann SD, Meckes N, Bassett DR, Tudor-Locke C, Greer JL, Vezina J, Whitt-Glover MC, Leon AS. 2011 compendium of physical
ac-tivities: a second update of codes and MET values.Med Sci Sports Exerc2011;43:
1575 – 1581.
17. Shah AM, Cheng S, Skali H, Wu J, Mangion JR, Kitzman D, Matsushita K, Konety S, Butler KR, Fox ER, Cook N, Ni H, Coresh J, Mosley TH, Heiss G, Folsom AR, Solomon SD. Rationale and design of a multicenter echocardiographic study to as-sess the relationship between cardiac structure and function and heart failure risk in a biracial cohort of community-dwelling elderly persons: the Atherosclerosis Risk
in Communities study.Circ Cardiovasc Imaging2014;7:173 – 181.
18. Lang RM, Bierig M, Devereux RB, Flachskampf FA, Foster E, Pellikka PA, Picard MH, Roman MJ, Seward J, Shanewise JS, Solomon SD, Spencer KT, St John Sutton M, Stewart WJ. Recommendations for chamber quantification: a report from the
American Society of Echocardiography’s Guidelines and Standards Committee and the Chamber Quantification Writing Group, developed in conjunction with the European Association of Echocardiography, a Branch of the European Society
of Cardiology.J Am Soc Echocardiogr2005;18:1440 – 1463.
19. Bursi F, Weston SA, Redfield MM, Jacobsen SJ, Pakhomov S, Nkomo VT, Meverden RA, Roger VL. Systolic and diastolic heart failure in the community.
JAMA2006;296:2209 – 2216.
20. Folsom AR, Yamagishi K, Hozawa A, Chambless LE. Absolute and attributable risks of heart failure incidence in relation to optimal risk factors.Circ Heart Fail2009;2:11–17. 21. Vestbo J, Hurd SS, Agustı´ AG, Jones PW, Vogelmeier C, Anzueto A, Barnes PJ, Fabbri LM, Martinez FJ, Nishimura M, Stockley RA, Sin DD, Rodriguez-Roisin R. Global strategy for the diagnosis, management, and prevention of chronic
obstruct-ive pulmonary disease.Am J Respir Crit Care Med2013;187:347 – 365.
22. Sharrett AR, Patsch W, Sorlie PD, Heiss G, Bond MG, Davis CE, Investigators for the A. Associations of lipoprotein cholesterols, apolipoproteins A-I and B, and tri-glycerides with carotid atherosclerosis and coronary heart disease: The
Athero-sclerosis Risk in Communities (ARIC) Study.J Vasc Biol1994;14:1098 – 1104.
23. Saunders JT, Nambi V, de Lemos JA, Chambless LE, Virani SS, Boerwinkle E, Hoogeveen RC, Liu X, Astor BC, Mosley TH, Folsom AR, Heiss G, Coresh J, Ballantyne CM. Cardiac troponin T measured by a highly sensitive assay predicts coronary heart disease, heart failure, and mortality in the atherosclerosis risk in
communities study.Circulation2011;123:1367 – 1376.
24. Folsom AR, Shah AM, Lutsey PL, Roetker NS, Alonso A, Avery CL, Miedema MD, Konety S, Chang PP, Solomon SD. American Heart Association’s Life’s Simple 7:
avoiding heart failure and preserving cardiac structure and function.Am J Med
2015;128:970 – 976.e2.
25. Fujimoto N, Hastings JL, Bhella PS, Shibata S, Gandhi NK, Carrick-Ranson G, Palmer D, Levine BD. Effect of ageing on left ventricular compliance and
distensi-bility in healthy sedentary humans.J Physiol2012;590:1871 – 1880.
26. Arbab-Zadeh A. Effect of aging and physical activity on left ventricular compliance.
Circulation2004;110:1799 – 1805.
27. Bhella PS, Hastings JL, Fujimoto N, Shibata S, Carrick-Ranson G, Palmer MD, Boyd KN, Adams-Huet B, Levine BD. Impact of lifelong exercise ‘dose’ on left
ven-tricular compliance and distensibility.J Am Coll Cardiol2014;64:1257 – 1266.
28. Prasad A, Popovic ZB, Arbab-Zadeh A, Fu Q, Palmer D, Dijk E, Greenberg NL, Garcia MJ, Thomas JD, Levine BD. The Effects of aging and physical activity on
Doppler measures of diastolic function.Am J Cardiol2007;99:1629 – 1636.
29. Andersson C, Lyass A, Larson MG, Spartano NL, Vita JA, Benjamin EJ, Murabito JM, Esliger DW, Blease SJ, Hamburg NM, Mitchell GF, Vasan RS. Physical activity mea-sured by accelerometry and its associations with cardiac structure and vascular
function in young and middle-aged adults.J Am Heart Assoc2015;4:e001528.
30. Smart NA, Meyer T, Butterfield JA, Faddy SC, Passino C, Malfatto G, Jonsdottir S, Sarullo F, Wisloff U, Vigorito C, Giallauria F. Individual patient meta-analysis of exercise training effects on systemic brain natriuretic peptide expression in heart failure.Eur J Prev Cardiol2012;19:428 – 435.
31. Baggish AL, Wood MJ. Athlete’s heart and cardiovascular care of the athlete:
scien-tific and clinical update.Circulation2011;123:2723 – 2735.
32. Lauer MS, Anderson KM, Levy D. Influence of contemporary versus 30-year blood pressure levels on left ventricular mass and geometry: The Framingham Heart
Study.J Am Coll Cardiol1991;18:1287 – 1294.
33. Palatini P, Visentin P, Dorigatti F, Guarnieri C, Santonastaso M, Cozzio S, Pegoraro F, Bortolazzi A, Vriz O, Mos L. Regular physical activity prevents development of left
ventricular hypertrophy in hypertension.Eur Heart J2009;30:225– 232.
34. Pitsavos C, Chrysohoou C, Koutroumbi M, Aggeli C, Kourlaba G, Panagiotakos D, Michaelides A, Stefanadis C. The impact of moderate aerobic physical training on left ventricular mass, exercise capacity and blood pressure response during
tread-mill testing in borderline and mildly hypertensive males.Hell J Cardiol HJC Hellenike
Kardiologike Epitheorese2011;52:6 – 14.
35. Boman K, Gerdts E, Wachtell K, Dahlo¨f B, Nieminen MS, Olofsson M, Papademetriou V, Devereux RB. Exercise and cardiovascular outcomes in tensive patients in relation to structure and function of left ventricular
hyper-trophy: the LIFE study.Eur J Cardiovasc Prev Rehabil2009;16:242 – 248.
36. Kalam K, Otahal P, Marwick TH. Prognostic implications of global LV dysfunction: a systematic review and meta-analysis of global longitudinal strain and ejection
fraction.Heart2014;100:1673 – 1680.
37. Stanton T, Leano R, Marwick TH. Prediction of all-cause mortality from global lon-gitudinal speckle strain comparison with ejection fraction and wall motion scoring.
Circ Cardiovasc Imaging2009;2:356 – 364.
38. Ersbøll M, Valeur N, Mogensen UM, Andersen MJ, Møller JE, Velazquez EJ, Hassager C, Søgaard P, Køber L. Prediction of all-cause mortality and heart failure admissions from global left ventricular longitudinal strain in patients with acute
myocardial infarction and preserved left ventricular ejection fraction.J Am Coll
Car-diol2013;61:2365 – 2373.
39. Pelliccia A, Culasso F, Di Paolo FM, Maron BJ. Physiologic left ventricular cavity