UNDERSTANDING THE PLANT MICROBIOME
Sur Herrera Paredes
A dissertation submitted to the faculty at the University of North Carolina at Chapel Hill in partial fulfillment of the requirements for the degree of Doctor of Philosophy in the
Curriculum in Bioinformatics and Computational Biology.
Chapel Hill 2017
ABSTRACT
Sur Herrera Paredes: Understanding the plant microbiome (Under the direction of Jeffery L. Dangl)
Plants live in a microbial world and microbes have been known to influence plant health for more than a century. Remarkable progress has been made in elucidating the molecular, physiological and ecological processes in various instances of plant-microbe interactions. This has been possible thanks to a reductionist paradigm that emphasizes testing binary interactions involving only one type of microbe and one type of plant at the same time. In recent years, it has become increasingly clear that plants harbour an enourmous diversity of microbes. These observations raise important questions such as: what is the microbial diversity of the plant associated microbiota? How is the microbial diversity in the plant determined by external factors like soil biodiversity and nutritional composition? What is the role that the plant host plays in structuring the observed microbial biodiversity patterns? What are the plant genes and pathways that modulate the root microbiome and how do those interact with the environment? Finally, what is the function that the plant microbiome performs for the host? How does it influence phenotypic plasticity? and how can we manipulate the plant microbiome to modulate plant phenotypes?
that bacterial groups act mostly additively (Chapter 6) and that bacterial strains can act either additively or interactively depending on the plant phenotype (Chapter 7). Finally, we have shown that we can manipulate plant phenotypes by designing novel bacterial consortia (Chapters 6 and 7).
ACKNOWLEDGEMENTS
The work presented here was only possible thanks to the numerous contributions by multiple people. I want to thank the Dangl Lab, both current and former members have created a unique environment for science to thrive. This environment is only possible thanks to the leadership of Prof. Jeff Dangl who inspires everyone to be the best scientist possible. I also want to tank the lab manager Terry Law for efficiently running the day-to-day functioning of the lab. I thank the NLR and Effector branches of the Dangl lab for their continuous interest, critical insight and participation, in particular during my lab seminars. I also thank the microbiome group of the lab, for all the support and willingness to collaborate all these years.
I thank my co-advisors, Prof. Jeff Dangl and Prof. Corbin Jones, for their patience, encouragment, advice and trust through my PhD. The work described here wouldn’t have been possible without their committed enthusiasm. I also thank the rest of my thesis committee: Prof. Adrian Marchetti, Prof. Thomas Mitchell-Olds, and Prof. Elizabeth Shank, for dedicating some of their valuable time to me, and for their thoughtful comments and advice.
I also want to thank my scientific collaborators and co-authors from outside the lab, at UNC and elsewhere. A special mention goes to the group at the DOE Joint Genome Institute and the Max Planck Institute at Cologne. They have enriched all my projects with the most valuable critiques.
I thank my PhD progam, the Bioinformatics and Computational Biology Curriculum, for the chance they gave me, and in particular the administrative staff: John Cornett and Cara Marlow, for their smooth support and interest.
the work described in this dissertation. These include the University of North Carolina at Chapel Hill, and its Graduate School and Department of Biology; the DOE Joint Genome Institute; the National Science Foundation; the Howard Hughes Medical Institute; and the Gordon and Betty Moore Foundation.
TABLE OF CONTENTS
LIST OF FIGURES . . . xv
LIST OF TABLES . . . xx
1 GIVING BACK TO THE COMMUNITY: MICROBIAL MECHANISMS OF PLANT-SOIL INTERACTIONS . . . 1
1.1 Plant and rhizosphere microbial diversity throughout the plant life cycle . . . 3
1.2 The genomic basis of plantmicrobe interactions . . . 11
1.3 Impacts on plant performance . . . 14
1.4 Conclusion . . . 17
2 DEFINING THE CORE ARABIDOPSIS THALIANA ROOT MICROBIOME . . . 18
2.1 Methods . . . 35
2.1.1 General strategy . . . 35
2.1.2 Soil collection and analysis . . . 35
2.1.3 Seed sterilization and germination . . . 36
2.1.4 Seedling growth . . . 38
2.1.5 Harvesting . . . 38
2.1.6 DNA extraction . . . 41
2.1.7 PCR . . . 42
2.1.8 454 pyrotag sequencing . . . 42
2.1.10 Primer specificity sequence . . . 45
2.1.11 Sequence processing pipeline and assignment of OTUs . . . 47
2.1.12 Detection of differentially enriched OTUs by the GLMM . . . 51
2.1.13 Partial GLMM . . . 53
2.1.14 Scanning electron microscopy sample preparation . . . 53
2.1.15 Log2 transformation . . . 54
2.1.16 Heat maps . . . 54
2.1.17 Diversity . . . 54
2.1.18 Rarefaction curves . . . 54
2.1.19 Taxonomy histograms and statistics . . . 54
2.1.20 Sample clustering using UniFrac . . . 55
2.1.21 CARD-FISH application to roots . . . 55
2.1.22 Sample naming in OTU tables . . . 58
3 A REDUCED COMPLEXITY PLATFORM FOR A COM-PLEX SYSTEM . . . 59
3.1 Robust re-colonization of A. thaliana roots across nutri-tional conditions . . . 61
3.2 Robust re-colonization of roots across host phylogenetic distance . . . 65
3.3 Specific changes in the root microbiome under different nutritional conditions . . . 68
3.4 Specific changes in the root microbiome under different host genotypes . . . 72
3.5 Estimating heritability of the root microbiome . . . 75
3.6 Discusion . . . 76
3.7 Methods . . . 79
3.7.2 DNA extraction . . . 80
3.7.3 Library preparation and sequencing . . . 80
3.7.4 Synthetic community composition . . . 80
3.7.5 Sequence processing . . . 84
3.7.6 Ordination . . . 84
3.7.7 Identifying robust colonizers . . . 86
3.7.8 Testing from presence/absence differences . . . 86
3.7.9 Identifying relative abundance differences . . . 88
4 SALICYLIC ACID MODULATES COLONIZATION OF THE ROOT MICROBIOME BY SPECIFIC BACTERIAL TAXA . . . 89
4.1 Defense phytohormone mutant genotypes . . . 90
4.2 Overall diversity patterns . . . 92
4.3 Salicylic acid genetic status explains differential abun-dances of specific taxa . . . 96
4.4 Phytohormone mutants have an abnormal core microbiome . . . 100
4.5 Microcosm recapitulation of the root microbiome . . . 103
4.6 Salicylic acid modulates the abundance of specific isolates . . . 107
4.7 Reconstituting the effect of salicylic acid in vitro . . . 107
4.8 Conclusion . . . 110
4.9 Supplemental information . . . 112
4.9.1 Plant measurments . . . 112
4.9.2 Census study experimental procedures . . . 114
4.9.3 Massive parallel sequencing library preparations . . . 116
4.9.4 Processing of sequencing data . . . 117
4.9.6 Synthetic community (SynCom) experimental procedures . . . 129
4.9.7 Statistical analysis . . . 131
5 DIRECT INTEGRATION OF PHOSPHATE STARVA-TION AND IMMUNITY IN RESPONSE TO A ROOT MICROBIOME . . . 137
5.1 The root microbiome in plants with altered phosphate stress response . . . 138
5.2 Phosphate starvation response in a microcosm reconstitution . . . 142
5.3 Coordination between phosphate stress response and immune system output . . . 147
5.4 PHR1 integrates plant immune system output and phos-phate stress response . . . 149
5.5 Conclusions . . . 151
5.6 Supplementary text . . . 152
5.6.1 General features of the root microbiota in wild soil . . . 152
5.6.2 Control experiments pertinent to figures 2 and 3 . . . 155
5.6.3 General features of the SynCom colonization ex-periment in agar . . . 160
5.6.4 Differentially expressed genes in plants growing in the presence of the SynCom . . . 161
5.6.5 General features of Col-0 and phr1 phl1 plants exposed to flg22 . . . 164
5.7 Methods . . . 166
5.7.1 Census study experimental procedures . . . 166
5.7.2 Processing of 16S sequencing data . . . 167
5.7.3 In vitro plant growth conditions . . . 171
5.7.4 Bacterial isolation and culture . . . 174
5.7.6 Genome-wide gene expression analyses . . . 177
5.7.7 RNA isolation and RNA-seq library construction . . . 177
5.7.8 RNA-seq data analysis . . . 179
5.7.9 Defining markers of the MeJA and SA responses . . . 182
5.7.10 Statistical analyses . . . 182
5.7.11 Data and software accessibility . . . 185
6 BACTERIAL CONSORTIA PREDICTABLY MODULATE PLANT PHENOTYPES . . . 186
6.1 In vitro isolate screening . . . 187
6.2 Individual strains modulate plant phosphate accumulation . . . 188
6.3 Bacterial blocks act additively on plant phosphate accumulation . . . 193
6.4 Bacterial modulation of plant transcriptional responses . . . 198
6.5 Designing novel bacterial consortia . . . 203
6.6 Conclusion . . . 206
6.7 Methods . . . 207
6.7.1 Seed sterilization . . . 207
6.7.2 Exudate preparation and profiling . . . 207
6.7.3 Bacterial in vitro growth curves . . . 209
6.7.4 Isolate growth-curve clustering and selection for in planta assays . . . 209
6.7.5 Phylogenetic signal analyses . . . 210
6.7.6 Plant-bacteria binary association assays . . . 210
6.7.7 Synthetic community experiments . . . 211
6.7.8 Bacterial growth for binary association and syn-thetic community experiments . . . 211
6.7.10 Shoot colonization experiments . . . 213
6.7.11 Plant phenotyping . . . 214
6.7.12 Estimating block additivity . . . 214
6.7.13 DNA extraction for 16S analysis . . . 218
6.7.14 Synthetic community experiments 16S library preparation . . . 218
6.7.15 16S profiling sequence processing and analysis . . . 220
6.7.16 RNA isolation for transcriptomics . . . 220
6.7.17 RNA-seq library construction . . . 220
6.7.18 RNA-seq sequence processing and analysis . . . 221
6.7.19 Neural network construction . . . 222
6.7.20 Sensitivity in different models . . . 226
6.7.21 Generation of block swaps . . . 227
6.7.22 Data and software accessibility . . . 227
7 ROOT MICROBIOME MEMBERS ACT IN ISOLATION AND IN CONCERT TO MODULATE PLANT PHENOTYPES . . . 229
7.1 The experimental design . . . 231
7.2 Results from combinatorial synthetic communities . . . 234
7.3 Ongoing validation experiments . . . 241
7.4 Conclusions . . . 243
7.5 Methods . . . 244
7.5.1 Power analysis . . . 244
7.5.2 Strain selection . . . 245
7.5.3 Bacterial growth for synthetic communities . . . 247
7.5.4 Plant growth for synthetic communities . . . 248
7.5.6 Estimating main effects . . . 250
7.5.7 Estimating interactions . . . 251
7.5.8 In vitro inhibitions . . . 252
7.5.9 Randomization and experimental blinding . . . 252
7.5.10 Data and software accessibility . . . 253
LIST OF FIGURES
1.1 Plant microbiome assembly . . . 5
2.1 Sequencing statistics and quality . . . 20
2.2 Sample fraction and soil type drive the microbial com-position of root-associated endophyte communities . . . 22
2.3 Sample fraction and soil type drive the microbial com-position of root-associated endophyte communities . . . 22
2.4 OTUs identified from four independent biological repli-cates are reproducible . . . 24
2.5 OTUs that differentiate the EC and rhizosphere from soil . . . 25
2.6 OTUs that differentiate the EC and rhizosphere from soil . . . 26
2.7 Dot plots of notable OTUs . . . 28
2.8 Dot plots of notable OTUs . . . 29
2.9 Genotype-variable OTUs colored by sequence plate . . . 31
2.10 CARD-FISH confirmation of Actinobacteria on roots . . . 32
2.11 Quantification of microbes in the three sample fractions using CARD-FISH . . . 33
2.12 Pyrosequencing of sterile seedlings as compared to vs. non-sterile EC samples . . . 37
2.13 Harvesting scheme . . . 40
2.14 Primer test and technical reproducibility . . . 44
2.15 Test for PCR bias in pyrotagging . . . 46
2.16 Informatics pipeline . . . 48
2.18 Overlap of GLMM predictions between rarefaction-normalized
and frequency-normalized OTU tables . . . 52
2.19 Phyla in each sample fraction by soil type . . . 56
3.1 Experimental design and sample number . . . 61
3.2 Nutritional composition alters root colonization . . . 62
3.3 Root microbiome in varying nutrient compositions . . . 63
3.4 Media has a small effect on bacteria presence/absence but a larger effect inside the root . . . 64
3.5 Examples of isolates that show presence/absence differ-ences in different fractions and conditions . . . 66
3.6 Root microbiome in different hosts . . . 67
3.7 Presence/absence variation of isolates between hosts . . . 69
3.8 Isolates sensitive to media and sample fraction . . . 71
3.9 Isolates enriched in specific hosts . . . 74
3.10 CAP analysis of bacterial composition of root and neigh-boring soil samples from 18 Arabidopsis accessions . . . 75
3.11 Pairwise community dissimilarities . . . 77
3.12 Ordination results from samples form different plant genotypes . . . 85
3.13 Genotype has a larger effect on presence/absence inside the root . . . 87
4.1 Defense phytohormone mutants have altered root bac-terial communities compared with those of wild-type plants . . . 91
4.2 Sample fraction drives differences in alpha and beta diversity of root microbiome communities . . . 93
4.3 Differential abundance of Proteobacteria families in dif-ferent sample fractions . . . 94
4.5 Genotype differentially abundant (DA) family
enrich-ments and depletions . . . 98 4.6 Genotype differentially abundant (DA) OTU
enrich-ments and depletions . . . 99 4.7 Technical reproducibility between variable regions and
sequencing platforms . . . 102 4.8 Induction of Runaway Cell Death (RCD) in lsd1 mutants
grown in the SynCom with salicylic acid treatment of leaves . . . 104 4.9 A 38-member synthetic community recapitulates
differ-entiated microbiome colonization . . . 105 4.10 Synthetic community differentiates sample fractions . . . 106 4.11 Defense phytohormone mutants exhibit increased
abun-dance of EC-depleted microbes . . . 108 4.12 Salicylic acid treatment affects SynCom composition,
but did not affect growth of Flavobacterium sp. #40 in
SynCom or in liquid growth curves . . . 109 4.13 Salicylic acid directly affects synthetic community isolates . . . 111 4.14 Salicylic acid production in MF soil and root morphology
of defense phytohormone mutants . . . 113 4.15 Processing pipeline for Roche 454 census experiments . . . 118 4.16 The absolute quantification of bacteria in samples grown
in MF soil . . . 124 4.17 Alpha and beta diversity for different 16S rRNA and ITS regions . . . 132 4.18 Zero-Inflated Negative Binomial model . . . 133 5.1 Plants grown in Mason Farm wild soil or phosphate (Pi)
replete potting soil do not induce PSR and accumulate
the same amount of Pi . . . 139 5.2 Phosphate Stress Response (PSR) mutants assemble an
altered root microbiota . . . 140 5.3 A bacterial Synthetic Community (SynCom)
5.4 PHR1 mediates interaction of the PSR and plant immune
system outputs . . . 146
5.5 Loss of PHR1 activity results in enhanced activation of plant immunity . . . 149
5.6 The Arabidopsis PSR alters highly specific bacterial taxa abundances . . . . 153
5.7 The SynCom induces PSR independently of sucrose in Arabidopsis . . . 156
5.8 Bacteria induce the PSR using the canonical pathway in Arabidopsis . . . . 159
5.9 PHR1 controls the balance between the SA and JA regulons during the PSR induced by a 35-member SynCom . . . 161
5.10 PHR1 activity effects on flg22 and MeJA-induced tran-scriptional responses . . . 165
5.11 Plant genotype and Pi concentration alter SynCom strain abundances . . . . 172
5.12 Phylogenetic composition of the 35-member synthetic community (SynCom) . . . 175
5.13 Induction of the PSR triggered by the SynCom is medi-ated by PHR1 activity . . . 178
5.14 Number of mapped reads for each RNA-seq library used in this study . . . 181
6.1 Phylogenetic signal in bacterial growth curves . . . 189
6.2 Bacterial classification according to in vitro performance . . . 190
6.3 Bacterial effect on shoot phosphate accumulation . . . 191
6.4 Bacterial modulation of plant phosphate accumulation is independent of bacterial phylogeny and in vitro performance . . . 192
6.5 Activation of the plant phosphate starvation response is required for bacterial modulation of plant phosphate accumulation . . . 194
6.6 Designing synthetic communities from binary association data . . . 195
6.7 Synthetic communities alter plant phenotypes . . . 197
6.8 Overall transcriptional response to synthetic communities . . . 199
6.10 Comparing individual block effects with community effects . . . 203
6.11 Complex tri-partite interaction captured by a neural network . . . 204
6.12 Prediction never-see-before synthetic communities . . . 205
6.13 Root exudates primary metabolite analysis . . . 208
6.14 Bacterial colonization and their effect on phosphate star-vation are independent . . . 215
6.15 Additive contributions of bacterial blocks explain syn-thetic community phenotypes . . . 217
7.1 Experimental design and power analysis . . . 232
7.2 Estimated effect (coefficient) of each strain on each phenotype . . . 233
7.3 Association of strains with plant phenotypes . . . 234
7.4 Bacterial effect through time . . . 236
7.5 Distribution ofp-values from associations between phe-notypes and KEGG orthology groups. . . 237
7.6 Distributions of p-values for bacteria-bacteria interactions . . . 238
7.7 Color is influenced by specific bacterial pairs . . . 239
7.8 Some interactions might be explained by in vitro inhibitions . . . 240
7.9 Binary association assays in clay . . . 241
7.10 Plants growing with and without synthetic community in two nutrient conditions . . . 243
LIST OF TABLES
3.1 Isolates that show quantitative variation in different
media and sample fraction . . . 70
3.2 Significant relative abundance differences for specific bacterial isolates between hosts . . . 73
3.3 Isolates used in synthetic community experiments . . . 83
6.1 Description of input features xb,p,q,S . . . 224
CHAPTER 1
Giving back to the community: microbial mechanisms of
plant-soil interactions
1The role of both plants and soil microbes on ecosystem functioning has been long recognized, but the precise feedback mechanisms between them are more elusive. Definition of these interactions is critical if we aim to achieve an integral understanding of ecosystem functioning, and ultimately explain natural, agricultural and synthetic systems.
Advances in genomic technologies and the development of more appropriate statistical, mathematical and computational frameworks enable researchers to almost fully describe and measure the diversity of microbial communities in soil, rhizosphere and plant tissues. Under the scaffold of community ecology, we integrate the observed patterns of microbial diversity with current mechanistic understanding of plant-microbe mutualistic and pathogenic interactions, and propose a model in which plant microbial communities are shaped by different ecological forces differentially through the plant life cycle.
The same genomic technologies, applied on natural and reconstructed systems, establish that plant genotype has a small, but significant, effect on the microbial community composition in, on and around plant organs. Despite these advances, technical limitations are still important and only a handful of studies exist where a precise genetic element definitively participates in these interactions.
Studies at the field or ecosystem level are dominated by agricultural settings, examining
1Most of the content of this chapter has been published before as a peer-reviewed review (Herrera Paredes
microbial species and communities effects on plant productivity; and conversely, that plant genetics and agricultural practices can potentially impose selective pressures on specific microbes and microbial communities.
Revitalized interest in plant-soil microbial feedbacks requires researchers to systematically pose and evaluate more complex hypotheses with increasingly more realistic microbial settings. Despite the advances reviewed here, most studies focus on one aspect of plant, microbe and soil interactions. Experiments that simultaneously and methodically manipulate multiple components are necessary to establish the ecological principles, and molecular mechanisms, which drive microbially mediated plantsoil interactions. This knowledge will be critical to predict how environmental changes affect microbial and plant diversity, and will guide efforts to improve agricultural and conservation practices.
interactions, and the impact of improved genomic technologies on our ability to understand how these relationships impact plant performance, potentially allowing us to sustainably improve plant productivity.
1.1 Plant and rhizosphere microbial diversity throughout the plant life cycle
Plants harbour complex microbial communities inside and on every organ; their assembly depends on, among other factors, the microbial species found in the surroundings. While root and leaf communities are readily distinguishable from the surrounding soil and air communities (Bulgarelli et al., 2012; Lundberg et al., 2012; Maignien et al., 2014), differences in microbial composition and diversity exist between plant organs, developmental stages, plant genotypes and environments (Bulgarelli et al., 2013). Such differences can be explained as the result of ecological processes acting on the microbial communities. Under the theoretical framework of community ecology, the factors influencing the composition and diversity of any community can be classified into four general processes: selection, dispersal, drift and speciation (Vellend, 2010; Costello et al., 2012) (Fig. 1.1. While selection and drift decrease diversity, dispersal and speciation increase diversity, and the relative contributions and interactions between these processes determine the final community assembly. Full understanding of plant-soil microbial interactions requires the knowledge of how each of these processes influences the microbial community of both plant and soil, and how these communities affect the same processes on each other over the course of the plants’ life cycle and over generations of plants and microbes within an environment.
et al., 1997; Stewart et al., 2005; Pag´an et al., 2014). Because of this, it should be expected that the microbes carried by seeds be strongly subject to (ecological) selection by the plant, and therefore more likely beneficial. While no study has systematically determined whether seedborne microbes are enriched in plant beneficial functions, there is long-standing evidence for seed-based dispersal of nodule-forming rhizobia in legume seeds (Ash and Allen, 1948). More recent studies suggest the existence of surprising microbial diversity inside the seeds of maize (Johnston-Monje and Raizada, 2011) and spinach (Lopez-Velasco et al., 2013), although they lack functional tests of those microbes. A single study profiling the fungal and bacterial seed epiphytic communities in several species ofTriticum and Brassica also found a largely conserved set of micro-organisms across both genera, hinting at bacteria-fungus antagonism as an important process in determining the microbial community composition (Links et al., 2014). Besides these observational studies, experimental manipulation of seed epiphytes has shown that bacterial seed coatings can protect against pathogens (Wright et al., 2005; Hartmann et al., 2009) and promote plant growth (Jetiyanon et al., 2008). Because microbial seed epiphytes are thought to have an advantage over soil bacteria during plant colonization, seed coating methods for economically important crops are a major area of research and development with numerous patents being filed (∼4000 results for microbial seed coating on Google patent search), and major investment by biotechnology companies (Smith, 2014). Seeds can also harbour bacterial (Gitaitis and Walcott, 2007), fungal (Biswas et al., 2013; Maruthachalam et al., 2013) and oomycete (Testen et al., 2013) pathogens. While it has been proposed that seed dispersal is a general mechanism to escape the high density of pathogens near parents in natural ecosystems (Harms et al., 2000), in the agricultural world seeds act as important vectors for hundreds of diseases, and most studies point to human activities being the major factor in spreading pathogen-bearing seeds (Elmer, 2001). Understanding how seedborne pathogens interact with microbial communities in the plant and soil is an essential step towards better disease control.
competitive advantage over microbes that attempt to colonize after germination. At the same time, opportunistic microbes from the surrounding soil might gain access to a novel niche as the plant develops. According to this model, early colonization is a highly stochastic process, dominated by dispersal and drift (Fig. 1.1), which leads to ’historically contingent’ plant microbial communities where the early colonizers determine the final community, mediated by microbemicrobe interactions, or by plant mechanisms reinforcing the primacy of early colonizers (Costello et al., 2012). Evidence for this model exists in the context of the endophytic compartment of the weedy annualArabidopsis thalianaroots and leaves. Drift may be particularly important given the estimates of a total of 105 endophytic bacterial cells per
root system (Lundberg et al., 2012) and 104 cells cm2 on the leaf of the same species (Maignien
et al., 2014). Given that hundreds of bacterial ribotypes were detected on each organ, these results imply a relatively small population of only tens to hundreds of individuals per ribotype, which greatly favours the influence of drift over other processes, and it is consistent with the observed decrease in microbial diversity with respect to soil (Fig. 1.1). Importantly, the ’historically contingent’ model is consistent with the huge individual-to-individual variation in microbial composition found in major sequence-based surveys of the microbiome of roots in diverse species (Bulgarelli et al., 2012; Lundberg et al., 2012; Peiffer et al., 2013; Edwards et al., 2015), and the somewhat smaller but also large variation found in leaves (Redford et al., 2010; Maignien et al., 2014). While there are no experimental or observational data about the microbial communities in plants that follow alternative propagation mechanisms (e.g. rhizomes, spores, stolons, bulbs, tubers, corm or cuttings, as well as horticultural practices such as grafting), the community ecology framework predicts that these plants, which have weaker dispersion, are expected to have reduced microbial diversity (Vellend, 2010). Finally, it is also relevant to define how important the primacy of early colonizers is for plants with annual vs. perennial lifestyles.
about how this effect changes through plant development because most studies focus at later developmental stages, when the root system is firmly established. However, time course experiments in rice determined that the relative abundance of core bacterial taxa from inside the root peaks in the rhizosphere just 3 days after transplantation (Edwards et al., 2015), suggesting that plants may influence the rhizosphere microbial community very early after seedling emergence. Consistently, profiling of the bacterial and fungal communities of seedlings of the Brassicaceae family shortly after emergence shows a decrease in microbial richness, consistent with plant selection and drift happening very early (Barret et al., 2015). Despite these advances, a more systematic evaluation of early time points is still necessary to evaluate the effect of pre-emergence conditions, such as stratification, on microbial communi-ties that colonize very young seedlings. The observation that the composition rhizosphere and rhizoplane bacterial communities are intermediate between that of bulk soil and those that live inside the roots (Bulgarelli et al., 2012; Lundberg et al., 2012; Peiffer et al., 2013; Edwards et al., 2015; Yeoh et al., 2016), has led to the hypothesis that the root microbiome is assembled in a stepwise process where microbes are first recruited to the rhizosphere and then colonize the root (Bulgarelli et al., 2012; Edwards et al., 2015). Under this working model, soil micro-organisms that readily utilize the root exudates would have an advantage in colonizing the roots; however, this model lacks direct empirical testing so far. Another important observation is that soil bacterial composition is the major determinant of the bacterial root microbiome across a variety of plant species (Bulgarelli et al., 2012; Lundberg et al., 2012; Peiffer et al., 2013; Edwards et al., 2015; Yeoh et al., 2016). Interestingly, a similarly strong effect of soil has been reported for phyllosphere bacterial communities (Knief et al., 2010; Zarraonaindia et al., 2015), suggesting that a common environmental pool of microbes exists for both above- and below-ground plant organs.
soil, or through an equilibrium in the exchange rate of microbes between the rhizosphere and the plant. For microbes that are highly abundant or have very efficient dispersal, continual dispersal from the surrounding environment into the plant might counteract the effect of drift, as could selection to maintain them once they are established. While the current standard view is that strong colonizers both invade and persist within the plant host, the turnover rate of the plant microbiota has not been directly measured, and indirect sequence-based methods suggest that it is relatively high in above-ground organs (Redford and Fierer, 2009; Shade et al., 2013). In any case, it is expected that during the ’establishment’ phase, when the plant physiology is directed towards increasing plant biomass, the plants would achieve maximum benefit from positive associations. As such, theory predicts that the plant selection over its microbiome is the strongest during this phase (Fig. 1.1). The fact that reproducible enrichment of certain bacterial taxa is commonly found across diverse soils (Bulgarelli et al., 2012); (Lundberg et al., 2012) and in various plant species (Schlaeppi et al., 2014; Yeoh et al., 2016) suggests that plant selection on the microbiome is stronger than ecological drift during this stage, even though it does not completely overtake the ’founders effect’ that occurs during seed dispersion (Fig. 1.1).
Most carbon in soils is derived from plants, with individual plants releasing 5-21% of their photosynthetically fixed carbon through the roots (Marschner, 1995), and global carbon release into the rhizosphere in the order of 15002200 kg C ha−1 year−1 (Kuzyakov and
the rhizosphere (Hern´andez et al., 2015) and that this assimilation is dependent in close proximity to the root (Lu et al., 2007).
After nitrogen, phosphorous is the most common limiting nutrient in soils (Schachtman et al., 1998). Most of the phosphorous in soil is in insoluble phosphate forms that cannot be used by plants. The vast majority of plants have overcome this limitation by evolving a mycorrhizal interaction. The most prevalent of these plant-fungus interactions is with arbuscular mycorrhizal fungi (AMF), which is estimated to interact with 80% of land plant species (Brundrett, 2009) and is proposed to have played a key role in land colonization by plants (Buscot, 2015). Plants recruit AMFs by secreting compounds, such as strigolactones, that induce spore germination and hyphae formation (Schmitz and Harrison, 2014). The AMF then forms a network of hyphae that is directly connected to the plant root and extends the reach and functional capacity of roots. The fungal partner solubilizes phosphate and then delivers it to the plant root, which in turn provides the fungus with a constant supply of carbon compounds (Smith and Smith, 2012). The AMF hyphae not only extend the root capacity, but may also extend the rhizosphere effect. Interestingly, AMF harbours their own bacterial partners (Naumann et al., 2010; Desir`o et al., 2014), although their effect on the root and soil bacterial communities, and on the carbon-phosphorous trade, has not been measured. Besides mycorrhizal fungi, many bacteria can also solubilize phosphate (Rodr´ıguez and Fraga, 1999), and it has been reported that, among cultivable bacteria, there is a higher proportion of phosphate-solubilizing bacteria in bulk soil than in plant tissue (Marasco et al., 2012). However, the importance of this process in the field is poorly understood, and inoculation of soils with phosphate-solubilizing bacteria has produced negligible differences in plant phosphate assimilation (Glick, 2012).
demonstrated that different bacterial taxa preferentially colonize the apple flower at different developmental stages (Shade et al., 2013), suggesting that plant development may alter the selective mechanisms driving microbial succession. Further evidence for this has been found in a multiyear study of the leaf microbiome of deciduous trees where leaf age contributes more to community composition than experimental year (Redford and Fierer, 2009). It is unknown how the differences in annual vs. perennial life histories influence the assembly and long-term stability of plant microbiota. To fully elucidate how the order of microbial colonization affects the plant microbiome, it would be necessary to carry out studies with time-series and crossover designs; this type of design has already been used to establish the existence of such ’order effects’ in the context of colonization of the mammalian gut (Lee et al., 2013).
perspective (Van Nuland et al., 2016).
1.2 The genomic basis of plantmicrobe interactions
To thrive in the plant tissue, a micro-organism must have the genetic determinants to access and invade at least one plant tissue and then, persist in the presence of a sophisticated immune system and a chemical composition distinct from the surrounding soil. Thus, it is expected that both plant and microbial genomes show evolutionary signatures relating to these interactions. Indeed, studies ofA. thaliana (Bulgarelli et al., 2012; Lundberg et al., 2012) and maize (Peiffer et al., 2013) have shown a significant, if small, effect of the plant natural genotypes on the root microbiome with a stronger effect reported among barley cultivars (Bulgarelli et al., 2015). Moreover, it has been reported that there is a correlation between the phylogenetic distance and root microbiome dissimilarity in plants of the Brassicaceae (Schlaeppi et al., 2014) and Poaceae (Bouffaud et al., 2014) families. There is also evidence for plant genetic effects on the phyllosphere (i.e. above-ground) community. Poplar fungal leaf microbiome correlates with plant genotype in common garden experiments (B´alint et al., 2013), and a synthetic community approach with A. thaliana plants showed differences between accessions and comparison of mutants to wild-type plants pointed at a role for cuticle formation and ethylene signalling in shaping the phyllosphere microbiome (Bodenhausen et al., 2013, 2014) and salicylic acid in root microbiome (Lebeis et al., 2015). Finally, a genome-wide association study inA. thaliana of fungal and bacterial leaf microbiome pointed at a number of plant loci that affect abundance of specific microbes and species richness; defense was the most common process associated with bacterial abundance but other processes such as cell wall integrity, trichome branching and morphogenesis also affected the microbiome (Horton et al., 2014).
plant-associated habitats and counterselected elsewhere (Bruto et al., 2014). While most comparative genomics approaches have focused on relatively narrow and well-defined bacterial clades with previously characterized functions, recent efforts to systematically sample the genomic diversity of plant-derived isolates (Bai et al., 2015) allow the differentiation between bacterial functions required to thrive in the plant environment, and bacterial functions that the plant may select because they provide a fitness advantage to the plant.
efforts to expand the set of reference bacterial genomes isolated from plant and rhizosphere samples, such as the study from Bai et al. (2015), are essential building blocks. Improved annotations taking into account the ecological context are also required for modern genomic techniques like transposon insertion sequencing (Goodman et al., 2009) and artificial evolution (Schl¨otterer et al., 2015). In the long run, these approaches will feed statistical and population genetics models that promise to predict plant phenotypes as outputs of interactions between plants and microbial communities.
1.3 Impacts on plant performance
While pathogenic microbes decrease plant performance, plants also experience positive microbial influences on their productivity by increasing growth or by helping plants to cope with stress (Schnitzer et al., 2011). Hence, some microbes can produce plant growth-promoting phytohormones, such as indole-3-acetic acid (IAA), as well as can mediate acquisition by the plant of nitrogen, phosphate, iron and nitrogen (Knief et al., 2010; Ofek-Lalzar et al., 2014; Sessitsch et al., 2012). Bacteria that perform one or — more commonly (Bruto et al., 2014) — many of these functions in the root are categorized as plant growth-promoting rhizobacteria (PGPR).
pathogens and mediated by salicylic acid (Conrath et al., 2006). MIR shares some charac-teristics with both ISR and SAR, and while the standard view is that fungal stimulation is directly responsible for induced resistance, it has been hypothesized that MIR is a cumulative effect of plant responses to mycorrhizal infection and ISR-inducing rhizobacteria (Pozo and Azc´on-Aguilar, 2007; Zamioudis and Pieterse, 2012). Some rhizobacteria are capable of both plant growth-promoting activity and ISR induction. For example, Pseudomonas fluorescens strain WCS417 promotes growth mediated by IAA production and ACC deaminase activity, and ISR via jasmonic acid signalling (Schwachtje et al., 2012; Zamioudis et al., 2013).
Differential bacterial colonization of varying plant genotypes can occur at the community level or within a single microbial species. The latter is certainly the case with P. fluorescens strains (Haney et al., 2015), in which different ecotypes of A. thaliana support different levels of colonization by various strains differing in their ability to promote plant growth and protect against pathogens. Lower colonization did not correlate with higher defense response gene expression, but instead appeared to be related to some other incompatibility. Concordantly, the normal growth promotion and pathogen protection did not occur in ecotypes with the decreased levels of colonization (Haney et al., 2015). More recently, a genetic approach has shown that the plant defense hormone salicylic acid affects the abundance of specific bacterial groups in the root at a high taxonomic level via a combination of direct and indirect effects (Lebeis et al., 2015); importantly, overproduction of salicylic acid leads to the decreased biomass accumulation in plants (Bowling, 1994) Overall, these results suggested the existence of complex fitness trade-offs where the result of the plant-bacteria interaction is determined by the specific combination of plant accession, bacterial strain and plant pathogen in the environment.
hypotheses between plants and microbial environments become evident; in particular, it is important to understand how plant domestication has impacted the ability of plants to form microbial partnerships. Because plant domestication leads to a loss of diversity of theloci under selection, and those adjacent to them, a possible consequence is the loss of traits that were not directly under artificial selection; for this reason, it has been hypothesized that domestication has reduced the ability of plants to form beneficial associations with rhizosphere microbes (P´erez-Jaramillo et al., 2016). Indeed, recent studies have found that there are specific, but not overlapping, differences between wild and domesticated root microbiomes of both lettuce and barley (Bulgarelli et al., 2015; Cardinale et al., 2015). Specifically, compared to wild barley, domesticated barley grown in a common soil had increased relative abundance of the bacterial classes Alphaproteobacteria and Betaproteobacteria (Bulgarelli et al., 2015), which contain a number of taxa known to affect plant health, such as rhizobia. The mechanisms behind these changes might involve the microbial genes found in the core set of root micro-organisms. Thus, using shotgun metagenome sequencing of barley rhizosphere communities, it was discovered that bacterial genes related to their interactions with both plant and phage were under positive selection, promoting secretion (e.g. type 3 secretion systems), nutrient acquisition (e.g. siderophores) and stress tolerance (e.g. detoxification) (Bulgarelli et al., 2015). These results are strikingly similar to those from a metagenomic study performed on rice rhizospheres (Sessitsch et al., 2012), as well as anecdotal evidence for genes found in individual PGPR Pseudomonas strains (Berendsen et al., 2015). Together, these observations suggest that plant beneficial traits are repeatedly selected by the plants and/or indirectly by farmers and breeders during domestication.
and leaf area (Zuppinger-Dingley et al., 2014). Negative impacts of plant monoculture in fields on microbial biodiversity might be influenced by an accumulation of plant-specific beneficial and pathogenic microbes. While no studies have directly demonstrated whether pathogens or beneficial microbes accumulate more rapidly, a recent study with tobacco grown in a native soil demonstrated the accumulation of both within a decade of field establishment (Santhanam et al., 2015). It is possible that diversity plays a similar role in maintaining a healthy plant microbiome, but systematically controlling and varying diversity in microcosm reconstitution experiments is required to fully distinguish between cause and effect. Thus, conspecific fields have decreased microbial diversity with a correlating increase in diseased plants (Schnitzer et al., 2011). Indeed, with increasing plant diversity from 1 to 15 species, there is a decrease in non-mycorrhizal infection, while beneficial mycorrhizal infection remains constant (Schnitzer et al., 2011). Together these indicate that higher microbial species diversity decreases the plant-pathogen interactions leading to improved plant growth.
1.4 Conclusion
CHAPTER 2
Defining the core Arabidopsis thaliana root microbiome
1Land plants associate with a root microbiota distinct from the complex microbial com-munity present in surrounding soil. The microbiota colonizing the rhizosphere (immediately surroundingthe root) and the endophytic compartment (within the root) contribute to plant growth, productivity, carbon sequestration and phytoremediation (Rodriguez et al., 2008; De Deyn et al., 2008; van der Lelie et al., 2009). Colonization of the root occurs despite a sophis-ticated plant immune system (Jones and Dangl, 2006; Dodds and Rathjen, 2010), suggesting finely tuned discrimination of mutualists and commensals from pathogens. Genetic principles governing the derivation of host-specific endophyte communities from soil communities are poorly understood. Here we report the pyrosequencing of the bacterial 16S ribosomal RNA gene of more than 600 Arabidopsis thaliana plants to test the hypotheses that the root rhizo-sphere and endophytic compartment microbiota of plants grown under controlled conditions in natural soils are sufficiently dependent on the host to remain consistent across different soil types and developmental stages, and sufficiently dependent on host genotype to vary between inbred Arabidopsis accessions. We describe different bacterial communities in two geochemically distinct bulk soils and in rhizosphere and endophytic compartments prepared from roots grown in these soils. The communities in each compartment are strongly influenced
1Most of the content of this chaper has been published before as a peer-reviewed article (Lundberg et al.,
by soil type. Endophytic compartments from both soils feature overlapping, low-complexity communities that are markedly enriched in Actinobacteria and specific families from other phyla, notably Proteobacteria. Some bacteria vary quantitatively between plants of different developmental stage and genotype. Our rigorous definition of an endophytic compartment microbiome should facilitate controlled dissection of plantmicrobe interactions derived from complex soil communities.
Roots influence the rhizosphere by altering soil pH, soil structure, oxygen availability, antimicrobial concentration, and quorum-sensing mimicry, and by providing an energy source of dead root material and carbon-rich exudates (Marschner et al., 1986; Dennis et al., 2010). The microbiota inhabiting this niche can both benefit and undermine plant health; shifting this balance is of agronomic interest. Mutualistic microbes may provide the plant with physiologically accessible nutrients and phytohormones that improve plant growth, may suppress phytopathogens or may help plants withstand heat, salt and drought (Mendes et al., 2011; Fir´akov´a et al., 2007). The rhizosphere community is a subset of soil microbes that are subsequently filtered via niche utilization attributes and interactions with the host to inhabit the endophytic compartment (EC) (Schulz et al., 2006). Although a variety of microbes may enter and become transient endophytes, those consistently found inside roots are candidate symbionts or stealthy pathogens (Schulz et al., 2006; Hallmann et al., 1997). Notably,Arabidopsis and other Brassicaceae are not well colonized by arbuscular mycorrhizal fungi, implying that other microorganisms may fill this niche.
studies and, because of controlled experimental design and the power of deep sequencing, provide a key step towards the definition of this microbiomes functional capacity and the host genes that potentially contribute to microbial association phenotypes. Such plant genes would constitute major agronomic targets.
We used 454 pyrosequencing to sequence 16S ribosomal RNA (rRNA) gene amplicons for DNA prepared from eight diverse, inbred A. thaliana accessions. Plants were grown fromsurface-sterile seeds in climate-controlled conditions in two diverse soils, respectively termed Mason Farm and Clayton (Supplementary Table 1; detailed in methods 2.1.2). For each soil, we assayed multiple individuals from each A. thaliana accession grown from sterile seeds in both soils across independent full-factorial biological replicates, in which all genotypes and bulk soils (pots without a plant) for a given soil type were grown in parallel (Supplementary Table 2). We isolated separate rhizosphere and EC fractions from individual plant root systems (Fig. 2.13 and Supplementary Table 2). We established 1114F and 1392R as our primer pair (methods 2.1.9 and 2.1.10; Fig. 2.14). Using an otupipe-based pipeline (http://drive5.com/otupipe/), we grouped sequences into 97%-identical operational taxonomic units (OTUs), reduced noise and removed chimaeras (methods 2.1.11). We determined technical reproducibility thresholds to conclude that OTUs defined by ≥ 25 reads in≥ 5 samples (hereafter25x5) are individually measurable OTUs (Benson et al., 2010; Gottel et al., 2011) (Figs 2.18 and 2.15; methods 2.1.11). All data reported here are from one run of our otupipe-based pipeline (Fig. 2.16 and Supplementary Database 1).
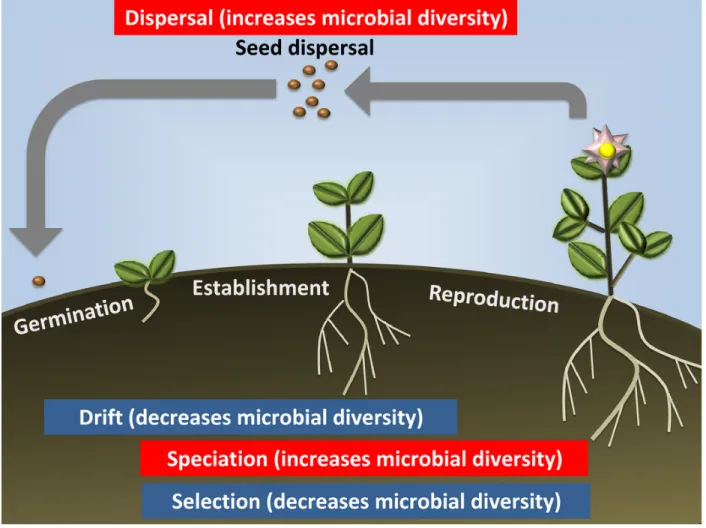
Figure 2.2: Sample fraction and soil type drive the microbial composition of root-associated endophyte commu-nities. a) Principal Coordinate Analysis of pairwise, normalized, weighted UniFrac dis-tances between samples based on rarefaction to 1,000 reads in usable OTUs. CL, Clayton; MF, Mason Farm; R, rhizosphere; S, soil. b), Hierarchical clustering (group-avegage link-age) of the log2-transformed rarefied counts
from the measurable OTUs. Based on the pairwise BrayCurtis dissimilarity.
Figure 2.3: Sample fraction and soil type drive the microbial composition of root-associated endophyte commu-nities. a) Principal Coordinate Analysis of pairwise, normalized, weighted UniFrac dis-tances between samples based on relative abundances of usable OTUs. CL, Clayton; MF, Mason Farm; R, rhizosphere; S, soil. b), Hierarchical clustering (group-avegage link-age) of the log2-transformed relative
abun-dances from the measurable OTUs. Based on the pairwise BrayCurtis dissimilarity.
Database 2b). Using the 25x5 threshold, we defined 778 measurable OTUs representing 54% (3,463,632) of the usable reads (Fig. 2.1c and Supplementary Table 3). The diversity of the 778 measurable OTUs in soil, rhizosphere and EC fractions showed expected relative trends when compared with the diversity by fraction of all usable OTUs (Fig. 2.1d). We display parallel analyses of the rarefaction-normalized and frequency-normalized data, while in the text we use the numbers from the rarefied data.
that the two bulk soils and their associated rhizospheres were differentiated from the respective EC fractions. Soil type was the main factor in the second component (PCo2). This pattern was recapitulated by hierarchical clustering of pairwise BrayCurtis dissimilarities considering only measurable OTUs (Figs. 2.2b and 2.3b). Samples harvested at different developmental stages clustered together, indicating that this variable does not have a major effect on overall community composition (Figs. 2.2 and 2.3; yng versus old, where yng refers to the time of appearance of an inflorescence meristem and old refers to fruiting plants with greater than 50% senescent leaves). Additional control samples from the reference genotype Col-0 harvested from four independent digs of Mason Farm soil underscored the reproducibility of these bacterial community profiles (Fig. 2.4). Together, these data demonstrate that the interaction of diverse soil communities with plants determines the assembly of the rhizosphere, leading to winnowed ECs, that the ECs from at least these two diverse soils are very different from the starting soil communities and that there is little difference in communities over host developmental time.
We fitted a general linear mixed model (GLMM) to samples from each set of plant fractions (rhizosphere or EC), plus the bulk soil controls, to identify measurable OTUs whose abundances differ significantly between plant and bulk soil as a result of soil type, developmental stage, fraction and genotype (methods 2.1.12 and Supplementary Database 3). This approach allowed us to quantify the contribution from each variable to the community composition (Supplementary Table 4). Controlling for sequencing plate effects, plant fraction is the most important factor; its effect is strongest for the EC, consistent with our UniFrac and BrayCurtis analyses. Soil type is less important, followed by experiment, developmental stage and, finally, genotype, which had a small but consistent effect.
Figure 2.4: OTUs identified from four independent biological replicates are repro-ducible. Heat map displaying the reproducibility between four independent replicates at the yng developmental stage of bulk soil (squares), Col-0 R samples (triangles), and Col-0 EC samples (circles). Each symbol represents the median of six or more samples. All data were log2-transformed for visualization. The quantities in the color key represent the original
(untransformed) counts (top) and frequencies (bottom) for each color. OTUs that had a median of 0 in all Col-0 and soil groups shown and were removed from the display.
Figure 2.5: OTUs that differentiate the EC and rhizosphere from soil. A Heat map showing rarefied abundances from rhizosphere- and EC-differentiating OTUs. Different hues of the same colour correspond to different replicates as in Fig. 2.2. B Strength of GLMM predictions. a, OTUs predicted as EC enriched (red, up) or EC depleted (blue, down). OTUs with consisten behsviout in both soils are shown in darker hues. b OTUs that achieve higher abundance in the EC of plants in Mason Farm (brown, up) or Clayton (gold, down) than on the other soil. c OTUs predicted as rhizosphere enriched (as in a). d
Figure 2.6: OTUs that differentiate the EC and rhizosphere from soil. A Heat map showing relative abundances from rhizosphere- and EC-differentiating OTUs. Different hues of the same colour correspond to different replicates as in Fig. 2.2. B Strength of GLMM predictions. a, OTUs predicted as EC enriched (red, up) or EC depleted (blue, down). OTUs with consisten behsviout in both soils are shown in darker hues. b OTUs that achieve higher abundance in the EC of plants in Mason Farm (brown, up) or Clayton (gold, down) than on the other soil. c OTUs predicted as rhizosphere enriched (as in a). d
were not also enriched in the EC (Supplementary Table 3). Hence, the A. thaliana EC microbiome is enriched for both a shared set of OTUs commonly assembled across two replicates from two diverse soils, and a set of OTUs that are assembled from each soil.
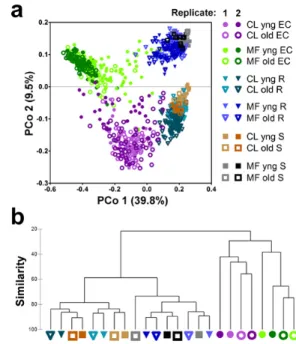
We assessed taxonomic distributions, first those of the 778 measurable OTUs in soil, rhizosphere and EC fractions, and then those of the 256 EC-enriched and 32 EC-depleted OTUs (Figs. 2.5C and 2.6c, and Supplementary Table 3). Measurable OTUs were distributed across seven dominant phyla and contained,5070% of the usable reads in all fractions (Fig. 2.10c). Phyla distribution of the EC-enriched OTUs reflected that of the entire EC. Conversely, the phyla distribution of the EC-depleted OTUs typically resembled that of the rhizosphere fraction (Figs. 2.5C and 2.6c). The lower Shannon diversity (Figs. 2.5C and 2.6c, numbers above bars) of the EC fraction is consistent with enrichment for a subset of dominant phyla. Specifically, the EC microbiome was dominated by Actinobacteria, Proteobacteria and Firmicutes, and was depleted of Acidobacteria, Gemmatimonadetes and Verrucomicrobia, when soil types were considered either together or separately (Figs. 2.5C, 2.6c and 2.19, and Supplementary Table 5). Lower-order taxonomic analysis (Figs. 2.5D and 2.6d) demonstrated that enrichment of a low-diversity Actinobacteria community in the EC was driven by a subset of families, predominantly Streptomycetaceae.
Other phyla, such as Proteobacteria, were represented by both EC enrichments and EC depletions at the family level (Fig. 2.5E and 2.6e). Strikingly, two alphaproteobacterial families, Rhizobiaceae and Methylobacteriaceae, and two gammaproteobacterial families, Pseudomonadaceae and Moraxellaceae, dominated the EC population in their respective classes (Figs. 2.5F and 2.6f,αandγ). Equally striking was the EC redistribution of particular alpha- and gammaproteobacterial families that were common in soil and rhizosphere (Figs. 2.5F and 2.6f)
Figure 2.7: Dot plots of notable OTUs. Rarefied counts for each OTU are shown in a log2-scale. ah Abundances by sample group. Biological replicates in the same column
have different hues. The median of each replicate is shown with a horizontal black bar. i-j
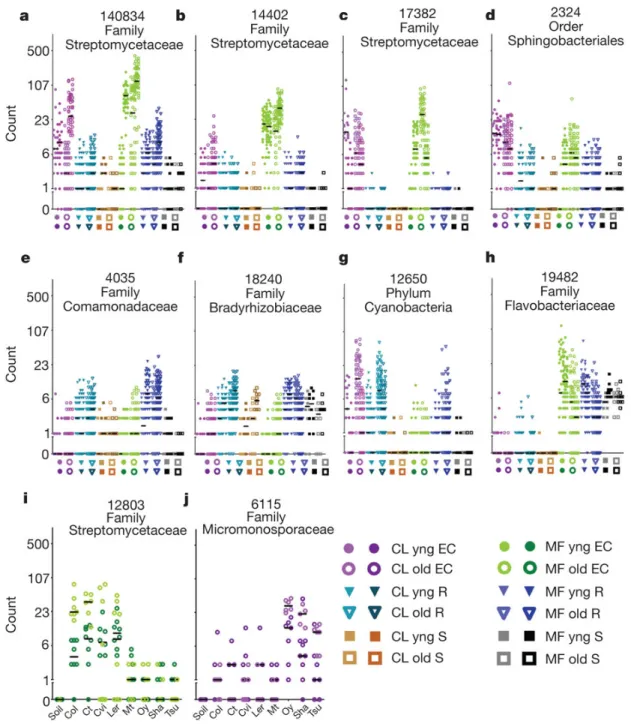
Figure 2.8: Dot plots of notable OTUs. Relative abundances for each OTU are shown in a log2-scale. ah Abundances by sample group. Biological replicates in the same column
have different hues. The median of each replicate is shown with a horizontal black bar. i-j
2.8e-f, and Supplementary Table 3), or were associated with one of the two developmental stages (Figs. 2.7g-h and 2.8g-h, and Supplementary Table 3). Data in Figs. 2.5, 2.6, Fig. 2.7 and 2.8, and Supplementary Table 3 demonstrate that entire taxa at various levels are enriched in or depleted from the EC microbiome. Additionally, rhizosphere taxa capable of colonizing the root vicinity are nonetheless prevented from colonizing the EC.
Several OTUs differentiated inbred A. thaliana accessions. Genotype-dependent enrich-ments and depletions were significant but weak (Supplementary Tables 5 and 3). To identify accession-dependent effects specific to a soil type or a developmental stage, we fitted a partial GLMM that modelled each genotype against bulk soil for each experiment or developmental stage group, and tested the models predictions with a non-parametric KruskalWallis test corrected for multiple testing (methods 2.1.13). We considered only those significant accession-dependent effects that were present in the same direction in both biological replicates. We further required that these OTUs have a consistent prediction in the full GLMM, which narrowed the field to 12 OTUs (or 27 with frequency-normalized data; Supplementary Table 3). In Figs. 2.7 and 2.8, we display relative abundances of two such OTUs, one for each soil type, both Actinobacteria (Figs. 2.7i-j and 2.8i-j). That these enrichments were detected by the full GLMM (which accounts for plate effects due to 454 sequencing), and were sequenced over several plates (Fig. 2.9) supports a true genotype effect. Thus, a small subset of the EC microbiome is likely to be quantitatively influenced by host-genotype-dependent fine-tuning in specific soil environments. This could allow compensatory contributions of the EC microbiome and host genome variation to overall metagenome function.
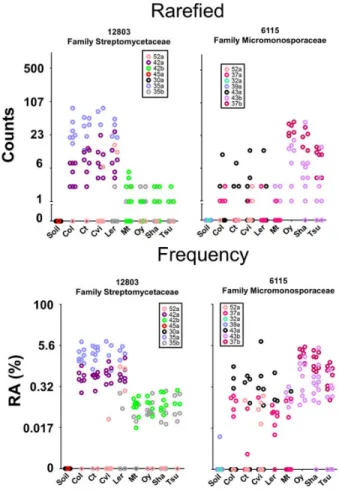
Figure 2.9: Genotype-variable OTUs colored by sequence plate. Displays the data from Figs 2.7i-j and 2.8i-j colored by sequence plate according to the legend within each plot. (Note: ’a’ and ’b’ in our plate naming scheme do not represent different regions of the same
plate. All 454 regions were modeled independently in the Full GLMM).
Figure 2.10: CARD-FISH confirmation of Actinobacteria on roots. A single set of Mason Farm yng Col-0 roots were fixed and stained using CARD-FISH. DAPI, 4’,6-diamidino-2-phenylindole. Double CARD-FISH was applied using the EUB338 eubacterial probe (green) and either the NON338 probe (a), which is the nonsense negative control of EUB338, or the HGC69a Actinobacteria probe (b). Inset, twofold enlargement of boxed region. Scale bars, 50µm.
variety of bacteria (Fig. 2.11d) consistent with previous observations (Chi et al., 2005). These results are PCR independent support for our sequencing methods.
We present a reduced-complexity, robust experimental platform with which to study root microbiota. Our data, and similar conclusions presented in a companion publication (Bulgarelli et al., 2012) using a similar platform, provide the deepest analysis available regarding the principles of root microbiome assembly for any plant species. Remarkably, our conclusions are very similar to those in the work by Bulgarelli et al. (2012) and we identify phyla and family level enrichments in the EC fraction that largely overlap with those reported by Bulgarelli et al. (2012). We note three main differences between our study and that of Bulgarelli et al. (2012): different soils from a different continent, a different primer pair and a different portion of root harvested (top 3cm by Bulgarelli et al. (2012); whole root here).
Figure 2.11: Quantification of microbes in the three sample fractions using CARD-FISH. Four sets of Col-0 roots were pooled, processed, diluted, and put onto filters. a
Number of bacteria present in each sample estimated by co-staining with EUB338 and DAPI (methods 2.1.21). Sample sizes are: bulk soil (n=40), rhizosphere (n=39), and endophytic compartment (n=40). Asterisks indicates statistical significance at p <1x10⁻¹⁶ (ANOVA
(Dennis et al., 2010). Thus, a diverse bacterial community can surround the root surface and thrive there, recruited by biophysical and/or host-derived metabolic cues. We demonstrate that theA. thaliana microbiome undergoes dramatic loss of diversity as the spatial level of plantmicrobe ’intimacy’ further increases from the external rhizosphere to the intercellular EC. Both common and soil-type specific OTUs are established inside roots grown in diverse soils. A small number of bacterial taxa, particularly the Actinobacteria family Streptomycetaceae, and several Proteobacteria families, are highly enriched in the EC. Actinobacteria are well known for production of antimicrobial secondary metabolites (Fir´akov´a et al., 2007), and many proteobacterial families contain plant-growth-promoting members. Conversely, several taxa (Acidobacteria, Verrucomicrobia and Gemmatimonadetes, and various proteobacterial families) that are common in soil and rhizosphere are depleted from the EC. This depletion suggests that these taxa are either actively excluded by the host immune system, outcompeted by more successful EC colonizers or metabolically unable to colonize the EC niche. Our identification of a limited-diversity EC facilitates detailed characterization of the isolates comprising the core A. thaliana microbiome, which could facilitate the design of community-based plant probiotics.
meet environment-specific host needs, balancing contributions of EC microbiome and host genome variation to overall metagenome function. These two generalities suggest that the A. thaliana root microbiome might assemble by core ecological principles similar to those shaping the mammalian microbiome, in which core phylum level enterotypes provide broad metabolic potential combined with modest levels of host-genotype-dependent associations that individualize the metagenome (Arumugam et al., 2011; Spor et al., 2011). Isolation and characterization of the microbes that define host-genotype-dependent associations, and characterization beyond the 16S gene, should be particularly instructive in unravelling the molecular rules contributing to endophytic colonization and persistence.
2.1 Methods
2.1.1 General strategy
2.1.2 Soil collection and analysis
For each full-factorial experiment, the top 8inches of earth were collected with a shovel and transported to the lab in closed plastic containers at room temperature from two collection sites. The first collection site, Mason Farm, is managed by the North Carolina Botanical Garden and is free of pesticide use and heavy human traffic and is located in Chapel Hill, North Carolina, USA (+35°53’30.40”, -79°1’5.37”). The second collection site is the Central Crops Research Station in Clayton, North Carolina, USA (+35°39’59.22”, 78°29’35.69”) and is also free of pesticide use. Visible weeds, twigs, worms, insects and so on were removed with gloves, and the soil was then crushed with an aluminium mallet to a fine consistency and sifted through a sterile 2mm sieve. Because sieved soil from Mason Farm drained poorly and test plants grown in it suffered from hypoxia, we adopted the practice of mixing sterile (autoclaved) playground sand into both Mason Farm (MF) and Clayton (CL) soils at a soil:sand volume ratio of 2:1. Soil micronutrient analysis was performed on pure and 2:1 mixed soils by the University of Wisconsin soil testing labs.
2.1.3 Seed sterilization and germination
All seeds were surface-sterilized by a treatment of 1min in 70% ethanol with 0.1% Triton-X100, followed by 12min in 10% A-1 bleach with 0.1% Triton-Triton-X100, followed by three washes in sterile distilled water. Seeds were spread on 0.5% agar containing half-strength Murashige & Skoog (MS) vitamins and 1% sucrose. Seeds were stratified in the dark at 4°C for one week, then germinated at 24°C under 18h of light for one week. Seed coat sterility was confirmed by lack of visible contamination on MS plates during germination, and also by absence of visible contamination after plating some of the whole seeds on KB, 1/10-strength LB and 1/10-strength ’869’ bacterial growth media.
Figure 2.12: Pyrosequencing of sterile seedlings as compared to vs. non-sterile EC samples. Abundance of OTUs found in sterile (triangles) and non-sterile (circles) samples. Each position on the X axis represents an OTU in the full dataset (measurable OTUs on top, rare OTUs on bottom) and the position on the Y axis represents the number of sequence reads found in that OTU. Both axes are shown in log scale.
The 34 reads from non-sterile plants were members of 31 OTUs (triangles some overlap on the log-scale axis). No OTU in a sterile plant sample was represented by more than one read, and only two OTUs were shared by more than one of the accessions; both of these shared OTUs were not in the measurable set, and had poor taxonomic classification. 11 of these 31 OTUs were not represented in the non-sterile samples. Furthermore, by including extra unused barcodes in our mapping files, or by sequencing sterile water in excess, we have been able to occasionally ’detect’ single representatives of OTUs in our dataset, demonstrating that technical noise can cause singletons (data not shown). While we cannot rule out that unculturable microbes survive surface sterilization and exist at extremely low abundance, we have no evidence that such microbes exist in A. thaliana roots.
2.1.4 Seedling growth
One-week-old healthy seedlings were aseptically transplanted from MS plates to sterile (autoclaved) 2.5-inch-square pots filled with either MF or CL soil, with one seedling per pot. Seedlings were transferred by lifting from underneath the cotyledon leaves using open tweezers; no pressure was applied to the hypocotyl. Some pots were designated ’bulk soil’ and were not given a plant. All pots, including bulk soil controls, were always watered from the top with a shower of distilled water (non-sterile) as an accessible proxy for rain water that avoids chlorine and other tapwater additives. Pots were spatially randomized and placed in growth chambers providing short days of 8h light (8001,000lx) at 21°C and 16h dark at 18°C. The use of short days was to help synchronize flowering time between A. thaliana genotypes and to facilitate robust rosette and root growth. After harvesting the floral transition developmental stage, remaining plants and bulk soils were moved from the growth chamber to 16 h days in the greenhouse to promote a more synchronized flowering and senescence for the senescent developmental stage.
2.1.5 Harvesting
five or more plants. Cvi-0, Sha-0 and Ct-1 occasionally flowered one to two weeks earlier under our conditions than the other A. thaliana genotypes. The senescence harvest began when five or more plants showed 50% or more yellow and/or brown rosette leaves (Levey and Wingler, 2005); this occurred approximately four to five weeks after transfer to the greenhouse. Senescence occurred in the same order as bolting (flowering).
Our maximum harvesting and processing capacity was 30 plants per day, meaning that each harvesting period for each full-factorial biological replicate (90 pots) lasted between one and two weeks. On each harvest day, we strove to represent all genotypes and at least one bulk soil to avoid potential confounding harvesting artefacts with genotype effects. Because we harvested as many pots each day as time allowed, we did not always harvest in multiples of our genotype number and did not have equal representation of each genotype on each harvest day.
The harvesting scheme is visualized in Fig. 2.13a-c. Using gloves and a flame sterilized work surface, plants are overturned, pots are removed, and soil is crumbled/brushed away leaving ≤1 mm rhizosphere soil on roots. The aboveground plant organs were aseptically removed. Loose soil was manually removed from the roots by kneading and shaking with sterile gloves (sprayed with 70% EtOH) and by patting roots with a sterile (flamed) metal spatulathis neighbouring soil fell to the sterile (flamed) work surface. We followed the established convention of defining rhizosphere soil as extending up to 1mm from the root surface (van Elsas et al., 1988) and we removed loose soil on all root surfaces until remaining aggregates were within this range. Roots were placed in a clean and sterile 50-ml tube containing 25ml phosphate buffer (per litre: 6.33g of NaH2PO4∗H2O, 16.5g of Na2HPO4∗7H2O, 200µl Silwet
3,200g to form a pellet containing fine sediment and microorganisms.
Most of the supernatant was removed and the loose pellets were resuspended and trans-ferred to 1.5 ml microfuge tubes, which were then spun at 10,000g for 5min to form tight pellets, from which all supernatant was removed. These rhizosphere pellets, averaging 250mg, were flash-frozen in liquid nitrogen and stored at 80C until processing. The root systems, while in the 25ml of new buffer, were cleaned of remaining debris with sterile tweezers and transferred to new sterile buffer tubes until the buffer was clear after vortexing (without major sediment on the tube bottom). The roots were then sonicated in a Diagenode Bioruptor at low frequency for 5min (five 30 s bursts followed by five 30 s rests). The sonication further disrupted tiny soil aggregates and attached microbes, cleaning the root exterior. We opted for physical removal of surface microbes by sonication instead of killing them with bleach because sequencing measures DNA; at lower concentrations, bleach kills microbes without necessarily destroying the DNA. Although an extended bleach treatment would also destroy unwanted DNA, it could also enter roots and destroy DNA of interest.
After sonication, the roots were snap-frozen, freeze-dried to remove ice and then stored at 80°C until processing. Our rhizosphere and EC fractions were collected using time-practical protocols designed to partition sequencing-quality DNA and may differ slightly from classic definitions of these fractions that rely on partitioning culturable bacteria. We note that sonication may leave some rhizoplane microbes behind, especially if they are in a microniche shielded from the ultrasound. Such artefacts may cause our collected fractions to differ from theoretical definitions.
2.1.6 DNA extraction