Identification of the Parameters of the Instantaneous Point
Pollution Source in the Azov Sea Based on the Adjoint Method
V.S. Kochergin
*, S.V. Kochergin
Marine Hydrophysical Institute, Russian Academy of Sciences, Sevastopol, Russian Federation
*e-mail:[email protected]
The passive admixture transport model in the Azov Sea is considered. The problem of cartelistic impulse local source identification at the sea surface based on adjoint method is solving by integration of independent series of adjoint tasks. Simultaneous solution of this problem at the parallel mode is realized by the aforementioned approach. The efficiency of the algorithm optimal value power of source search agreed with the data measurements is shown in the test example. The measurement data assimilation algorithm in the passive admixture transfer model is implemented applying variational methods of filtration for optimal estimate retrieval. The retrieval is carried out by means of the method of adjoint equations and solving of linear systems. On the basis of the variational filtration method of data assimilation, the optimal estimate retrieval algorithm for pollution source power identification is constructed. In application of the algorithm, the integration of the main, linked and adjoint problems is implemented. Integration problems are solved using TVD approximations. For the application of the procedure, the Azov current fields and turbulent diffusion coefficients are obtained using the sigma coordinate ocean model (POM) under the eastern wind stress conditions being dominant at the observed time period. Furthermore, the results can be used to perform numerical data assimilation on loads of suspended matter.
Keywords: power source identification, concentration field, assimilation of measurement data, admixture transport, adjoint problem, the Azov Sea.
DOI: 10.22449/1573-160X-2017-1-62-67
© 2017, V.S. Kochergin, S.V. Kochergin © 2017, Physical Oceanography
The adjoint method. Below the model of passive admixture transport in σ-coordinates is considered
σ σ σ C D K y DC A y x DC A x WC y DVC x DUC t DC H
H (1)
with the following conditions on the side boundaries
0 : Г n C
, (2)
the boundary conditions on the surface and at the bottom
, 0 σ : 1 σ , δ δ 0 δ , σ : 0σ 0 0
C y y x x t Q Q Q C S (3)
and the initial data as follows
x,y,σ,0
0C , (4)
where t is the time; x0, y0 are the point source coordinates; D is the dynamic depth; C is the admixture concentration; Q is the instant point source with the power QS; U,V,W are the velocity field components; AH and K are horizontal and vertical diffusion components correspondingly; n is the normal to the side boundary.
Multiplying the expressions (1) – (4) on Cand integrating by parts, taking into account the boundary conditions and the adjoint equation analog to the σ -coordinates 0 σ W y DV x DU t D
, (5)
choosing Cto be a solution of the following adjoint problem:
, 0 σ σ σ C D K y C A y D x C A x D WC y DVC x DUC t DC H H (6) 0 σ : 1 σ , σ : 0 σ , 0 : Г C g C n C
, (7)
0 :
C T
t , (8) we’ll obtain
S S dS g C dS CwhereS is the sea surface;gδ
tT
δ xxn
δ yyn
,n1,...,N, N – is thetotal number of measuring points for the final time. Taking into account the representations for Qand gfrom the formula (9), we have
0, 0, 0,0
, , ,0
*
n n n
SC x y CT x y
Q , n1,...,N. (10)
The formula (9) is similar to the formula obtained in the method of concentration field assessment [10] for different initial conditions, and is inherently a dual representation [9] of concentration through the power and the relevant adjoint problem solution. Note that N of the adjoint problems for Npoints are independent from each other and may be implemented in parallel by different executors (processors).
In case the emission point coordinates
x0,y0
are to be determined, then solving Nof the adjoint problems (6) – (8), it is possible to define the area, ..., , 1
,n N
Ln
where Ln are areas of the essential values of C*n. The preliminary numerical experiments carried out have shown that a priori information about the location and boundaries of the contaminated plume is important in determining the area. Location of the points
xi,yi
on the pollution area boundary permits to narrow significantly the area. The measuring data application in the points of maximal concentration leads to the better conditionality of the problem being solved of the QS.definition. Choosing
xi,yi
,, ,...,
1 M
i M of the systems for various coordinates of the pollution source can be built. The best assessment of QS will correspond to the true condition of the
source. For the condition
xi,yi
x0,y0
the valuesQSn QS, n1,...,N. The values ofQS are found from the system (10) by means of the filtration method [11], well-proven in the solution of oceanographic problems [12]. In case of the overdetermined system (10) and errors in the measuring of Cn, the measuring data filtration taking in account all the information concentrated in Nequations is necessary. As a result of this procedure, the equations of the new system are sorted by rank and uninformative equations are removed. Eventually, in the first equation of the system the equation with the best conditionality appears. By means of this equation the value of QSis foundThe results of numerical experiments. Numerical experiments were carried out applying the model of the work [1] to the Azov Sea. To test the algorithm of the source power identification, the calculation of the model current field under the influence of constant wind of the northeastern direction at a speed of 10 m/s was performed. As a result of simulation the spatial distribution of the coefficients AH
Fig. 1. Location of the instant point source, normed concentration field and measuring points
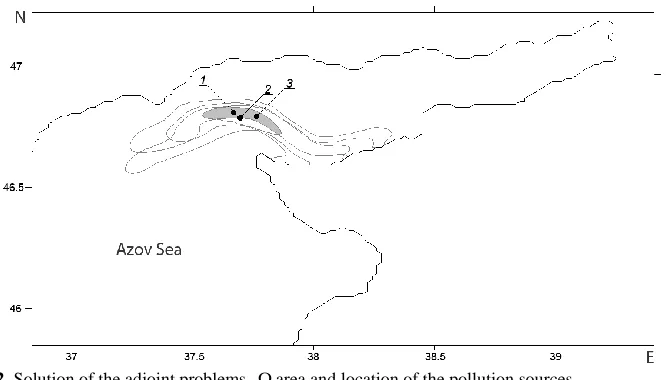
Fig. 2. Solution of the adjoint problems,area and location of the pollution sources
Model concentration field was calculated when QS 1, and the calculation results were normalized to the maximum value. In Fig. 1 the true location of the instant point source is indicated by a black dot. Except the model concentration field, this figure shows four measuring points
N4
. The result of integration of the four adjoint problems (6) – (8) is demonstrated in Fig. 2. The area corresponding to these adjoint problems is colored grey. From this figure it can be clearly seen that the true source location, marked by 1, belongs to the area. For this point the solution of the four equations of the system (10) has the following values: Q1S 1.024, 0.9882,2
S
Q QS30.9581, 1.2446
4
S
Q ; for the point 2 –
8863
.
0
1
S
5234 . 2
1
S
Q , QS2 1.1829, 0.4601
3
S
Q , QS4 1.2467. The point 1 is the true location of the pollution source, as the values in this point are QSi 1. The values
of QSi in the other points are increasingly different from each other, so are not considered. From the overdetermined system (10) for the point 1 on the basis of the filtration method, QS 1.0122is found.
Conclusion. The numerical experiments showed that the result of the pollution source identification parameters to a great degree depend on location of the measuring points. The most accurate reproduction of the true value of the power of the pollution source is obtained in the case where measurements are made in the area of maximum concentration field values, which leads to a better conditionality of the problem being solved. Application of the filtration method in solving the overdetermined system permits to obtain the solution with all the incoming data taken into account. In general, the performed numerical experiments show that the algorithm for the identification of pollution power source is reliable. The results can be used to solve various problems of ecological orientation in the study of the impact of anthropogenic pollution sources in the waters of the Azov and Black Seas.
Acknowledgements. The work was carried out within the framework the state order No. 0827-2014-0010 "Complex Interdisciplinary Studies of Oceanographic Processes Determining the Functioning and Evolution of the Black and Azov Sea Ecosystem on the Basis of Modern Methods of Control of the Marine Environment and Gridtehnology".
REFERENCES
1. Ivanov, V.A. and Fomin, V.V., 2008. Matematicheskoe Modelirovanie Dinamicheskikh Protsessov v Zone More–Susha [Mathematical Modeling of the Dynamic Processes in the Zone Sea–Land]. Sevastopol: ECOSI-Gidrofizika, 363 p. (in Russian).
2. Marchuk, G.I. and Penenko, V.V., 1978. Application of Optimization Methods to the Problem of Mathematical Simulation of Atmospheric Processes and Environment. In: G. I. Marchuk,
ed., 1978. Modeling and Optimization of Complex Systems, Proc. оf the IFIP-TC7 Working
Conf. New York: Springer, pp. 240-252.
3. Kochergin, S.V. and Kochergin, V.S., 2010. Ispol’zovanie Variatsionnykh Printsipov i Resheniya Sopryazhennoy Zadachi pri Identifikatsii Vkhodnykh Parametrov Modeli Perenosa Passivnoy Primesi [Using of Variational Principles and Adjoint Problem Decision during Identification of Input Parameters of Passive Impurity Transport Model]. In: Ekologicheskaya Bezopasnost' Pribrezhnoy i Shel'fovoy zon i Kompleksnoe Ispol'zovanie Resursov Shel'fa
[Ecological Safety of Coastal and Shelf Zones and Complex Use of Shelf Resources]. Sevastopol: MGI NANU. Iss. 22, pp. 240-244 (in Russian).
4. Penenko, V.V., 1981. Metody Chislennogo Modelirovaniya Atmosfernykh Protsessov
[Numerical Simulation Methods of the Atmospheric Processes]. Leningrad: Gidrometeoizdat, 350 p. (in Russian).
6. Shutyaev, V.P., Le Dimet, F.-X., Agoshkov, V.I. and Parmuzin, E.I., 2015. Sensitivity of Functionals in Problems of Variational Assimilation of Observational Data. Izvestiya. Atmospheric and Oceanic Physics, [e-journal] 51(3), pp. 342-350. doi:10.1134/S0001433815030111
7. Ruabtzev, Yu.N. and Shapiro, N.B., 2009. Opredelenie Nachal'nogo Polozheniya Obnaruzhennykh v Otkrytoy Chasti Morya Poverkhnostnykh Linz Ponizhennoy Solenosti Primesi [Determination of the Initial Position Discovered in Open Part of Sea Lenses of Small Salinity]. In: Ekologicheskaya Bezopasnost' Pribrezhnoy i Shel'fovoy Zon i Kompleksnoe Ispol'zovanie Resursov Shel'fa [Ecological Safety of Coastal and Shelf Zones and Complex Use of Shelf Resources]. Sevastopol: MGI NANU. Iss. 18, pp. 141-157 (in Russian). 8. Kochergin, V.S. and Kochergin, S.V., 2015. Identification of a Pollution Source Power in the
Kazantip Bay Applying the Variation Algorithm. Physical Oceanography, [e-journal] (2), pp. 79-88. doi:10.22449/1573-160X-2015-2-69-76
9. Marchuk, G.I., 1982. Matematicheskoe Modelirovanie v Probleme Okruzhayushchey Sredy
[Mathematical Modeling in Environmental Problem]. Moscow: Nauka, 320 p. (in Russian). 10. Kochergin, V.S., 2011. Opredelenie Polya Kontsentratsii Passivnoy Primesi po Nachal'nym
Dannym na Osnove Resheniya Sopryazhennykh Zadach [Determining the Concentration Field with Use the Data Measurements Based on Solving of Adjoint Problems]. In:
Ekologicheskaya Bezopasnost' Pribrezhnoy i Shel'fovoy Zon i Kompleksnoe Ispol'zovanie Resursov Shel'fa [Ecological Safety of Coastal and Shelf Zones and Complex Use of Shelf Resources]. Sevastopol: MGI NANU.Iss. 25, vol. 2, pp. 357-370 (in Russian).
11. Strakhov, V.N., 1991. Metod Fil'tratsii Sistem Lineynykh Algebraicheskikh Uravneniy-Osnova dlya Resheniya Lineynykh Zadach Gravimetrii i Magnitometrii [The Method of Filtering Systems of Linear Algebraic Equations – the Basis for the Solution of Linear Problems of Gravity and Magnetic Measurements]. Doklady AN SSSR, 320(3), pp. 595-599 (in Russian).