CODEN (USA): IAJPBB ISSN: 2349-7750
I
I
N
N
D
D
O
O
A
A
M
M
E
E
R
R
I
I
C
C
A
A
N
N
J
J
O
O
U
U
R
R
N
N
A
A
L
L
O
O
F
F
P
P
H
H
A
A
R
R
M
M
A
A
C
C
E
E
U
U
T
T
I
I
C
C
A
A
L
L
S
S
C
C
I
I
E
E
N
N
C
C
E
E
S
S
Available online at:
http://www.iajps.com Research Article
DEVELOPMENT AND VALIDATION OF RP-HPLC METHOD FOR
QUANTIFICATION OF ACYCLOVIR IN TABLETS
Shital S.Patil
*, P. A. Salunke, R. S. Wagh, Dr. S. D. Barhate
Shree Sureshdada Jain Institute Of Pharmaceutical Education And Research, Jamner, (M.S.)
India.
Abstract:
A reverse phase method has been developed for the quantitative estimation of Acyclovir in tablet. The quantification was carried out using RP stainless steel column Water HEMA C18 (250 x 4.6) mm 5μ column packing in isocratic mode with mobile phase containing methanol, acetonitrile and water in the ratio of 45:45:10, Flow rate of 1.0 ml/min and the detection wavelength were set at 264 nm and the linearity was found to be in the range of 2-10 µg/ml for acyclovir. The proposed method was found to be simple, precise, accurate, and reproducible for the estimation of acyclovir.
Keywords: Acyclovir, method development, validation, high performance liquid chromatography.
Corresponding author:
Shital S. Patil,
Shree Sureshdada Jain Institute Of Pharmaceutical
Education and Research, Jamner, (M.S.)
India.
[email protected]
Please cite this article in press as Shital et al, Development and Validation of RP-HPLC Method for Quantification of Acyclovir in Tablets, Indo Am. J. Pharm. Sci, 2016; 3(1).
INTRODUCTION:
Acyclovir is Guanosine derivative and has potent antiviral activity essentially against herpes simplex type I virus and HSV-2, EBV, VZV [1]. The chemical name for acyclovir is 2 amino-1,9-dihydro-9- [(2-hydroxyethoxy) methyl]-6Hpurine- 6-one, or 9- [(2-hydroxyethoxy) methyl]- guanine. Its molecular formula is C8H11N5O3, and molecular weight 225.21 g/mol [4]. Acyclovir (Fig-1) is commonly used as the free acid form in solid oral dosage forms, whereas the sodium salt is used in parenteral dosage forms. [5]. Acyclovir is normally present in a hydrated form consisting of three acyclovir molecules to two molecules of water, [6] corresponding to a theoretical water content of about 5%, but dose and solubility are normally expressed in units of anhydrous acyclovir. Acyclovir is described as “slightly soluble in water” in different Pharmacopoeias. The solubility of acyclovir in most of the literature are range from 1.2 to 1.6
mg/mL at room temperature (22 to 250C). [7].
Fig 1: Chemical Structure of Acyclovir
MATERIAL AND METHODS: Materials
Acyclovir was obtained from
AurochemPharmceuticals (I) Pvt. Ltd, Thane, India, HPLCgrade acetonitrile, AR grade Methanol was procured from Merck, India and Bransted HPLC water was used as received.
HPLC analysis
The analysis was performed on a chromatographic system of Waters -UV Detector, equipped with manual sampler and DATA ACE software. The chromatographic column was RP stainless steel column Water HEMA C18 (250 x 4.6) mm, 5μ column packing in isocratic mode. HPLC instrument was operated at ambient temperature. The flow rate of the mobile phase was maintained at 1.0 ml/min. Detection was carried out at 264 nm Retention time of Acyclovir was about 1.757 min. Run time was set for 10 min.
Acyclovir standard solution
Accurately weighed 10 mg of Acyclovir tablet was taken into a 10 ml volumetric flask. 5 ml of mobile phase was added to it, sonicated to dissolve and diluted to volume with mobile phase and mixed
Acyclovir standard stock solution
One milliliter of Solution A was diluted to 10 ml with the mobile phase.
Study of Spectra and Selection of Wavelength:
The aliquot portions of standard stock solutions of Acyclovir were diluted appropriately with distilled water to obtain concentration 10 g/mL of drug. The solutions of drug was scanned in the range of 400 – 200 nm. The UV absorbance spectrum of Acyclovir is shown in Figure 2.
Fig 2: UV- Spectrum of Acyclovir
From the spectrum wavelengths selected for estimation of drug was 264 nm as λ max of Acyclovir.
RESULT AND DISCUSSION:
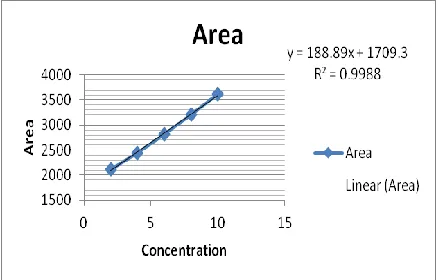
Linearity
The developed method has been validated as per ICH guidelines Each 10 ml of the standard solution of Acyclovir in the concentration range of 2-10 µg/ml each were injected into the chromatographic system. The chromatograms were developed and the peak area was determined for each concentration of the drug solution. Calibration curves of Acyclovir were obtained by plotting the peak area ratio versus the applied concentrations of acyclovir (fig. 3).
The resultant correlation coefficient (R) should be ≥0.99 for Acyclovir. As per linearity graph of Acyclovir. It was linear with co-efficient of correlation (R ) of more than 0.99. The linearity within the range of (80 % to 120%), the standard limits concentration was established.
Precision
Repeatability of the method was checked by injecting six replicate injections of the solution 20µl each of Acyclovir, the RSD was found to be 0.74. The relative standard deviation of reproducibility and repeatability with respect to peak area and retention time are well within the acceptance criteria. Hence, the method was suitable.
Table 1: Inter day Precision study
Sr No. Conc. Area II Mean SD RSD
1 2 2111.61 2151.3 2131.46 28.07 1.32
2 4 2458.12 2483.87 2471.00 18.21 0.74
3 6 2871.41 2916.05 2893.73 31.57 1.09
Table 2: Intra day Precision study
Sr No. Conc. Area II Mean SD RSD
1 2 2111.61 2151.3 2131.46 28.07 1.32
2 4 2458.12 2483.87 2471.00 18.21 0.74
3 6 2871.41 2916.05 2893.73 31.57 1.09
Table 3: Resolution Study of Acyclovir
Sr. no RT TP TF
1 1.757 5527 1.75
2 1.757 5643 1.74
3 1.757 5612 1.76
4 1.757 5631 1.72
5 1.757 5515 1.71
6 1.757 5495 1.72
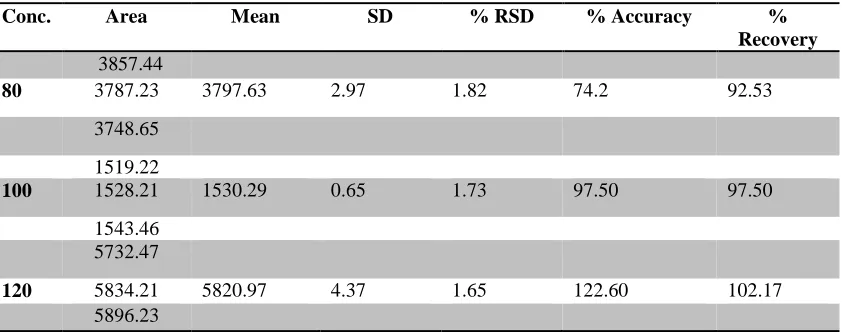
RT- Retention Time, TP- Theoritical Plate, TF- Tailing Factor Table 4: Accuracy study
Conc. Area Mean SD % RSD % Accuracy % Recovery
3857.44
80 3787.23 3797.63 2.97 1.82 74.2 92.53
3748.65
1519.22
100 1528.21 1530.29 0.65 1.73 97.50 97.50
1543.46 5732.47
120 5834.21 5820.97 4.37 1.65 122.60 102.17
Accuracy
The accuracy of the method was tested by carrying out recovery studies at different spiked levels. The estimation was carried out as described earlier. At each level, three determinations were performed and results obtained. The amounts recovered and the values of percent recovery were calculated. The results for Acyclovir have been displayed in Table 4.
The accuracy and recovery results obtained with all the three different concentration levels applied ( 80%,100% & 120%) are well within the acceptance criteria which shows that the method is accurate.
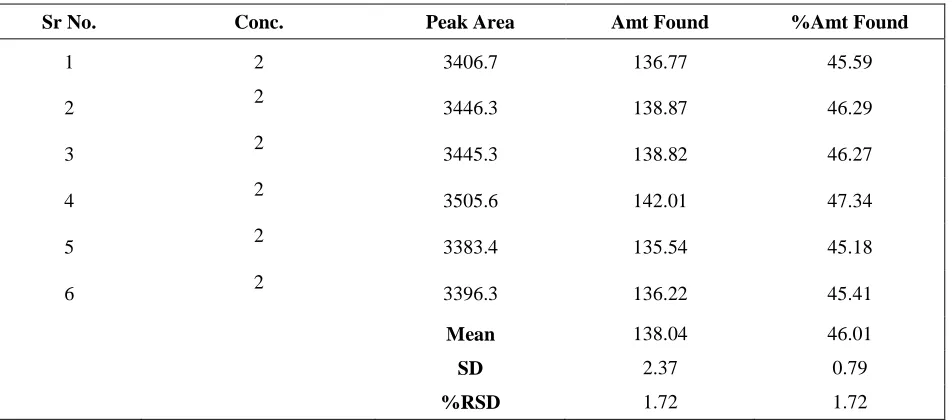
Repeatability
Repeatability was carried out by using a minimum of 6 determinations at 80 percent of the test
concentration.
Table 5: Repeatability study
Sr No. Conc. Peak Area Amt Found %Amt Found
1 2 3406.7 136.77 45.59
2 2 3446.3 138.87 46.29
3 2 3445.3 138.82 46.27
4 2 3505.6 142.01 47.34
5 2 3383.4 135.54 45.18
6 2 3396.3 136.22 45.41
Mean 138.04 46.01
SD 2.37 0.79
%RSD 1.72 1.72
Robustness
The evaluation of robustness should be considered during the development phase and depends on the type of procedure under study. It should show the reliability of an analysis with respect to deliberate variations in method parameters. For eg. Flow rate, Mobile phase composition results were shown in tables 6 and 7.
Specificity
The specificity of the method was checked for the interference of retention time of a blank solution
(without any sample) and then a drug solution of 20 µl was injected into the column, under optimized chromatographic conditions, to demonstrate the separation of Acyclovir. There was no interference of blank on retention time of Acyclovir.
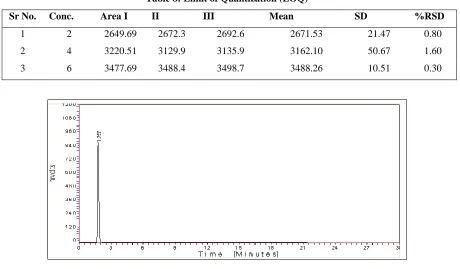
Limit of Quantization (LOQ)
It is the smallest level of analyte that gives a measurable response and standard deviation and slope for the peak area responses was calculated shown in Table 8.
Table 6: Robustness study: Flow change
Sr No. Conc. Area Sr No. Conc ng/Band Area
1 10 3283.06 1 10 3209.65
2 10 3247.36 2 10 3259.15
Mean 3265.21 Mean 3234.40
SD 25.24 SD 35.00
Table 7: Robustness study: Mobile phase
Sr. No. Conc. Area Sr. No. Conc Area
1 2 14966.4 1 2 14963.2
2 2 14593.9 2 2 14669.6
Mean 14780.15 Mean 14816.40
SD 263.40 SD 207.61
%RSD 1.78 %RSD 1.40
Table 8: Limit of Quantization (LOQ)
Sr No. Conc. Area I II III Mean SD %RSD
1 2 2649.69 2672.3 2692.6 2671.53 21.47 0.80
2 4 3220.51 3129.9 3135.9 3162.10 50.67 1.60
3 6 3477.69 3488.4 3498.7 3488.26 10.51 0.30
Fig 4: Typical chromatograph of Acyclovir
Table 9: System Suitability System Suitability Component Parameter Acyclovir
Retention times (RT) min 1.757
Tailing factor (AS) 1.75
Slope 8939.2
Intercept 4900.2
Coefficient of variance 0.9994
System Suitability
System suitability testing is an integral part of many analytical procedures. The tests are based on the concept that the equipment, electronics, analytical operations, and samples to be analyzed constitute an integral system that can be evaluated as such. The system suitability is given in table no.9
CONCLUSION:
The developed method was validated in terms of accuracy,linearity and precision. A good linear relationship was observed. Acyclovir in the concentration ranges of 2-10 µg/ml /ml. The correlation coefficient for Acyclovir was found to be 0.9994. Selectivity experiment showed that there is no interference or overlapping of the peaks either due to diluents with the main peak of Acyclovir. The percentage RSD for precision is <2 which confirms that method is sufficiently precise and the total runtime required for the method is only 5 min for eluting Acyclovir. The proposed method is simple, fast, accurate, and precise and can be used for routine analysis in quality control for Acyclovir.
REFERENCES:
1.ICH-Q2B Validation of Analytical procedure: Methodology International Conference on
Harmonization of Technical Requirement for Registration of Pharmaceuticals for Human Use, Geneva, Switzerland, 1996.
2.ICH, Q2A validation of analytical procedure, Methodology International Conference on Harmonization, Geneva, October 1994.
3.F. S. K. Barar, Chemotherapy of viral diseases (Antiviral drugs). In: Essentials of Pharmacotherapeutics. S. Chand and company Ltd, 2007;468-69.
4.Arnal, J and Gonzailwz-alvarez et.al. Biowaiver monographs for immediate release solid oral dosage forms: Acyclovir. J Pharm Sci, 2008;Vol. 97, 12. 5.Consejo General de ColegiosOficiales de
Farmaceuticos, Cata logo de