w w w . i a j p s . c o m
Page 1468
CODEN (USA): IAJPBB ISSN: 2349-7750
I
I
N
N
D
D
O
O
A
A
M
M
E
E
R
R
I
I
C
C
A
A
N
N
J
J
O
O
U
U
R
R
N
N
A
A
L
L
O
O
F
F
P
PH
HA
AR
R
M
M
AC
A
C
EU
E
U
T
T
I
I
C
C
AL
A
L
SC
S
C
IE
I
EN
N
C
C
ES
E
S
Available online at:
http://www.iajps.com
Research Article
UV ASSAY METHOD DEVELOPMENT AND VALIDATION
FOR SIMULTANEOUS ESTIMATION OF ETODOLAC AND
PARACETAMOL IN TABLETS BY SIMULTANEOUS
EQUATION METHOD
B. Shailaja, M. Afreen, T. Vinay Kumar, A. Ashok Kumar*
Department of Pharmaceutical Analysis and Quality Assurance, Vijaya College of Pharmacy,
Munaganur (village), Hayathnagar (Mandal), Hyderabad – 501511, India.
Abstract:
Objective: To develop a simple and cheap UV spectrophotometric simultaneous equation method for the simultaneous quantitative estimation of Etodolac (400mg) and Paracetamol (500mg) in tablets and validate as per ICH guidelines.
Method: The optimized method uses 100% Triethylammonium phosphate buffer (pH 10) as a diluent for the simultaneous quantitative estimation of Etodolac and Paracetamol in tablets by UV spectroscopy by simultaneous equation method.
Results: The developed method exhibited linearity in the range of 5-15μg/ml for Etodolac and 6.25-18.75μg/ml for Paracetamol. The precision for Etodolac and Paracetamol is exemplified by relative standard deviation of 0.176% and 0.246 respectively. Percentage Mean recovery for Etodolac and Paracetamol were found to be in the range of 90‐110, during accuracy studies.
Conclusion: A simple and a cheap UV spectrophotometric method was developed and validated for the simultaneous quantitative estimation of Etodolac and Paracetamol in tablets as per ICH guidelines and hence it can be used for the routine analysis in various pharmaceutical industries.
Keywords: UV, Etodolac, Paracetamol, Assay, validation.
*Corresponding author:
Dr. A. Ashok Kumar,
Professor and HOD,
Department of Pharmaceutical Analysis and Quality Assurance,
Vijaya College of Pharmacy, Munaganur (village),
Hayathnagar (Mandal), Hyderabad – 501511,
India.
Email: [email protected]
Please cite this article in press as A. Ashok Kumar et al , UV Assay Method Development and Validation for Simultaneous Estimation of Etodolac and Paracetamol in Tablets by Simultaneous Equation Method, Indo Am. J.
Pharm. Sci, 2015;2(11).
w w w . i a j p s . c o m
Page 1469
INTRODUCTIONEtodolac (Figure 1) chemically is {(RS)-2-(1, 8-Diethyl- 4,9-dihydro-3H-pyrano[3,4-b]indol-1- yl)acetic acid}. It is used as anti-inflammatory agent (NSAID:Non Steroidal Anti-Inflammatory Drug), analgesic and antipyretic which act by inhibiting cyclooxygenase-2 enzyme[1-3].
Fig. 1: Structure of Etodolac
Paracetamol (Figure 2) also belongs to the class of NSAIDs having properties of analgesic and antipyretic. Chemically, paracetamol is N-(4-hydroxyphenyl) acetamide[4]. A combination of 500mg of Paracetamol and 400 mg of Etodolac is available commercially as tablet (Brand name: ETOGESIC P).
Fig. 2: Structure of Paracetamol
A detailed literature survey reveals that there exists UV and RP-HPLC assay methods concerning analytical method development and validation for individual drugs Etodolac and Paracetamol. While there are only two reports using methanol and phosphate buffer (pH 7.4) as solvents respectively for simultaneous estimation of Etodolac and Paracetamol in formulation by UV spectrophotometric [5-6]. Hence we have explored a new, accurate, precise and linear UV spectrophotometric method for the quantitative estimation of Etodolac and Paracetamol
in ETOGESIC P tablets and validate as per ICH guidelines.
MATERIALS AND METHODS Materials
Instrument
A double beam UV-visible spectrophotometer (Shimadzu, model 1800) having two matched quartz cells with 1 cm light path and loaded with UV probe software (version 2.41) was used for recording of spectra and measuring absorbance. An electronic analytical weighing balance (0.1mg sensitivity, Shimadzu AY 220), digital pH meter (DELUX model 101) and a sonicator (sonica, model 2200 MH) were used in this study.
Chemicals and Reagents
Analytically pure samples of Etodolac and Paracetamol with purities greater than 99% were obtained as gift samples from Chandra labs, Hyderabad, India and tablet formulation [ETOGESIC P] was procured from MEDPLUS, Hyderabad, India with labelled amount 400mg of Etodolac and 500mg of Paracetamol. Triethylamine (AR Grade) and ortho phosphoric acid (AR Grade) were obtained from SD Fine chemicals (Hyderabad, India). 0.45μm Nylon membrane filters were obtained from Spincotech Private Limited, Hyderabad, India.
Method Solvent
Solvent used is prepared by adding 5ml of triethylamine to 1000 ml of distilled water and later pH was adjusted to 10 using 30% v/v of ortho phosphoric acid in water and triethylamine.
Selection of Wavelength
UV spectrums were recorded individually in the range of 200-400nm for standards Etodolac, Paracetamol and for formulation. 252nm and 227nm were found to max for Paracetamol and Etodolac respectively, which were used in simultaneous equation method for assay determination (Figures 3, 4 and 5).
w w w . i a j p s . c o m
Page 1470
Fig. 4: UV spectrum of Paracetamol
Fig. 5: UV spectrum of Formulation
Simultaneous Equation Method
Two wavelengths selected for the method are 252 nm and 227nm that are absorption maxima’s of Paracetamol and Etodolac respectively. The absorbances were measured at the selected wavelengths and absorptivities for both the drugs at both wavelengths were determined. Concentrations in the sample were obtained by using the following equations.
CX= A1 ay2 – A2 ay1/ ax1ay2 - ax2ay1…………Equation (I) CY= A1 ax2 – A2 ax1/ ay1ax2 - ay2ax1 ……… Equation (II)
Where, A1 and A2 are absorbances of mixture at 252 nm and 227 nm respectively, ax1,ax2, ay1 and ay2 are absorptivities of Paracetamol and Etodolac at 252 nm and 227 nm. Cx and Cy are concentrations of Paracetamol and Etodolac respectively.
Preparation of Stock and Working Standard Solution for Etodolac
10mg of Etodolac was accurately weighed and taken in 100ml clean and dry volumetric flask containing 80ml ofsolvent and then the solution was made up to the mark using the solvent. This is considered as standard stock solution (100g/ml). 1ml of the stock solution was pipetted out and made up to 10 ml to get
a concentration 10µg/ml, treated as working standard, 100% target concentration.
Preparation of Stock and Working Standard Solution for Paracetamol
10mg of Paracetamol was accurately weighed and taken in 100ml clean and dry volumetric flask containing 80ml ofsolvent and then the solution was made up to the mark using the solvent. This is considered as standard stock solution (100g/ml). 1.25ml of the stock solution was pipetted out and made up to 10 ml to get a concentration 12.5µg/ml, treated as working standard, 100% target concentration.
Preparation of Stock and Working Sample Solution
w w w . i a j p s . c o m
Page 1471
RESULTS AND DISCUSSIONMethod Development
Various solvents were explored, including Potassium dihydrogen orthophosphate, triethylammonium phosphate and ammonium acetate buffers varying pH in the ranges of 2-10. Etodolac and Paracetamol were found to be soluble and stable for minimum of 1 hour at room temperature using pH 10 triethylammonium phosphate buffer and hence this buffer was used for the determination of suitable detection wavelength and working concentration of both drugs. In order to test the applicability of the developed method to a commercial formulation, ETOGEIC P was studied at working concentration using simultaneous equation UV method. Assay at working concentration for both the drugs in the formulation was in acceptance limits (90-110%) during extraction of drugs in the sample by shaking for 8 minutes. The protocol affords reproducible quantification of the drugs in the samples ranging between 90 and 110%, which is the standard level in any pharmaceutical quality control. Hence the method is optimized.
Method Validation
Validation of the analytical method is the process that establishes by laboratory studies in which the performance characteristics of the method meet the requirements for the intended analytical application. UV spectrophotometric method developed was validated according to International Conference on Harmonization (ICH) guidelines [7] for validation of analytical procedures. The method was validated for the parameters like system precision, intra-day precision, inter-day precision/ intermediate precision/ ruggedness, linearity and accuracy.
Precision System Precision
Six replicate recording of absorbance at 252nm and 227nmnm for both the drugs individually, at working concentration showed % RSD (Relative Standard Deviation) less than 2, which indicates the acceptable reproducibility and thereby the precision of the system. System precision results are tabulated in Tables 1 & 2.
Table 1: System precision results of Etodolac
n 252nm 227nm
1 0.181 1.374
2 0.175 1.376
3 0.18 1.412
4 0.179 1.373
5 0.174 1.375
6 0.179 1.374
Average 0.178 1.380
STDEV 0.0028 0.01538
%RSD 1.589 1.114
Table 2: System Precision Results of Paracetamol
n 252nm 227nm
1 0.985 0.543
2 0.983 0.535
3 0.982 0.531
4 0.972 0.542
5 0.992 0.543
6 1.02 0.541
Average 0.989 0.539
STDEV 0.016 0.005
%RSD 1.66 0.926
Method Precision
Method precision was determined by performing assay of both the drugs in the formulation under the test of repeatability (Intra day precision) and Inter day precision (Intermediate precision or Ruggedness) at working concentration.
Repeatability (Intra day precision)
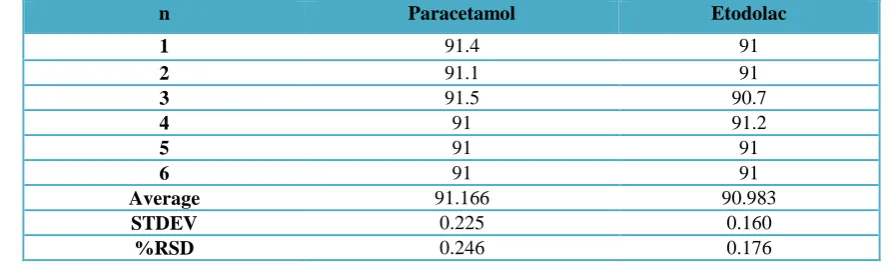
Six replicate recording of absorbance at 252nm and 227nm of the sample from the same homogeneous mixture at working concentration showed % RSD less than 2 concerning % assay for the drugs which indicate that the method developed is method precise by the test of repeatability and hence can be understood that the method gives consistently reproducible results (Table 3).
Table 3: Intra day Precision Results of Etodolac and Paracetamol.
n Paracetamol Etodolac
1 91.4 91
2 91.1 91
3 91.5 90.7
4 91 91.2
5 91 91
6 91 91
Average 91.166 90.983
STDEV 0.225 0.160
w w w . i a j p s . c o m
Page 1472
Intermediate Precision (Ruggedness / Inter dayPrecision)
Six replicate recording of absorbance at 252nm and 227nm of the sample from the same homogeneous mixture at working concentration on a different day by a different analyst, showed % RSD less than 2 for % assay for the drugs within and between days, which indicate the method developed is inter day precise / rugged (Table 4).
Table 4: Inter day Precision Results of Etodolac and Paracetamol.
n Paracetamol Etodolac
1 93.3 90
2 93 90.2
3 93.1 90.3
4 93.3 90.3
5 93.5 90.1
6 93.1 90.2
Average 93.216 90.183
STDEV 0.183 0.116
%RSD 0.196 0.129
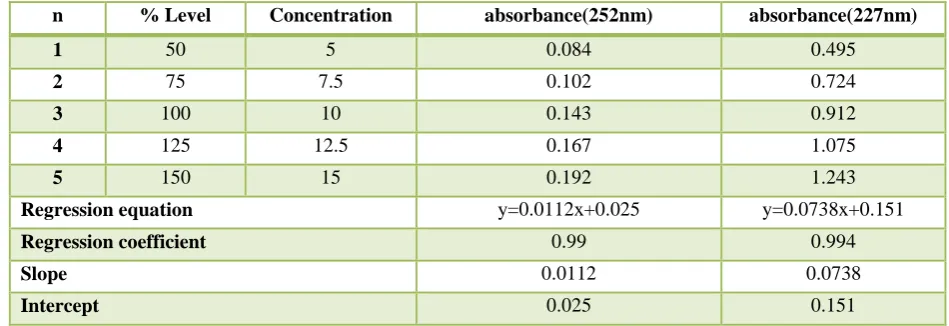
Linearity
Standard solutions of Etodolac and Paracetamol at different concentrations level (50%, 75%, 100%, 125%, and 150%) were prepared in triplicates. Calibration curves were constructed by plotting the concentration level versus corresponding absorbance at 252nm and 227nm for both the drugs. The results show an excellent correlation between absorbance and concentration level within the concentration range of 5-15µg/ml for Etodolac and 6.25-18.7.5µg/ml for Paracetamol (Tables 5, 6). The correlation coefficients were greater than 0.99 for both the drugs, which meet the method validation acceptance criteria and hence the method is said to be linear in the above ranges.
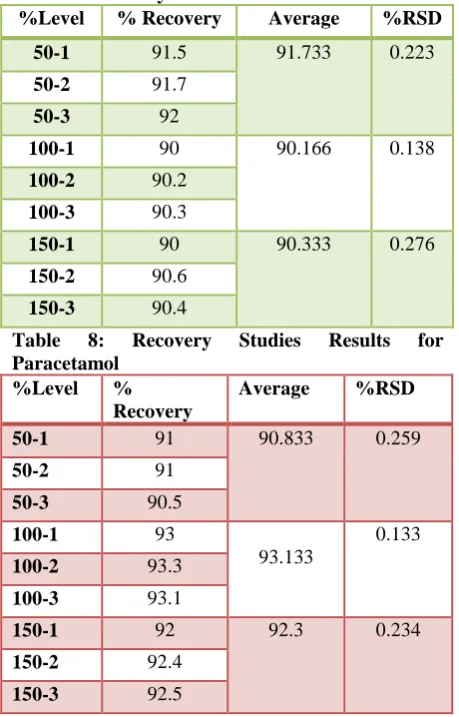
Accuracy was determined by means of recovery experiments, by the determination of % mean recovery of both the drugs from the formulation at three different levels (50-150%). At each level, three determinations were performed. Percent mean recovery and %RSD between recoveries are calculated as shown in Tables 7 and 8. The accepted limits of mean recovery are 90% -110% and %RSD not more than 2% and all observed data were within the required range, which indicates good recovery values and hence the accuracy of the method developed.
Table 5: Calibration Data for Etodolac
n % Level Concentration absorbance(252nm) absorbance(227nm)
1 50 5 0.084 0.495
2 75 7.5 0.102 0.724
3 100 10 0.143 0.912
4 125 12.5 0.167 1.075
5 150 15 0.192 1.243
Regression equation y=0.0112x+0.025 y=0.0738x+0.151
Regression coefficient 0.99 0.994
Slope 0.0112 0.0738
Intercept 0.025 0.151
Accuracy
Table 6: Calibration Data for Paracetamol
n % Level Concentration absorbance(252nm) absorbance(227nm)
1 50 6.25 0.377 0.421
2 75 9.375 0.578 0.514
3 100 12.5 0.859 0.63
4 125 15.625 1.092 0.714
5 150 18.75 1.281 0.799
Regression equation y=0.0746x-0.091 y=0.03x+0.233
Regression coefficient 0.996 0.996
Slope 0.0746 0.03
w w w . i a j p s . c o m
Page 1473
Table 7: Recovery Studies Results for Etodolac%Level % Recovery Average %RSD
50-1 91.5 91.733 0.223
50-2 91.7
50-3 92
100-1 90 90.166 0.138
100-2 90.2
100-3 90.3
150-1 90 90.333 0.276
150-2 90.6
150-3 90.4
Table 8: Recovery Studies Results for Paracetamol
%Level % Recovery
Average %RSD
50-1 91 90.833 0.259
50-2 91
50-3 90.5
100-1 93
93.133
0.133
100-2 93.3
100-3 93.1
150-1 92 92.3 0.234
150-2 92.4
150-3 92.5
CONCLUSION
A cheap and a rapid UV spectrophotometric method was developed and validated for the quantitative estimation of Etodolac and Paracetamol in tablets as per ICH guidelines. The developed method exhibited linearity in the range of 5-15μg/ml for Etodolac and 6.25-18.75μg/ml for Paracetamol. Precision for Etodolac and Paracetamol are exemplified by relative standard deviation of 0.176% and 0.246 respectively. Percentage Mean recovery for Etodolac and Paracetamol were found to be in the range of 90‐110, during accuracy studies. Accordingly it is concluded that the developed UV spectrophotometric method is accurate, precise, linear and rugged and therefore the method can be used for the routine analysis of Etodolac and Paracetamol in tablets in various pharmaceutical industries.
ACKNOWLEDGEMENT
The authors would like to thank the management of Vijaya College of Pharmacy (VJYH), Hyderabad, for providing the necessary facilities to carry out of this research work. The authors are grateful to Chandra labs, Hyderabad for providing drugs in form of gift sample.
REFERENCES
1.Sruthi A, Thanuja N, Sai samhita M, Sudheer kumar D Sreekanth G. A simple RP-HPLC method for simultaneous estimation of Paracetamol and Etodolac in tablet dosage form Indo American Journal of Pharm Research, 2013;3(5):3742-3751. 2.H J Kallur, Prabhudev SM, Bagal VA, Kishore Singh C. Simultaneous estimation of Etodolac and Paracetamol in bulk drug dosage form by RP-HPLC. International Journal of Advances in Pharmaceutical Analysis 2013;3(3):56-67.
3.Mithlesh R, Hinna H, Manjeet A, Rakesh Kumar K. Development and validation of a stability indicating Reverse Phase HPLC Method for simultaneous determination of Etodolac and Paracetamol in its tablet dosage formulation. International Journal of Innovative Research in Science, Engineering and Technology 2015;4(1):19075-19081.
4.Siva Rama Krishna V, Sateesh B, Ravi NT. RP-HPLC method development and validation of Etodolac and Paracetamol in tablet dosage form. International Journal of PharmTech Research 2014;6(2):775-782.
5. Balan P, Carolin Nimila I, Lakshmi Prasanna M, Vanaja Rani M, Rajasekar S. Simultaneous estimation of Etodolac and Paracetamol by UV spectrophotometric method in tablet formulation. Journal of Pharmacy Research 2011;4(6):1663-1665. 6.Jadav Alpa V, Gohel Bhavika A, Sondagar Mital M, Patel Bhavna A, Parmar Shraddha J. Method development and validation for the simultaneous estimation of Paracetamol and Etodolac by Derivative UV spectroscopic method. International Journal of PharmTech Research 2013;5(3):1155-1160.
![Figure 1) chemically is {(RS)-2-(1, 8-4,9-dihydro-3H-pyrano[3,4-b]indol-1- yl)acetic acid}](https://thumb-us.123doks.com/thumbv2/123dok_us/8793820.1768150/2.595.114.492.559.747/figure-chemically-rs-dihydro-pyrano-indol-acetic-acid.webp)