University of Belgrade, Faculty of Organizational Sciences
An Approach to Stock Cover Indicator
Adequacy
UDC: 657.474.51; 005.216.1
DOI: 10.7595/management.fon.2014.0026
SPIN´ 13, Belgrade, 05-06. November 2013.
1. Introduction
Modern customers expect an increasing number of types and quality improvement of products and services (delivery, for example), as well as low prices. Such business conditions dictate the constant development of products/services, the improvement of processes of production, supply and distribution (and maintaining of stocks of raw materials and (semi) products), as well as the improvement of the management process (and planning) – by using new methods and techniques of enterprise management. The goal that the authors of this paper have is to present one of the possible ways to improve (increase adequacy) performance indica-tors of the production/distribution enterprise and to apply it as a new approach to inventory management.
By applying the new approach in practice, the improvement of the methodology for determining (calculat-ing) the value of performance indicators in inventory management of production and/or distribution enter-prise, is verified. The authors also pointed out the functional connectivity of strategy/ methodology for determining /calculating the value of performance indicators inventory management with “market teristics” (level of development) and “components of time series” of realized sales. These market charac-teristics and components of time series directly influence the importance of certain types of stock cover indicators in the vector that represents the complex indicator of balanced stock cover - which is shown in the work of Atanasov et al. (2013).
2. Inventory management based on key performance indicators
The main task of inventory management is the coordination in the realization of common stock policies -adopted by different members of the supply chain; while the common goal is balancing of material/goods flows in achieving customers’ demands satisfaction and minimization of belonging costs (Giannoccaro & Pontrandolfo, 2002). The key performance indicator (KPI) in inventory management, which is considered and used in this paper is the “Stock Cover” (StC); it determines the priorities for replenishment of certain prod-ucts/goods, and hence for the timing of production/or purchase orders launching (Omerbegović-Bijelović, 2006). StC, as the chosen KPI, cannot be considered independently of other KPIs in a production enterprise
Stock cover is presented by a key performance indicator calculating the number of days of forecasted
con-sumption which the current stock level can face. The identified problem in production companies, when
cal-culating the “Stock Cover” indicator companies opt for one of three ways, among which there are large
deviations in planning frequency and launching the orders for procurement or/and production, as well as a
wide aberration in the volume of customer orders; which directly affects costs and competitiveness of
enter-prises. The idea of the authors of this study was to make “Stock cover” indicator and “Balanced Stock Cover”
to be more adequate, and at the same time more efficient and effective in the operational management of a
company.
(also in the chains in which it operates); therefore, it is necessary to realize the impact of certain decisions on the overall business and other KPIs used. According to Lin & Chen (2005), despite the use of KPI in in-ventory management, production enterprises have a defined (among others) KPI that measures the level of customer satisfaction - Customer service level (CSL) which represents a valuable indicator to those who monitor the quality of management (Omerbegović-Bijelović, 1998) to decide whether the established con-cept of inventory management achieves desired results. The basic concon-cept of determining customer satis-faction and appropriate ways to measure that satissatis-faction are listed in Meyr (2009), while further research on the application of indicator CSL - with selective satisfaction of customers’ orders with limited stocks is pre-sented in the paper authored by Lečić-Cvetkovic et al. (2010). Babarogić et al. (2012) pointed out the pos-sibilities for maximizing the customer satisfaction in case of a manufacturing enterprise that operates in conditions of limited production capacities and limited stocks of final products.
Inventory management cannot be considered separately from demand forecasting. In demand forecasting, techniques of time series analysis can help. (Time series is a collection of data which describes the move-ment of the value of some variable in a given period of time.) The time series has four components (Heizer & Render, 2011):
• Trend- gradually ascending or descending trend of data movement over time;
• Seasonality- regular movements in time series (up or down), which are related to events that repeat; these patterns of data behaviour can be repeated after a certain number of hours, days, weeks, months or quarters;
• Cycles- data patterns that occur every few years; there are business cycles (life cycles of products and enterprises), economic cycles, etc;
• Random variations- deviations from the rules in data patterns, which result in random or unusual sit-uations that do not follow the visible pattern and that are difficult to predict.
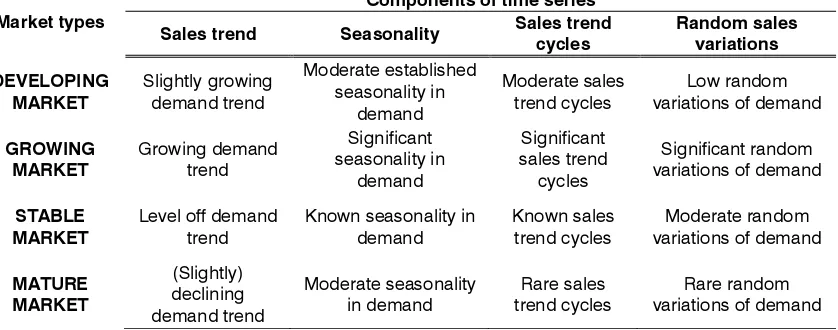
By performing a detailed analysis of trends, seasonality, cycles and variations for each product, while keep-ing in mind the development level of the market in which the enterprise operates, it is possible to generate recommendations for determining the significance of components of the “Balanced stock cover” vector, and, thus, for the right selection of inventory management strategy.
Table 1: Demand in relation to the market characteristics and components of the time series
Speaking of the model of supply chain and inventory management applied approach which is created in ac-cordance with the market needs to be supplied, Hugos (2003) presents a simplified model of market cate-gorization. In this model, the combinations of supply and demand are considered by classifying market into four types:
1. Developing marketis characterized by low and erratic supply and demand, with potential growth in the future; the ability of utilization of the growth potential and development in these markets is based on the efficient management of small quantities of products in stock and fast responses to demand changes;
!
"
!
!#
!
!$
!
2.Growing marketis characterized by demand which exceeds supply, and the supply which is vari-able, hence a successful business in this market directly depends on the provision of high quality cus-tomer service (through timely shipments and deliveries of the entire quantity of ordered products); in contrast to low costs of sales, inventory costs rise - in order to increase the level of stocks, which pro-vides high quality of customer service;
3. In a stable market, supply and demand are high and relatively predictable, so that the relationship be-tween supply and demand is balanced in the long run; this market needs the supply chain manage-ment to focus on inventory optimization (by defining the min-max corridor), while maintaining a high level of customer service;
4. The basic characteristic of the supply chain in a mature marketis that the supply fully meets the de-mand - which is stable or slightly decreasing (due to a large number of competitors and a wide range of supply); in this market, flexibility in responding to changes in demand (in order to achieve a high level of customer service quality) represents the challenge in supply chain management; stocks in an obsolete market are needed to be maintained at a minimum level - to compensate for very high costs of promotion and attracting customers from this market.
The market characteristics and components of the time series represent two important factors that define the demand for a particular product, which is presented in Table 1. The above mentioned market characteris-tics and time series components directly affect the strategy of inventory management and prioritization in the selection of an appropriate type of indicator StC in inventory management.
3. Stock coverage indicators
The Stock cover, expressed through the StC indicator, represents the time period in which the available stocks will be able to satisfy the estimated demand (Omerbegović-Bijelović, 2006). The StC indicator enables the monitoring of stocks increase or decrease in the warehouse, as well as ordering of new stocks. In par-ticular, the basic form of the StC indicator is calculated on the basis of stocks that are available in the en-terprise and that can meet the current demand for products:
(1)
The authors of this paper have identified three different approaches to measuring StC (three types of StC):
a) Based on historical sales (Historical Sales):
(2)
b) Based on sales plan (Sales Plan):
(3)
c) Based on revised sales plan (Last Estimation):
(4)
As observation from different perspectives can provide different values of StC (which becomes the vector StC = (StChs, StCsp, StCle)), the authors propose measuring the balance of the above mentioned three in-dicators - components of the vector StC = (StChs, StCsp, StCle). Details of the measurement of balance of three stated indicators and components of the vector BStC are presented in Atanasov et al. (2013). In the
same paper, the vector Balance indicator StC (BStC) whose value depends on the indicators StChs, StCsp and StCle, is also defined.
In order to improve the application mode of the Balanced stock cover indicator (presented in the paper “An approach to Lean inventory management by balanced stock cover”, presented at the conference Lean-Tech’13), the authors propose further recommendations for the identification of significance coefficients for each of the elements that constitute the BStC vector. In the identification of significance coefficients for StChs, StCsp and StCle in a complex BStC vector it is also recommended to respect the following two cri-teria: 1) “Characteristics of the market in which the enterprise operates,” and 2) “Identified time series in de-mand of the observed product”. In order to transform such decision into the inventory management policy, the authors propose a comparative analysis of: a) Sales data (identification of trends, seasonality, cycles and variations) and b) Characteristics of the market in which the enterprise operates.
4. Case study
The concept of inventory management, by the application of the Balance indicator StC (BStC); it is applied to a real case from the practice of the enterprise whose core business is the distribution of consumer goods in the Serbian market. The planning horizon is one month. By applying Excel spreadsheet tables, a system for calculating the StC according to three different approaches to StC measurement (“historical sales”, “sales plan” and “last estimation”) was created, and the same was done for the Balance indicator StC - for four prod-ucts (Tab. 2).
Table 2: The system of calculation of StC indicator and a balance indicator BStC
(source: Atanasov et al. (2013))
The target value of the StC indicator (defined by the enterprise management) is 1,5 [month], so that the ideal point of balance is positioned in M (1,5; 1,5; 1,5). For product A, the value BStCA = 2,5 is obtained; for product B the value BStCB = 2,3 is obtained; for product C the value of BStCC = 3,5 and for product D the value BStCD D = 1,2. In order to increase the adequacy of the Balance indicator, the authors (in this phase of the topic research) propose further development of the methodology (recommendations) for de-termination of the priorities among StC types in the complex balanced indicator BStC.
For a more precise analysis of the “Stock cover” it is possible to use the technique of analysis of product sales time series. By observing graphics in Fig. 1 (which represents the monthly amount/volume of sales of products A and B), behaviour patterns of the curve (different trends of growth and decline and seasonality) that can be useful in predicting future demand and stock levels can be identified.
!" #
$%$& !" # ! ' '"
#"" ' ' " !"
"" !'(
$%$& #" ' !(! !" '" ' ! '
" # ! "!
(( "!
' ' ((
! '"
$%$& "#! # ! " "! ( ' # "
) "!( '' !' " !"
) ' #
)' !" '! !!
$%$& ) ' '! '' " " " '" '' ! '
Product A– it has a declining trend in demandwith moderate seasonality of demand, which is typical of anobsolete market(Fig. 1). When planning replenishment of stocks, it can be assumed that demand fore-casting is based on historical data, so that the indicator StChshas a major importance in a complex indi-cator BStC. In other words, target stocks should strive to value between 2.5 (BStC) and 1.4 (StChs) weeks of stock cover.
Figure 1:The dynamics of demand for products A and B
For Product B- besides a slight increase in overall demand, expressed seasonality of demandthat oc-curs during the market placement of promotional products can be identified (Fig. 1). At the moment when a promotional product is launched in retail (eg. 20 [%] extra products or more favourable price), sales of the main product fall to a minimum and are close to zero. These characteristics suggest the possibility that this is a market which is in transition from a developingto a growing market. In this case, promotional activi-ties for each product are defined by the sales plan, so that the indicator StCsp has the greatest significance; target stocks should strive to the value of 2,3 weeks of stock cover (in this case BStC = StCsp). If the im-plementation of the promotional activities plan is being continuously monitored, and is in compliance with the sales trend, the revised sales plan has higher accuracy than fixed sales plan, so, in this case, the indi-cator StClehas a greater importance; or, in other words, target stocks should strive to the value between 2.3 (BStC) and 3.4 (StCle) weeks of stock cover.
Product C- in addition to the basic product, it includes a group of promotional products (Fig. 2). A decline in sales of the main product, in periods when promotional product is introduced to the market, can be no-ticed; while, by observing the total amounts, balanced demandis identified. By launching different promo-tional products, the enterprise makes efforts to maintain sales at the previous level, which indicates the characteristics of the market which is in transition from a stableto an obsoletemarket. In this case, there are a number of promotional products, whose launching is planned in advance, and which directly affect the demand for basic products and other promotional products. It is necessary to harmonize replenishment with the sales plan that contains all the necessary data, or, differently put, target stocks should strive to value between 3.5 (BStC) and 2.6 (StCsp) weeks of stock cover.
Product D- example of a product in which promotional products (products “D promo” and “D promo 2”) indicate an expressed seasonality of demandand a decline in an overall demand, which points out to an obsolete market. If the total sales of product D are observed, a negative sales trend can be noted, which brings into question the accuracy of the sales plan (a highly unlikely probability that a sales plan fore-sees sales declining), so business is planned based on the revised sales plan. In this case, the indicator
StClehas a greater importance; or, in other words, target stocks should strive to value between 1.2 (BStC) and 1.4 (StCle) weeks of stock cover.
REFERENCES
[1] Atanasov, N., Lečić-Cvetković, D., Rakićević, Z., & Omerbegović-Bijelović, J. (2013). An approach to Lean inventory management by balanced stock cover, Proceedings of LeanTech’13, Belgrade, Serbia (in printing).
[2] Babarogić, S., Makajić-Nikolić, D., Lečić-Cvetković, D., & Atanasov, N. (2012). Multi-period Customer Service Level Maximization under Limited Production Capacity, Int. J. Comput Commun, 7(5), 798-806. [3] Giannoccaro, I., & Pontrandolfo, P. (2002). Inventory management in supply chains: a reinforcement
learning approach, Int. J. Production Economics, 78, 153-161.
[4] Heizer, J., & Render, B. (2011). Operations management, 10th edition, Prentice Hall.
[5] Hugos, M. (2003). The Essentials of Supply Chain Management, John Wiley & Sons, Inc., USA. [6] Lečić-Cvetković, D., Atanasov, N., & Babarogić, S. (2010). An Algorithm for Customer Order Fulfilment
in a Make-to-Stock Manufacturing System, Int. J. Comput Commun, 5(5), 983-791.
[7] Lečić-Cvetković, D., Atanasov, N., & Omerbegović-Bijelović, J. (2012). Improvement of Supply Chain Management by Bullwhip Effect Reduction, Proceedings of Sym-Org ’12, Zlatibor, Serbia, 226-234. [8] Lin, J., & Chen, J.H. (2005). Enhance order promising with ATP allocation planning considering
mate-rial and capacity constraints, Journal of the Chinese Institute of Industmate-rial Engineers, 22(4).
[9] Meyr, H. (2009). Customer Segmentation, Allocation Planning and Order Promising in Make-to-Stock Production, OR SPECTRUM, 31(1), 229-256.
[10] Omerbegović-Bijelović, J. (1998). Metamanagement and quality of management (in Serbian: Metaupravljanje i kvalitet upravljanja) - monograph, Zadužbina Andrejević, Belgrade.
[11] Omerbegović-Bijelović, J. (2006). Planning and preparation of production and service provision (in Ser-bian: Planiranje i priprema proizvodnje i pružanja usluga), FOS, Belgrade.
Receieved:May 2014.
Accepted: October 2014.
Conslusion
Nikola Atanasov
University of Belgrade,Faculty of Organizational Sciences
atanasovn@fon.bg.ac.rs
Nikola Atanasov, MSc, received his MSc degree in Operations Management from the Faculty of Organizational Sciences in Belgrade in 2012. Currently he is working on his PhD thesis named: “A model for an appropriate set of performance indicators selection for production management”. His current research interests are in the general area of Supply Chain and Production Management. He is the author of more than 30 papers from field of his interest.
Zoran Rakićević
University of Belgrade,Faculty of Organizational Sciences
zrakicevic@fon.bg.ac.rs
Zoran Rakićević, M.Sc., works as a teaching assistant at the Faculty of Organizational Sciences (FOS), Department for Operations management (Chair of Production and Service Management). He completed two master studies: Entrepreneurship and management of SMEs (in 2012) and Operational Research and Computational Statistics (in 2013), and is currently enrolled in PhD studies at the FOS. His research and teaching area of interest includes: Planning of Production and Servicing, Operations management and Entrepreneurship and Management of SMEs.
Danica Lečić-Cvetković
University of Belgrade,Faculty of Organizational Sciences
danica@fon.bg.ac.rs
Danica Lečić-Cvetković, PhD, is an associate professor of Production and Services Management and e-manufacturing at the Department for Operations Management, at the Faculty of Organizational Sciences of the University of Belgrade. Her research interests and fields are related to Operations management, Production and services management, e-manufacture. This author has published more than 70 papers in journals and conference proceedings, published in international and national journals and conferences.
Jasmina Omerbegović-Bijelović
University of Belgrade,Faculty of Organizational Sciences,
omeja@fon.bg.ac.rs
Jasmina Omerbegović-Bijelović, PhD, is a full time professor and Head of Chair of Production and Service Management (Department for Operations management, Faculty of Organizational Sciences, University of Belgrade). Her main areas of interest are: Planning (of production, services and new business venture), Entrepreneurship and Management of small and medium-sized enterprises, Resources management, Servicing management, Tools for Quality improvement and Problem solving. She is an author of the Metamanagement and Metacybernetic system concepts and has published numerous papers in the fields mentioned above.