R E S E A R C H A R T I C L E
Open Access
Changes in the choroidal thickness in
reproductive-aged women with
iron-deficiency anemia
Erhan Yumusak
1,5*, Aydin Ciftci
2, Selim Yalcin
3, Cemile Dayangan Sayan
4, Nevin Hande Dikel
1and Kemal Ornek
1Abstract
Background:The aim of this study was to investigate the potential significance of the central macular thickness (foveal thickness-FT) and choroidal thickness (CT) in the eyes of patients with iron-deficiency anemia, the most common form of the anemia, via enhanced-depth imaging optical coherence tomography (EDI-OCT). We also investigated whether such changes might serve as an early indicator of underlying hematological disease.
Methods:This prospective clinical study compared 96 female patients with iron-deficiency anemia and 60 healthy female control subjects. The macular and choroidal thicknesses in the temporal and nasal subfoveal areas were measured using enhanced-depth imaging optical coherence tomography (EDI-OCT) at 500 and 1500 microns and in five different regions (FCT, T1500, T500, N500, and N1500).
Results:The mean ages of the patients and healthy controls were 34.08 ± 10.39 years and 32.29 ± 8.28 years, respectively (P=0.232). There were no significant changes in macular thickness between the groups (225.58 ± 19.76 vs. 222.45 ± 13.51,P=0.2). The choroidal thickness was significantly reduced in the patient group relative to the controls at all measured points (foveal choroidal thickness,P= 0.042; nasal–500 microns,P= 0.033; temporal–500 microns,P= 0.033; and temporal–1500 microns,P= 0.019). At some points, the choroidal thickness findings correlated with the hemoglobin values (temporal–500 microns,r=−0.287,P= 0.001; nasal–500 microns,r=−0.287, P= 0.005; nasal–1500 microns,r=−0.245,P= 0.016; and temporal–1500 microns,r=−0.280,P= 0.06).
Conclusions:Patients with iron-deficiency anemia had a significantly reduced choroidal thickness.
Keywords:Choroidal thickness, Iron-deficiency anemia, Enhanced-depth imaging optical coherence tomography
Background
The development of optical coherence tomography (OCT) technology has revolutionized the diagnostic, monitoring, and therapeutic approaches to many retinal and systemic diseases. Spectral domain OCT offers improved axial resolution (3 μm), reduces examination times, and accordingly reduces both patient exposure and artifacts by allowing 19,000 A-scans per second. The latest development in OCT technology, swept-source longer wavelength OCT, better penetrates the retinal pigment epithelium (RPE) and thus allows better
visualization of the choroid; however, its use is currently limited to research purposes.
Similar to swept-source OCT, enhanced-depth imaging (EDI), which was recently introduced by Spaide et al. [1], provides greater penetration through the RPE and allows accurate in vivo deep choroidal imaging and measure-ment [2]. Changes in choroidal thickness (CT) have been found to correlate with several factors and systemic conditions such as smoking, changes in arterial pressure, hemodialysis, obstructive sleep apnea syndrome, and systemic sclerosis [3–7].
According to the World Health Organization (WHO), the overall global prevalence of iron-deficiency anemia is 25 %, with rates of 12.7 %, 30.2 %, and 41.8 % among adult men, women of reproductive age, and pregnant women, respectively [8]. Infants have the highest * Correspondence:erhanyumusak@yahoo.com
1
Department of Ophthalmology, Kırıkkale University School of Medicine, Kırıkkale, Turkey
5
Kirikkale University Medical Faculty Hospital District Tahsin Duru Akdeniz Caddesi No: 14, Yahsihan/Kırıkkale 71450, Turkey
Full list of author information is available at the end of the article
prevalence of iron-deficiency anemia, followed by pregnant women and women of reproductive age. In women of reproductive age, the risk of iron-deficiency anemia may accompany a range of important causes of morbidity and mortality [9, 10]. These conditions are the most important cause of menorrhagia in patients with iron-deficiency anemia [11, 12].
In this study, we investigated the potential significance of macular thickness and CT in the eyes of patients with iron-deficiency anemia, the most common form of anemia. We also considered the possibility that such changes might serve as an early indicator of underlying hematological disease. Using semi-automated choroidal segmentation software, we measured changes in CT in the eyes of women of reproductive age with iron-deficiency anemia in comparison with a control group.
Methods
This prospective clinical study was conducted between 2014 and 2015 in accordance with the tenets of the Declaration of Helsinki. The trial protocol was ap-proved by the Local Ethical Committee of the Kırıkkale University. Trial registration was requested on October 12, 2015 (decision no:01/04). All patients and control subjects voluntarily participated in the study and signed an informed consent form prepared according to the ethical protocol.
The patient group consisted of patients with a diagno-sis of iron-deficiency anemia who were followed by the Hematology Clinic, whereas the control group consisted of healthy adult women of reproductive age. This study included only adult women of reproductive age to avoid the effects of gender, age, and hormonal status. The exclusion criteria were a previously diagnosed systemic or chronic disease or condition (e.g., hyperten-sion, smoking, ocular surgery) in one or both eyes, an axial length >24 ± 1.0 mm, and a refractive measurement exceeding 2.0 diopters.
Patients with a previous diagnosis of iron-deficiency anemia were selected randomly for inclusion in the patient group. The study included 96 eyes from 96 patients followed in this manner, and only the patients right eyes were evaluated to avoid intra-individual bias. In the control group, 60 eyes from 60 patients were also evaluated and fully assessed. Each patient was subjected individually to visual acuity, slit-lamp biomicroscopy, intraocular pressure, and fundus examinations.
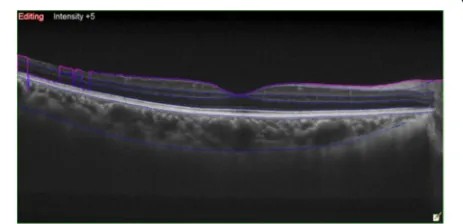
CT and macular thickness measurement was performed on an EDI-OCT scanning system (OCT Advance Nidek RS-3000; Nidek Co. Ltd., Gamagori, Japan). In all patients, the central macular thickness (FT) was measured in the right eye prior to evaluation. Patients subsequently under-went EDI-OCT scanning. Technicians then manually drew the choroid and sclera boundaries with assistance
from software programs (Fig. 1). These boundaries limited the Bruch membrane between the subfoveal points (FCT) to 500 or 1500 microns in the nasal (N500, N1500) and 500
or 1500 microns in the temporal regions (T500, T1500) for
CT measurements (Fig. 2). Choroid and sclera demar-cation was performed independently by two experi-enced technicians. The averages of the obtained values were used.
SSPS statistical software (SPSS for Windows, version 22.0; SPSS, Inc., Chicago, IL, USA) was used for the statis-tical analysis. The results of the descriptive analysis are presented as numbers, percentages, means, medians, and standard deviations. The pairedttest and chi-square test were used to compare variables between the patient and control groups, and Pearson’s correlation coefficient was used to evaluate correlations. A multiple linear regression analysis (forward) was used to determine confounding factors among the variables. APvalue < 0.05 was considered statistically significant.
Results
The anemia group consisted of 96 female patients of repro-ductive age. The mean age was 34.08 ± 10.39 years (range: 18–49 years). The control group included 60 patients with a mean age of 32.2 9 ± 8.28 years (range: 17–49 years). The groups did not differ significantly with respect to age (P=0.232). Patients with anemia had a mean hemoglobin level of 9.59 ± 1.18 (range: 6.90–11). The mean duration of anemia was 4.18 ± 3.51 years (range: 1–15 years).
Forty-nine patients with a mean age of 33.86 ± 10.21 years were in the follicular phase of the menstrual cycle. Forty-six patients with a mean age of 34.32 ± 10.68 years were in the luteal phase. There were no significant differences between the patients in each phase with respect to age, hemoglobin level (10.09 ± 1.32 vs. 10.687 ± 1.55), and CT (P= 0.8,P= 0.7, and P > 0.05, respectively; (Table 1).
No statistically significant difference was observed between the groups with respect to FT (P > 0.05). When all measured CT points were compared, the anemia group had significantly lower values than the control group (Table 2).
In the patient group, no significant association was observed between the duration of anemia and the CT (P > 0.05). However, significant correlations were ob-served between some CT points and the hemoglobin values (temporal–500 micron, r=−0.287, P= 0.001; nasal–500 microns, r=−0.287, P= 0.005; nasal–1500 microns, r=−0.245, P= 0.016; temporal–1500 mi-crons, r=−0.280, P= 0.06). Moreover, a statistically significant negative correlation was observed between age and CT (P<0.05).
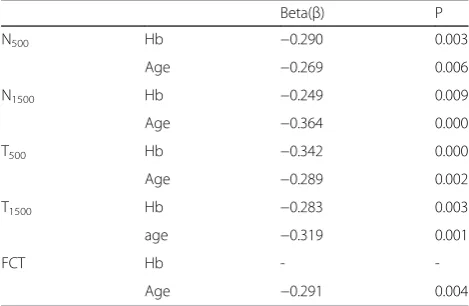
We next assessed the independent effects of age and hemoglobin level on changes in CT through a multiple linear regression analysis. Only age independently affected the FCT (p= 0.004), whereas both age and the hemoglobin independently affected the N500, N1500,
T500, and T1500 values. In other words, no overlap was
observed between these factors; each CT point was affected independently by the hemoglobin level and age, with no potential confounding effect (P <0.05 for all; Table 3).
Discussion
The choroid covers the outer retina and is among the most vascularized tissues in the body. This tissue supplies oxygen and nutrition to and provides temperature regulation for the retina. With respect to the retina, the choroid assumes the important roles of growth factor secretion and removal of retinal residues [13]. Both the structure and function
of the choroidal tissue are essential factors ensuring a normal and functional retina. An abnormal chor-oidal blood volume, impaired photoreceptor func-tion, and/or even a loss of blood flow can lead to injury [14]. The choroid features both sympathetic and parasympathetic innervation to regulate the choroidal blood flow, which is controlled by an auto-regulatory mechanism [15].
The CT may be affected by age, axial length, and refractive errors [16, 17]. Diurnal changes in CT have also been reported [18]. The choroid is affected by changes in blood pressure and intraocular pressure through an autoregulatory mechanism [19]. Because the choroid features a rich vascular structure, these changes greatly affect the autoregulation of CT [20]. For example, Tanabe et al. demonstrated a significant relation-ship between the choroidal vessel diameter and CT [21]. Similarly, Vance et al. found that phoshodiesterase-5 inhibitors such as sildenafil citrate, which promotes smooth muscle relaxation, can lead to an increased CT [22].
In the current study, we found observed a significant reduction in CT in the patient group. In a review of the literature on this subject, we did not identify any previ-ous research that would allow a direct comparison. Karaca et al. collected choroidal measurements at three points in their study of patients with obstructive sleep apnea syndrome and found no significant differences relative to control group measurements [6]. Pekel et al. evaluated choroidal changes in patients who had under-gone cardiopulmonary bypass and also failed to detect any significant changes [4]. In addition, Ngo et al. presented a case report of high altitude-induced retinopathy in a patient with significantly increased CT [23].
Hematological diseases affect millions of patients world-wide and are a significant cause of both morbidity and mortality. Anemia consists of a group of hematologic disorders characterized by a decrease in the number of red blood cells and/or hemoglobin level. Factors such as hypoxia, venous stasis, vasospasm, and increased vascular permeability have been proposed in the pathogenesis of anemic retinopathy [24–26].
Fig. 2The choroidal thickness was measured manually with software assistance
Table 1Comparison of patients in two different phases of menstrual cycle (t-test) (LP = Luteal Phase, FP = Follicular phase; std.dev: standart deviation; FCT: choroidal thickness at fovea; N500, choroidal thickness at 500μm nasal to the fovea; N1500, choroidal
thickness at 1500μm nasal to the fovea; T500, choroidal thickness at 500μm temporal to the fovea; T1500, choroidal thickness at
1500μm temporal to the fovea; FT: central macular thickness)
N Age Hbvalue FT FCT N500 N1500 T500 T1500
Mean FP 49 33.86 10.09 224.55 335.06 325.10 319.33 327.80 304.39
LP 47 34.32 10.34 226.66 324.47 318.51 315.04 310.47 288.06
Std. Dev. FP 10.21 1.33 19.23 63.42 81.71 81.71 88.59 92.29
LP 10.68 1.35 20.45 59.47 81.90 78.75 82.39 77.14
Therefore, we hypothesize that because the choroid is the most vascular area of the eye, the above factors also affect choroidal tissues in patients with iron-deficiency anemia.
In our study, we observed a significant correlation between hemoglobin levels and CT. Moreover, we observed an inverse correlation between age and CT. Ding et al. reported similar results with respect to CT in a study of areas outside the subfoveal wet area in subjects younger than 60 years of age but failed to detect a correlation between age and subfoveal CT [27].
In the Beijing Eye Study, 3468 individuals were exam-ined longitudinally, and several parameters related to the subfoveal CT was assessed [28]. That study observed
direct links between age or the degree of myopia and CT. However, the potential associations or lack thereof between blood pressure, ocular perfusion, smoking, and alcohol consumption with diabetes mellitus and arterial hypertension remain controversial. However, that study relied only on single-point measurements. Notably, choroidal volume measurements risk being subject to false information [29].
In our study, we did not observe any significant differences between the two menstrual cycle phases. Because the menstrual cycle has a short duration, it is possible that we were unable observe a hormonal effect, or that the hormonal status does not affect CT. We did observe significant but moderate or weak correlations between the hemoglobin levels and the CT values at some measured points. However, the previously observed inverse correlation between age and CT might have affected this correlation [27]. The patients ranged in age from 17 to 49 years. No significant difference was observed between the duration of anemia duration and CT. This suggests that changes in CT do not progress during the course of anemia.
Conclusion
Increasing attention is being paid to information about the choroidal structure and function. We think that as future studies of patients with anemia reveal the possible effects of this condition on choroidal tissue, the observation of decreased CT at all measured points in patients with iron-deficiency anemia might suggest the inclusion of this value as a clinical measurement in this patient population.
Table 2The numbers, mean, median ages, minimum, maximum values and choroidal thickness measurements of the study and
control groups at baseline. FCT, choroidal thickness at fovea; N500, choroidal thickness at 500μm nasal to the fovea; N1500, choroidal thickness at 1500μm nasal to the fovea; T500, choroidal thickness at 500μm temporal to the fovea; T1500, choroidal thickness at 1500μm temporal to the fovea; FT: central macular thickness. (t-test)
Age Hb value FT FCT N500 N1500 T500 T1500
Anemia N 96 96 96 96 96 96 96 96
Mean 34.08 10.21 225.58 329.88 321.88 317.23 319.31 296.40
Median 34.50 10.65 220.00 326.50 315.00 319.00 321.00 294.00
Std. Deviation 10.396 1.342 19.760 61.431 81,445 79.810 85.607 85.168
Minimum 18 7 199 201 121 109 88 79
Maximum 49 12 291 481 567 575 537 500
Control N 60 60 60 60 60 60 60 60
Mean 32.29 14.42 222.45 349.94 347.39 333.74 346.45 326.58
Median 34.00 14.00 219.00 352.00 344.00 323.00 352.00 315.00
Std. Deviation 8.283 0.95 13.513 59.064 56.718 55.549 63.100 66.157
Minimum 17 13 200 217 247 231 231 205
Maximum 49 16 256 442 508 458 525 474
P 0.254 0.000 0.276 0.043 0.032 0.157 0.033 0.019
Table 3Multiple linear regression analysis between choroidal thickness, age and hemoglobine values
Beta(β) P
N500 Hb −0.290 0.003
Age −0.269 0.006
N1500 Hb −0.249 0.009
Age −0.364 0.000
T500 Hb −0.342 0.000
Age −0.289 0.002
T1500 Hb −0.283 0.003
age −0.319 0.001
FCT Hb -
-Age −0.291 0.004
Abbreviations
EDI-OCT:enhanced-depth imaging optical coherence tomography; CT: choroidal thickness; FCT: choroidal thickness at fovea; N500: choroidal thickness at 500μm nasal to the fovea; N1500: Choroidal thickness at 1500μm nasal to the fovea; T500: choroidal thickness at 500μm temporal to the fovea; T1500: choroidal thickness at 1500μm temporal to the fovea; FT: foveal thickness (Central macular thickness); LP: luteal Phase; FP: follicular phase; RPE: retinal pigment epithelium; WHO: World Health Organization; Hb: hemoglobin.
Competing interest
The authors declare no competing interests.
Authors’contributions
EY is the first author of this article. Study design: EY, AC, SY. Ethical form preparation and application: AC. Data collection and entry: EY, HD. Contributions of reagents/materials/analytical tools: EY, AC, SY, CDY. Manuscript preparation and analytical data interpretation: EY. Manuscript writing: EY. Manuscript review: KO, EY. All authors read and approved the final manuscript.
Acknowledgements
This study was not supported by any funding project.
In this study, trial registration was requested on January 12, 2015. The trial protocol was approved by the Local Ethical Committee of the Kırıkkale University (decision no:01/04).
Author details
1Department of Ophthalmology, Kırıkkale University School of Medicine,
Kırıkkale, Turkey.2Department of Internal Medicine, Kırıkkale University School of Medicine, Kırıkkale, Turkey.3Department of Medical Oncology, Kırıkkale
University School of Medicine, Kırıkkale, Turkey.4Department of Obstetrics and Gynecology, Kırıkkale University School of Medicine, Kırıkkale, Turkey.
5
Kirikkale University Medical Faculty Hospital District Tahsin Duru Akdeniz Caddesi No: 14, Yahsihan/Kırıkkale 71450, Turkey.
Received: 24 June 2015 Accepted: 2 December 2015
References
1. Spaide RF, Koizumi H, Pozzoni MC. Enhanced depth imaging spectral domain optical coherence tomography. Am J Ophthalmol. 2009;147:644–52. 2. Margolis R, Spaide RF. A pilot study of enhanced depth imaging
optical coherence tomography of the choroid in normal eyes. Am J Ophthalmol. 2009;147:811–5.
3. Jung JW, Chin HS, Lee DH, Yoon MH, Kim NR. Changes in subfovealchoroidal thickness and choroidal extravascular density by spectral domain optical coherence tomography after haemodialysis: A pilot study. Br J Ophthalmol. 2014;98(2):207–12. 4. Pekel G, Alur I, Alihanoglu YI, Yagci R, Emrecan B. Choroidal changes after
cardiopulmonary bypass. Perfusion. 2014;29:560–6.
5. Ingegnoli F, Gualtierotti R, Pierro L, Del Turco C, Miserocchi E, Schioppo T, et al. Choroidal impairment and macular thinning in patients with systemic sclerosis: The acute study. Microvasc Res. 2015;97:31–6.
6. Karaca EE, Ekici F, Yalçın NG, Çiftçi TU, ÖzdekŞ. Macular choroidal thickness measurements in patients with obstructive apnea syndrome. Sleep Breath. 2015;19:335–41.
7. Sizmaz S, Küçükerdönmez C, Pinarci EY, Karalezli A, Canan H, Yilmaz G. The effect of smoking on choroidal thickness measured by optical coherence tomography. Br J Ophthalmol. 2013;97:601–4.
8. McLean E, Cogswell M, Egli I, Wojdyla D, de Benoist B. Worldwide prevalence of anaemia, WHO Vitamin and Mineral Nutrition Information System, 1993–2005. Public Health Nutr. 2009;12(4):444–54.
9. Balarajan Y, Ramakrishnan U, Özaltin E, Shankar AH, Subramanian SV. Anaemia in low-income and middle-income countries. Lancet. 2011;378:2123–35.
10. Kassebaum NJ, Jasrasaria R, Naghavi M, Wulf SK, Johns N, Lozano R, et al. A systematic analysis of global anaemia burden between 1990 and 2010. Blood. 2014;123:615–24.
11. Milman N, Clausen J, Byg KE. Iron status in 268 Danish women aged 18–30 years: Influence of menstruation, contraceptive method, and iron supplementation. Ann Hematol. 1998;77:13–9.
12. Beard JL. Iron requirements in adolescent females. J Nutr. 2000;130(2S Suppl):440S–2S.
13. Parver LM. Temperature modulating action of choroidal blood flow. Eye. 1991;5:181–5.
14. Cao J, McLeod S, Merges CA, Lutty GA. Choriocapillaris degeneration and related pathologic changes in human diabetic eyes. Arch Ophthalmol. 1998;116:589–97.
15. Nickla DL, Wallman J. The multifunctional choroid. ProgRetin Eye Res. 2010;29:144–68.
16. Ikuno Y, Kawaguchi K, Nouchi T, Yasuno Y. Choroidal thickness in healthy Japanese subjects. Invest Ophthalmol Vis Sci. 2010;51:2173–6.
17. Agawa T, Miura M, Ikuno Y, Makita S, Fabritius T, Iwasaki T, et al. Choroidal thickness measurement in healthy Japanese subjects by three-dimensional high-penetration optical coherence tomography. Graefes Arch
ClinExpOphthalmol. 2011;249(10):1485–92.
18. Brown JS, Flitcroft DI, Ying GS, Francis EL, Schmid GF, Quinn GE, et al. In vivo human choroidal thickness measurements: Evidence for diurnal fluctuations. Invest Ophthalmol Vis Sci. 2009;50:5–12.
19. Reiner A, Li C, Del Mar N, Fitzgerald ME. Choroidal blood flow compensation in rats for arterial blood pressure decreases is neuronal nitric oxide-dependent but compensation for arterial blood pressure increases is not. Exp Eye Res. 2010;90:734–41.
20. Kiel JW. Choroidal myogenic autoregulation and intraocular pressure. Exp Eye Res. 1994;58:529–43.
21. Tanabe H, Ito Y, Iguchi Y, Ozawa S, Ishikawa K, Terasaki H. Correlation between cross-sectional shape of choroidal veins and choroidal thickness. Jpn J Ophthalmol. 2011;55:614–9.
22. Vance SK, Imamura Y, Freund KB. The effects of sildenafil citrate on choroidal thickness as determined by enhanced depth imaging optical coherence tomography. Retina. 2011;31:332–5.
23. Ngo WK, Tan CS. Choroidal thickness in high-altitude sickness. Indian J Ophthalmol. 2014;62:1106–7.
24. Carraro MC, Rossetti L, Gerli GC. Prevalence of retinopathy in patients with anemia or thrombocytopenia. Eur J Haematol. 2001;67(4):238–44. 25. Aisen ML, Bacon BR, Goodman AM, Chester EM. Retinal abnormalities
associated with anemia. Arch Ophthalmol. 1983;101(7):1049–52. 26. Ranil PK, Raman R, Rachepalli SR, Pal SS, Kulothungan V, Lakshmipathy P,
et al. Anemia and diabetic retinopathy in type 2 diabetes mellitus. J Assoc Physicians India. 2010;58:91–4.
27. Ding X, Li J, Zeng J, Ma W, Liu R, Li T, et al. Choroidal thickness in healthy Chinese subjects. Invest Ophthalmol Vis Sci. 2011;52:9555–60.
28. Wei WB, Xu L, Jonas JB, Shao L, Du KF, Wang S, et al. Subfoveal choroidal thickness: The Beijing Eye Study. Ophthalmology. 2013;120:175–80. 29. Sanchez-Cano A, Orduna E, Segura F, Lopez C, Cuenca N, Abecia E, et al.
Choroidal thickness and volume in healthy young white adults and the relationships between the mand axial length, ammetropy and sex. Am J Ophthalmol. 2014;158(3):574–83.
• We accept pre-submission inquiries
• Our selector tool helps you to find the most relevant journal
• We provide round the clock customer support
• Convenient online submission
• Thorough peer review
• Inclusion in PubMed and all major indexing services
• Maximum visibility for your research
Submit your manuscript at www.biomedcentral.com/submit