R E S E A R C H A R T I C L E
Open Access
Corneal thickness, epithelial thickness and axial
length differences in normal and high myopia
Xiaogang Wang
1†, Jing Dong
2†and Qiang Wu
3*Abstract
Background:Corneal biometric parameters can possibly be influenced by high myopia (HM). The influence of HM on corneal thickness (CT), epithelial thickness (ET) has not yet been clearly established. The aim of this study is to observe ET, CT and axial length (AL) differences between in normal and subjects with HMs and to investigate factors influencing the corneal biometric parameters and AL, such as age and gender.
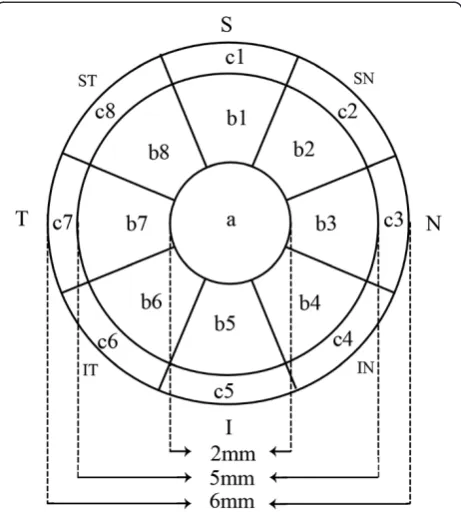
Methods:A total of 97 normal subjects (97 eyes) and 48 HM subjects (48 eyes) were included. The ET and CT of the central 6-mm diameter (17 regions) and the AL data were captured. The 17 corneal and epithelial regions were the center (1 mm radius, area a), the inner ring (2.5 mm radius, area b), the outer ring (3 mm radius, area c) and the 8 radial scan lines in eight directions (Superior (1) , SN (2), Nasal (3), IN (4), Inferior (5), IT (6), Temporal (7), ST (8)) with an angle of 45° between each consecutive scan line (a, b 1–8, c 1–8).
Results:The ALs were increased about 4 mm in the HMs (P < 0.001). No differences in ET were observed; in contrast, significantly thicker CTs were observed in the HMs in 16 regions except the b5 subregion. In normal group, age was negatively correlated with AL but not CCT and CET and gender was correlated with CET. In HM group, age was not correlated with CCT , AL or CET and gender was correlated with AL and CCT but not CET. Conclusions:CT was thicker in the HMs but not ET. Age and gender should be considered for AL, CT and ET in both normal and HM group.
Keywords:Axial length, Corneal thickness, Epithelial thickness, High myopia, Optical coherence tomography
Background
Corneal biometric parameters and axial length (AL) can possibly be influenced by the degrees of refractive error. The influence of refractive error on corneal thickness (CT), epithelial thickness (ET) has not yet been clearly established [1-3]. High myopia (HM) plays an important role in visual impairment and is highly common in China, particularly in the school population [4,5]. HM patients are at greater risks of posterior subcapsular cat-aracts, glaucoma and chorioretinal abnormalities [6]. The known severe visual problems primarily result from posterior segment complications, such as macular holes, choroidal neovascularization, retinal detachment, reti-noschisis, etc. Regarding the anterior segment, HM may affect CT in different age groups [1,2]. However, little
research into comparing mid-peripheral CT and ET be-tween normal subjects and those with HM on Chinese populations. Moreover, the central CT (CCT) results in HM is controversial and this require further study to clarify the topic [1,2,7].
Therefore, the purpose of this study was to evaluate CT, ET and AL differences between Chinese normal and HM groups to clarify the changing tendency of central, mid-peripheral CT, ET in Chinese HMs.
Methods
This study was performed at the Affiliated Sixth People's Hospital Shanghai Jiao Tong University (Shanghai, China). The research protocols were approved by the in-stitutional review boards of the Affiliated Sixth People's Hospital Shanghai Jiao Tong University (Shanghai, China) and performed in accordance with the tenets of the Declaration of Helsinki. Written informed consent was obtained from each subject after they were provided with an explanation of the nature of the study.
* Correspondence:[email protected] †Equal contributors
3
Affiliated Sixth People’s Hospital Shanghai Jiao Tong University, Shanghai, P.R. China
Full list of author information is available at the end of the article
Subjects
We just chose Han Chinese subjects to eliminate the possible influences of different ethnic groups. The nor-mal and HM subjects were chosen from the Ophthalmic Clinic Center at the Shanghai Sixth People’s Hospital. One random eye of each subject was chosen for this study. The inclusion criteria for the normal subjects in-cluded the following: a best-corrected visual acuity (BCVA) of≥16/20, a refractive error < 5 diopter (D) spheres, normal slit-lamp and fundoscopy examinations, an IOP < 22 mmHg, and no history of ocular or systemic cor-ticosteroid use. The inclusion criteria for the HM subjects were as follows: a BCVA of≥20/40, a spherical refractive error more negative than −6 diopters, and central fixation sufficiently stable to perform image capture. Subjects with keratoconus, previous corneal lesions and prior surgery in the cornea, severe cataracts, glaucoma or posterior abnor-malities, such as choroidal neovascularization, retinoschisis, retinal detachment or macular holes, were excluded.
ET and CT measurement
An Optovue RTVue (Optovue Inc., Fremont, CA, USA) and a supplemental cornea-anterior module (CAM) at-tachment were used for the epithelial and corneal pachy-metry scans. Several studies have shown that RTVue has excellent repeatability and reproducibility in both CT and ET measurements [8,9]. The RTVue scans an area of 6 × 6 mm in the central cornea with a depth reso-lution approximately 5μm. The light source of the sys-tem uses super luminescent diodes with wavelengths of 840 nm. Eight radial line scans with 1024 A-scans each for the corneal and epithelial pachymetry maps are used to demonstrate the average CT and ET in each of the 17 regions as described in our previous research [10]. These regions (Figure 1) are the center (1 mm radius, area a), the inner ring (2.5 mm radius, area b), the outer ring (3 mm radius, area c), and the eight radial scan lines in eight directions (superior (1), SN (2), nasal (3), IN (4), in-ferior (5), IT (6), temporal (7), and ST (8)) with angles of 45° between each consecutive scan line (a, b 1–8, c 1–8)). All of the images in this study were captured by an experi-enced and trained technician. All of the corneal and epi-thelial pachymetry data were automatically calculated by the RTVue software (version 6.11.0.12). During each scan, the technician captured each cross-sectional corneal image with the light beam at the midpoint to ensure that the scan location was in the center area of the cornea.
AL measurement
A Lenstar LS 900 biometer (Haag-Streit AG, Koeniz, Switzerland) and its internal software (version 2.1.1)were used for the AL measurements. The Lenstar LS 900 biometer uses optical low-coherence reflectometry and a central wavelength of 820 μm to measure the AL to the
retinal pigment epithelium [11]. During the examination, the patients were asked to fixate on the internal red light, and the device focus was based on the image of the eye on the monitor. The patients were asked to per-form a complete blink to make ensure an optically smooth tear film over the cornea prior to image capture. Measurements that were contaminated by patient blink-ing or unstable fixation were excluded, and one non-contaminated measurement for each eye was used in the final analysis.
Statistical analyses
The statistical analyses were performed with commercial software (SPSS ver. 13.0; SPSS Inc.). The means ± the standard deviations of each variable were assessed for both the normal and HM groups. To compare the ET, CT and AL variables measured in the normal and HM eyes, inde-pendent sample t-tests were used. The correlation coeffi-cients were also calculated for age, gender, ET, CT and AL in each group. The significance level for all of the tests was set at 5%.
Results
Data from one random eye of 97 normal subjects and 48 HM patients were analyzed (Table 1). There was no sig-nificant difference in age between the 2 groups. However, there were significant difference in gender, spherical error and astigmatism between the 2 groups.
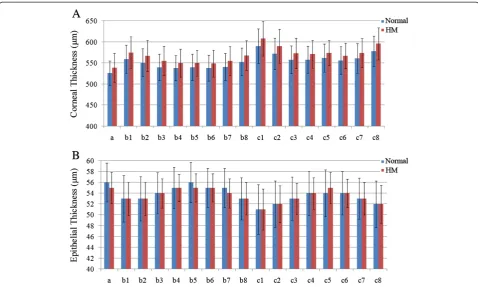
Significant differences in the CT and AL values were found between the normal and HM eyes, but no differ-ence was found in the ET values (Table 2, Figure 2). Compared to the normal eyes, the ALs of the HM eyes were significantly increased by 16% (P < 0.001). In con-trast to our finding of no difference in the ETs, signifi-cantly thicker CTs in the HM eyes were found in all 17 regions, and the c1, c2 and c8 regions exhibited the lar-gest biglar-gest differences.
Age was negatively associated with AL but not CCT and CET in normal group. In the HM group, age was not asso-ciated with CCT , AL or CET. In the normal group, gen-der has significant correlation with CET but no CCT and AL; in the HM group, gender was correlated with CCT and AL but not with CET (Table 3).
Discussion
Due to the longer eyeballs of the HM subjects, both the anterior and posterior segments exhibited some abnor-malities [6,12]. In this study, we evaluated the correla-tions between age, gender, CT, ET and AL in normal and HM groups. We also investigated the differences in the CTs, ETs, ALs between the two groups. Similar to the scatter plot showing a strong association between higher myopia and longer ALs shown in the study by Kubo et al., significantly longer ALs were found in the HM group than in the normal group in the present study [13].
As the first cellular layer of the human cornea, the corneal epithelium plays an important role in the evaluation of corneal remodeling after refractive sur-gery [14]. Several technologies can measure ET, such as confocal microscopy, very-high frequency ultra-sound, time-domain optical coherence tomography (TD-OCT) and spectral-domain optical coherence tomography (SD-OCT) [15-18]. Reinstein et al. re-ported CET of 53.4 ± 4.6 μm in normal corneas using very-high frequency ultrasound [16]. The measure-ments of Reinstein et al., which did not include pre-corneal tear film thickness, were thinner than the CET of 56 ± 3.6μm of the normal eyes found in the present study. Tear film thickness measurements were included in
our study, and may account for this difference. Previous studies have reported varying CET values for normal cor-neas using TD/SD-OCT, even when the same brand of Table 1 Characteristics of normal subjects and subjects
with high myopia
Characteristics Normal High myopia PValue*
Patients, n 97 48
Eyes, n 97 48
Age (yrs) 56 ± 18 51 ± 20 0.188
Gender (male/female) 33/64 25/23 0.037
Spherical error (diopter) −1.27 ± 0.64 −9.11 ± 3.63 0.000
Astigmatism (diopter) 0.89 ± 0.50 1.45 ± 0.89 0.000
*All calculated by t test, except the values in bold, which was calculated by chi-square test.
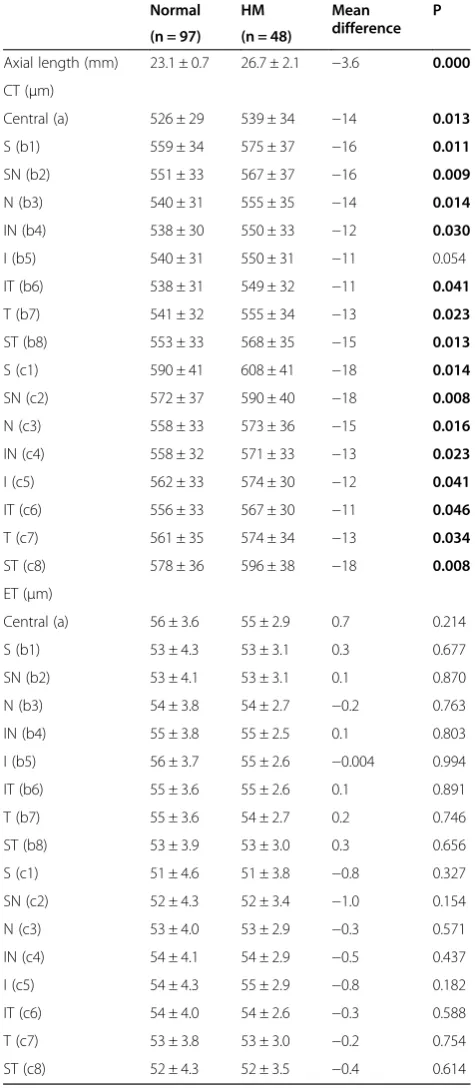
Table 2 Summary of the axial length, corneal thickness and epithelial thickness of normal and high myopia groups
Normal HM Mean
difference P
(n = 97) (n = 48)
Axial length (mm) 23.1 ± 0.7 26.7 ± 2.1 −3.6 0.000
CT (μm)
Central (a) 526 ± 29 539 ± 34 −14 0.013
S (b1) 559 ± 34 575 ± 37 −16 0.011
SN (b2) 551 ± 33 567 ± 37 −16 0.009
N (b3) 540 ± 31 555 ± 35 −14 0.014
IN (b4) 538 ± 30 550 ± 33 −12 0.030
I (b5) 540 ± 31 550 ± 31 −11 0.054
IT (b6) 538 ± 31 549 ± 32 −11 0.041
T (b7) 541 ± 32 555 ± 34 −13 0.023
ST (b8) 553 ± 33 568 ± 35 −15 0.013
S (c1) 590 ± 41 608 ± 41 −18 0.014
SN (c2) 572 ± 37 590 ± 40 −18 0.008
N (c3) 558 ± 33 573 ± 36 −15 0.016
IN (c4) 558 ± 32 571 ± 33 −13 0.023
I (c5) 562 ± 33 574 ± 30 −12 0.041
IT (c6) 556 ± 33 567 ± 30 −11 0.046
T (c7) 561 ± 35 574 ± 34 −13 0.034
ST (c8) 578 ± 36 596 ± 38 −18 0.008
ET (μm)
Central (a) 56 ± 3.6 55 ± 2.9 0.7 0.214
S (b1) 53 ± 4.3 53 ± 3.1 0.3 0.677
SN (b2) 53 ± 4.1 53 ± 3.1 0.1 0.870
N (b3) 54 ± 3.8 54 ± 2.7 −0.2 0.763
IN (b4) 55 ± 3.8 55 ± 2.5 0.1 0.803
I (b5) 56 ± 3.7 55 ± 2.6 −0.004 0.994
IT (b6) 55 ± 3.6 55 ± 2.6 0.1 0.891
T (b7) 55 ± 3.6 54 ± 2.7 0.2 0.746
ST (b8) 53 ± 3.9 53 ± 3.0 0.3 0.656
S (c1) 51 ± 4.6 51 ± 3.8 −0.8 0.327
SN (c2) 52 ± 4.3 52 ± 3.4 −1.0 0.154
N (c3) 53 ± 4.0 53 ± 2.9 −0.3 0.571
IN (c4) 54 ± 4.1 54 ± 2.9 −0.5 0.437
I (c5) 54 ± 4.3 55 ± 2.9 −0.8 0.182
IT (c6) 54 ± 4.0 54 ± 2.6 −0.3 0.588
T (c7) 53 ± 3.8 53 ± 3.0 −0.2 0.754
ST (c8) 52 ± 4.3 52 ± 3.5 −0.4 0.614
CT = corneal thickness; ET = epithelial thickness; HM = high myopia; I = inferior; N = nasal; S = superior; T = temporal.
OCT device was used [17-19]. These fluctuations may be attributable to different races, ages and sample sizes.
Regarding the CCT measurements, our results are very similar to those of Wong et al. who examined a sample of normal Hong Kong Chinese people using SD-OCT [20]. Compared to our previous research that has used the Galilei Scheimpflug system, OCT produced thinner CCT values [21,22]. This difference may be at-tributable to differences in the measuring techniques.
This study revealed significantly thicker CTs in 16 re-gions of the central 6 mm in the HM group. This result is in agreement with that of Kunert et al. who studied an Indian population [7]. However, this result is different from the thinner or unaltered CTs that have been re-ported for HM samples in previous studies [2,23]. There are several possible reasons for this difference. First, we
assume that there are different stages of the changes of CT in HM; e.g., early, middle, and advanced stages. There might be different CTs associated with each stage, and research into these myopic stages should be per-formed. Second, CT exhibits a 24-hour fluctuation, which might have influenced the final measurement values for the statistical analyses of different studies due to differ-ences in measurement times [24]. Third, the refractive range for HM, which may influence the CT, were different in each study. In contrast to the thicker CTs of the HM eyes, no differences in ET between the two groups were identified in any of the 17 sub-regions, which indicates that the changes in CT were primarily attributable to the corneal stroma.
In the present study, age was negatively associated with AL in the normal group, and this finding is similar
Figure 2Histograms comparing the corneal thickness(A)and epithelial thicknesses(B)of the 17 regions between the normal and high myopia groups.
Table 3 Correlation coefficient matrix for the associations of gender, age with corneal thickness, epithelial thickness, and axial length in normal and high myopia groups
Normal (n = 97) HM (n = 48)
Gender Age Gender Age
AL (mm) −0.153 (0.134) −0.245 (0.016) −0.310 (0.032) 0.210 (0.151)
CCT (μm) −0.113 (0.269) 0.077 (0.453) −0.411 (0.004) 0.031 (0.832)
CET (μm) −0.302 (0.003) −0.145 (0.157) 0.056 (0.704) −0.259 (0.076)
The table cells display the correlation coefficients (P-values are based on Pearson correlation analyses).
to the finding of an increase in AL with decreasing age at the time of cataract surgery of the research of Tuft et al. [25]. In contrast to AL, CCT was found to remain constant with age at the resolution available using the SD-OCT in both the normal and HM groups, which ex-hibited results that were similar to those of previous studies that have used the Scheimpflug system and TD-OCT [22,26]. The influence of gender on CET in normal group and CCT, AL in HM group may attribute to the endocrine differences between man and women. Previ-ous research revealed that gonadal hormones may affect ocular tissue growth by genomic or nongenomic path-way [27,28].
The current study has some limitations. First, the nor-mal participants were not gender matched to the HM group. Second, the potential for segmentation errors by the automated software, the drift of the measurements that can be caused by instrument vibration during oper-ation and the signal instability should be considered. Third, additional studies with larger HM samples that in-clude multiple races and more even gender distributions are also needed. However, The corneal biometric parame-ters changing in HM of this study may be an important in-dicator for refractive surgery choosing or designing.
Conclusions
In this report, the CTs of the HM group were signifi-cantly thicker, particularly in the c1, c2 and c8 subre-gions. Age and gender should be noticed for AL, CT and ET in both normal and HM group.
Competing interests
The authors declare that they have no competing interests.
Authors’contributions
XGW carried out this research, collected data, made analysis and interpretation of data and drafted the manuscript. JD collected data, made analysis and interpretation of data. XGW and QW conceived of the study, and participated in its design and coordination and helped to draft the manuscript. All authors read and approved the final manuscript.
Author details
1
Shanxi Eye Hospital, Shanxi, P.R. China.2The First Hospital of Shanxi Medical University, Shanxi, P.R. China.3Affiliated Sixth People’s Hospital Shanghai Jiao
Tong University, Shanghai, P.R. China.
Received: 10 January 2015 Accepted: 29 April 2015
References
1. Chang SW, Tsai IL, Hu FR, Lin LL, Shih YF. The cornea in young myopic adults. Br J Ophthalmol. 2001;85(8):916–20.
2. Pedersen L, Hjortdal J, Ehlers N. Central corneal thickness in high myopia. Acta Ophthalmol Scand. 2005;83(5):539–42.
3. Al-Mezaine HS, Al-Obeidan S, Kangave D, Sadaawy A, Wehaib TA, Al-Amro SA. The relationship between central corneal thickness and degree of myopia among Saudi adults. Int Ophthalmol. 2009;29(5):373–8.
4. Sun J, Zhou J, Zhao P, Lian J, Zhu H, Zhou Y, et al. High prevalence of myopia and high myopia in 5060 Chinese university students in Shanghai. Invest Ophthalmol Vis Sci. 2012;53(12):7504–9.
5. Morgan IG, Ohno-Matsui K, Saw SM. Myopia. Lancet. 2012;379(9827):1739–48.
6. Saw SM, Gazzard G, Shih-Yen EC, Chua WH. Myopia and associated pathological complications. Ophthalmic Physiol Opt. 2005;25(5):381–91. 7. Kunert KS, Bhartiya P, Tandon R, Dada T, Christian H, Vajpayee RB. Central
corneal thickness in Indian patients undergoing LASIK for myopia. J Refract Surg. 2003;19:0378–9.
8. Ma XJ, Wang L, Koch DD. Repeatability of corneal epithelial thickness measurements using Fourier-domain optical coherence tomography in normal and post-LASIK eyes. Cornea. 2013;32(12):1544–8.
9. Chen S, Huang J, Wen D, Chen W, Huang D, Wang Q. Measurement of central corneal thickness by high-resolution Scheimpflug imaging, Fourier-domain optical coherence tomography and ultrasound pachymetry. Acta Ophthalmol. 2012;90(5):449–55.
10. Wang X, Wu Q. Normal corneal thickness measurements in pigmented rabbits using spectral-domain anterior segment optical coherence tomography. Vet Ophthalmol. 2013;16(2):130–4.
11. Rohrer K, Frueh BE, Walti R, Clemetson IA, Tappeiner C, Goldblum D. Comparison and evaluation of ocular biometry using a new noncontact optical low-coherence reflectometer. Ophthalmology. 2009;116(11):2087–92. 12. Jones D, Luensmann D. The prevalence and impact of high myopia.
Eye Contact Lens. 2012;38(3):188–96.
13. Kubo E, Kumamoto Y, Tsuzuki S, Akagi Y. Axial length, myopia, and the severity of lens opacity at the time of cataract surgery. Arch Ophthalmol. 2006;124(11):1586–90.
14. Huang D, Tang M, Shekhar R. Mathematical model of corneal surface smoothing after laser refractive surgery. Am J Ophthalmol. 2003;135(3):267–78. 15. Erie JC, Patel SV, McLaren JW, Ramirez M, Hodge DO, Maguire LJ, et al. Effect
of myopic laser in situ keratomileusis on epithelial and stromal thickness: a confocal microscopy study. Ophthalmology. 2002;109(8):1447–52. 16. Reinstein DZ, Archer TJ, Gobbe M, Silverman RH, Coleman DJ. Epithelial
thickness in the normal cornea: three-dimensional display with Artemis very high-frequency digital ultrasound. J Refract Surg. 2008;24(6):571–81. 17. Sin S, Simpson TL. The repeatability of corneal and corneal epithelial
thickness measurements using optical coherence tomography. Optom Vis Sci. 2006;83(6):360–5.
18. Kanellopoulos AJ, Asimellis G. In vivo 3-dimensional corneal epithelial thickness mapping as an indicator of dry eye: preliminary clinical assessment. Am J Ophthalmol. 2014;157(1):63–8. e62.
19. Wu S, Tao A, Jiang H, Xu Z, Perez V, Wang J. Vertical and horizontal corneal epithelial thickness profile using ultra-high resolution and long scan depth optical coherence tomography. PLoS One. 2014;9(5):e97962.
20. Wong AC, Wong CC, Yuen NS, Hui SP. Correlational study of central corneal thickness measurements on Hong Kong Chinese using optical coherence tomography, Orbscan and ultrasound pachymetry. Eye (Lond). 2002;16(6):715–21.
21. Wang X, Dong J, Wu Q. Evaluation of anterior segment parameters and possible influencing factors in normal subjects using a dual scheimpflug analyzer. PLoS One. 2014;9(5):e97913.
22. Wang X, Wu Q. Investigation of the human anterior segment in normal Chinese subjects using a dual Scheimpflug analyzer. Ophthalmology. 2013;120(4):703–8.
23. Ucakhan OO, Gesoglu P, Ozkan M, Kanpolat A. Corneal elevation and thickness in relation to the refractive status measured with the Pentacam Scheimpflug system. J Cataract Refract Surg. 2008;34(11):1900–5.
24. Fogagnolo P, Capizzi F, Orzalesi N, Figus M, Ferreras A, Rossetti L. Can mean central corneal thickness and its 24-hour fluctuation influence fluctuation of intraocular pressure? J Glaucoma. 2010;19(6):418–23.
25. Tuft SJ, Bunce C. Axial length and age at cataract surgery. J Cataract Refract Surg. 2004;30(5):1045–8.
26. Germundsson J, Karanis G, Fagerholm P, Lagali N. Age-related thinning of Bowman's layer in the human cornea in vivo. Invest Ophthalmol Vis Sci. 2013;54(9):6143–9.
27. Giuffre G, Di Rosa L, Fiorino F, Bubella DM, Lodato G. Variations in central corneal thickness during the menstrual cycle in women. Cornea. 2007;26(2):144–6.